Analysis of the Fatty Acids and Phenolic Compounds in a Cereal-Based Fermented Food (Tarhana) ()
1. Introduction
Tarhana is a traditional fermented food with high nutritional quality and long shelf-life, as well as being an important part of the diet for people in Turkey. The ingredients and the production method of Tarhana are different among localities in Turkey [1] . The basic ingredients used during its preparation are wheat flour, baker’s yeast, spices (salt, paprika, mint, etc.), vegetables (tomato, pepper, and onion) and yogurt [2] [3] . Tarhana preparation consists in mixing all ingredients until form bread dough, followed by their fermentation during 1 to 7 days. After such process, the fermented dough (wet Tarhana) can be consumed as soup or can be sun dried and ground to certain particle size to make instant Tarhana powder. Tarhana is generally consumed as an appetizer [4] . The type and ratios of ingredients as well the production method used among regions in Turkey, changes the chemical composition, sensory attributes and nutritional properties of Tarhana [2] [4] . Although Tarhana is widely consumed in Turkey, there is lack of information about its nutritional properties, especially phenolic compounds and fatty acids, which are important bioactive compounds.
Phenolic compounds, commonly known as polyphenols, are present in plants and processed foods, therefore in our diet [5] . Polyphenols are classified as simple phenolic acids (hydroxybenzoic and hydroxycinnamic acids) and flavonoids (anthocyanins, flavones, catechins, flavanols, flavonones, and isoflavones [condensed and hydrolysable tannins]) [6] . Flavonoids are the most common in plant-derived products. However, their levels among diets will depend on the type and quantity of plants foods consumed [5] . The phenolic compounds are the most readily absorbed in the stomach and small intestine. Most of these compounds in foods are gallic acid, catechins, free hydroxycinnamic acids and anthocyanins [6] . Polyphenols affect foods’ sensory properties, such as flavor, astringency, aroma, and color. Furthermore, polyphenols have a potential as nutraceuticals and act as powerful antioxidants [4] . The antioxidant properties of phenolic compounds have been studied in rats, where differences in cholesterol levels were observed, depending on the type and concentration of polyphenols used. This investigation showed that different polyphenols might have diverse mechanisms to induce responses on different lipid components [7] .
Other bioactive compounds are the polyunsaturated fatty acids (PUFA). α-linolenic (C18: 3n-3) and α-linoleic (C18: 2n-6) are essential fatty acids which are not synthesized by the human body, and so should be obtained through the diet [8] . These essential fatty acids are related to the prevention or reduction of incidence of cardiovascular disease and cancer [9] . However, the dietary ratio n-6/n-3 fatty acids should be 4/1. Higher ratio of n-6 fatty acids may result in negative health effects [8] . The n-6 fatty acids promote the formation of eicosanoid metabolic products from arachidonic acid (AA) in larger quantities than that of from n-3 fatty acids, especially eicosapentaenoic acid (EPA). Eicosanoid from AA (active in very small quantities), contribute to the formation of thrombus and atheromas, to allergic and inflammatory disorders and proliferation of cells. So, a diet rich in n-6 fatty acids may cause obesity, hypertriglyridemia, and cardiovascular disease [10] . Because of that, it has been recommended to have a balance between n-3 and n-6 fatty acids in the diet.
If Tarhana is prepared with various ratios and types of wheat flour, yogurt and spices (good sources of phenolic compounds), the bioactive compounds (polyphenols and polyunsaturated fatty acids) could also differ among samples. Analysis of the phenolic compound content was measured because of the effect on the peroxidation of lipids though the prevention of free radical attacks on PUFA. The aim of this study was to determine the color, phenolic compounds and fatty acid composition of fifteen home-made Tarhana samples, collected from four different cities in the Thrace Region of Turkey to increase the information about the bioactive compounds present in this traditional fermented food.
2. Materials and Methods
2.1. Materials
The ingredients used in Tarhana preparation were commercial white wheat flour, semolina, yogurt, tomato paste, fermented white wheat bread dough, lentil flour, onion, table salt and sunflower oil. All the samples were home-made and collected randomly from four cities (Tekirdag, Canakkale, Edirne and Kirklareli) of Trakya region of Turkey (Figure 1).
2.2. Sample Preparation
Samples were ground using a UDY mill (UDY Corp., Fort Collins, CO) with a 0.8 mm screen to reduce the particle size to a uniform size for all samples. The ground samples were blended and placed in zip-top plastic bags and stored at 4˚C before further analysis.
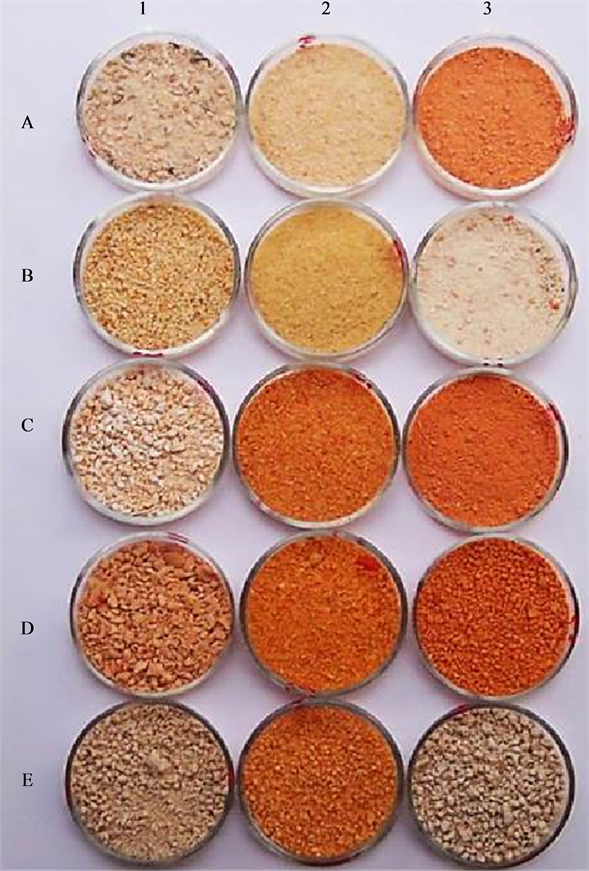
Figure 1. Tarhana powder. A1, B1, C1: Edirne; D1, E1, D3, E3: Tekirdag; A2, B2, C2, D2, E2: Canakkale; and A3, B3, C3: Kirklareli; all cities are from the region of Trakya, Turkey.
2.3. Color
The color of the samples was measured using a Minolta Chroma Meter CR-400. The color was reported on the CIE-Lab color scale. L* represents whiteness and the greater the number the more white. Red and green is corresponds to the a* value, where positive values indicate more redness and negative values indicate more greenness. The b* value represents blue/yellow and positive values indicate more yellowness and negative values indicate more blueness. The C* value represents the chroma and the higher the C* value the more vivid the color. The hue is indicated by h− and corresponds to the pure color of the sample and is calculated from the L*, a* and b* values.
2.4. Extractable Polyphenols
Samples were extracted by shaking at room temperature with methanol: water acidified with HCl (50:50 v/v, pH 2, 50 mL/g sample, 60 min, room temperature; constant shaking) and acetone: water (70:30 v/v, 50 mL/g sample, 60 min, room temperature; constant shaking). After centrifugation (15 min, 25˚C, 3000 g), supernatants were combined and used to determine extractable polyphenols which were determined by the Folin-Ciocalteau procedure, using a ferulic and galic acid to prepare a standard curves [11] . The results were expressed as ferulic and galic acid equivalents (FAE and GAE, respectively).
2.5. Fatty Acid Analysis
Fatty acid methyl esters (FAME) were prepared from the Tarhana oils after alkaline hydrolysis, followed by methylation in methanol plus BF3 (14% boron trifluoride). The final concentration of the FAME was approximately 7 mg/ml in heptanes [12] . Analyses of the FAME by capillary GLC were carried out on a Hewlett-Packard 6890 chromatograph, equipped with a flame ionization detector (FID) on a split injector. A fused-silica capillary column was used, CPTM-Sil 88, 50 m × 0.25 mm i.d., 0.2 µm film; Chrompack. The column was operated isothermally at 177˚C and injector and detector were kept at 250˚C. The carrier gas was helium at a flow rate of 1 ml/min.
The fatty acid methyl esters peaks were identified comparing their retention times with individual standard FAMEs, approximately 99% pure (Supelco, USA) and analyzed using Total Chrom Workstation Software. The relative percentage of the fatty acid was calculated on the basis of the peak area of a fatty acid species to the total peak area of all the fatty acids in the oil sample.
2.6. Statistical Analysis
Color properties and phenolic compounds were done in duplicate, while fatty acids were done in triplicate. The data obtained were analyzed by ANOVA using the SPSS statistical package program, and differences among the means were compared using the Duncan’s multiple range test [13] .
3. Results and Discussion
3.1. Color of Tarhana Soup Samples
Variations in Tarhana formulations resulted in significant (P < 0.05) differences in the color of the samples. The color values of the Tarhana samples are given in Table1 Color L*, a*, b* values range from 73.04 - 87.44, 0.53 - 16.99 and 12.45 - 34.74, respectively. The values are similar to those reported by other authors [14] [15] . The

Table 1 . Color of Tarhana soup samplesa.
aMean of two determinations. Values with different letters in the same column are significantly different (P < 0.05) by Duncan’s multiple range test. bA1, B1, C1: Edirne; D1, E1, D3, E3: Tekirdag; A2, B2, C2, D2, E2: Canakkale; and A3, B3, C3: Kirklareli; all cities are from the region of Trakya, Turkey.
sample C1 had the highest L* value (87.44) indicating its whiteness compared to the rest of the samples; while A3, C2, C3, D2 and D3 samples showed the highest a* and b* values showing redness and yellowness, respectively. The intensity of the color indicated by C* value is higher in the C3 sample (38.67). This sample also had highest a* and b* values compared to all the samples, as well as the lowest whiteness (L* = 73.04). On the other hand, the highest h~ values were found in B3, E2 and E1 samples, which means that these samples had a more pure color. Tarhana samples are home-made with a variety of raw or cooked vegetables (tomatoes, onions, green pepper) and spices (mint, paprika), which change the color of Tarhana soup. Differences in color could also be due to the formation of Maillard reaction products during the drying process [2] . It has been mentioned that phenolic compounds are natural food pigments that influence the color of vegetable food products. These compounds are related to the prevention of diseases associated with oxidative stress, such as cancer, cardiovascular and degenerative diseases [16] .
3.2. Extractable and Hydrolysable Polyphenols
Polyphenols are the most abundant phytochemicals in our diet. The vast majority of the studies report extractable polyphenols or total phenolic compounds. However, there is a portion of polyphenols bound to cell wall constituents or trapped within the food matrix that remain in the insoluble residue after the isolation of extractable polyphenols. The unextractable polyphenols may not be determined, but could be bioavailable in the colon [17] . The extractable (EP) and hydrolysable (HP) polyphenols of Tarhana samples were determined (Table 2). Because wheat flour is the main ingredient in Tarhana soup, and it has been reported that ferulic acid, gallic acid derivatives, among others, are the principal polyphenols in plant foods [18] . The results were expressed in ferulic and gallic equivalents (FAE and GAE, respectively) for both EP and HP. It was observed that EP and HP in Tarhana were observed at higher levels when expressed as FAE rather than as GAE. This is because ferulic acid is the most abundant phenolic compound in wheat. D3 sample had the highest EP for both FAE and GAE (7.59 mg/g and 4.27 mg/g, respectively) compared to the rest of the samples; while C1 had the lowest EP FAE (3.82 mg/g) and GAE (2.24 mg/g) values. The variation observed in the EP among the samples could be attributed to the vegetables, spices and other ingredients used during Tarhana preparation among locations in Trakya, Turkey.
Table 2. Extractable and hydrolysable polyphenols in Tarhana soup samplesa.
aMean of two determinations. Values with different letters in the same column are significantly different (P < 0.05) by Duncan’s multiple range test. bA1, B1, C1: Edirne; D1, E1, D3, E3: Tekirdag; A2, B2, C2, D2, E2: Canakkale; and A3, B3, C3: Kirklareli; all cities are from the region of Trakya, Turkey. cDWB = Dry weight basis. dFAE = Ferulic acid equivalent. eGAE = Gallic acid equivalent.
Fardet et al. [19] mentioned that ferulic acid is esterified to arabinose residues in the cell wall arabinoxylans. This means that acidic hydrolysis may be useful to obtain a more accurate value for polyphenol content and express the amount of polyphenols which could be released later during fermentation in the colon and exert antioxidant properties [17] [19] .
3.3. Fatty Acid Composition
The fatty acid composition of Tarhana soup is shown in Table3 The total saturated fatty acids (TSFA) of the Tarhana soup varied from 52.84% to 18.3% and significant differences (P < 0.05) were observed. Samples A2, B2 and D1 showed the highest TSFA content. Palmitic acid (C16:0) was the most predominant saturated fatty acid present in Tarhana followed by stearic acid (C18:0) with values ranging from 16.90% - 37.66% and 0.65% - 11.34%, respectively. Erbas et al. [20] determined that the principal source of palmitic acid in Tarhana is yogurt. According to Serafeimidou et al. [21] , Greek yogurt prepared with three different kinds of milk presented myristic, stearic and palmitic acid as the major fatty acids. Although the yogurt used in Tarhana preparation may not have been Greek yogurt, the fatty acid composition should be similar in both dairy products. This is because both are prepared with milk in a similar manner. The TSFA in Tarhana is most likely due to the presence of yogurt and its content depends on the amount and composition of this product used in the preparation of Tarhana among locations in Trakya, Turkey.
Table 3. Fatty acid composition of Tarhanasoupa.
aMean of three determinations. Values with different letters in the same row are significantly different (P < 0.05) by Duncan’s multiple range test. bA1, B1, C1: Edirne; D1, E1, D3, E3: Tekirdag; A2, B2, C2, D2, E2: Canakkale; and A3, B3, C3: Kirklareli; all cities are from the region of Trakya, Turkey. cTSAFA = Total saturated fatty acids. dTMUFA = Total mono-unsaturated fatty acids. eTPUFA = Total poly-unsaturated fatty acids. fTUFA = Total unsaturated fatty acids.
The total monounsaturated fatty acids (TMUFA) content in the samples was between 59.68% and 18.58%; where A3, B1 and C2 showed the highest values (Table 3). Statistically, significant differences (P < 0.05) were observed for MUFA contents of the Tarhana soup. The most predominant MUFA was oleic acid (C18:1) and the one which showed the highest values among them. The similar trend was observed in the data reported by Erbas et al. [20] in Tarhana soup fermented during three days and submitted to different storage conditions and lengths. In our samples, the oleic acid presented higher values (16.41% - 57.69%) compared to the value reported by Erbas et al. (2006) (12.7%, fermentation time and 13.2% storage type and period). This is because of differences in the ingredients used during Tarhana preparation, fermentation and storage time. When the total poly-unsaturated fatty acids (TPUFA) were analyzed, linoleic acid (C18:2) was the most predominant with values between 9.74% - 56.31%, presenting significant differences (P < 0.05) (Table 3). Linoleic acid was found in relatively high levels in Tarhana samples, especially in E3, A1, D2, C1 and B3. On the other hand, linolenic acid (C18:3) was found at low concentrations (0.78% - 6.81%). Not all PUFA are essential fatty acids; however, linoleic and linolenic acids are considered essential because they cannot be synthesized by the human body and have to be obtained through the diet [8] . The total unsaturated fatty acids (TUFA) are the sum of MUFA and PUFA. So, Tarhana samples with highest values of TUFA were E3, A3, A1 and B1; however, significant differences (P < 0.05) among samples were detected. Since TUFA play an important role in the cellular membrane [9] ; they are related to the reduction of incidence of cardiovascular disease and cancer [8] . Because Tarhana had higher linoleic acid (n-6) than linolenic acid (n-3), it will be important to analyze the n-6/n-3 ratio, which suggests restrictions on the consumption of foods, this case Tarhana. Lower values of n-6/n-3 ratio are good from the point of view nutrition because is related with optimal health, normal development and prevention of chronic disease [9] .
The ratios of TSAFA to TUFA in all samples ranged from 0.22 - 1.12 indicated that all samples except for A2, B2 and D1 presented high concentration of unsaturated fatty acids. This is because of the predominant presence of oleic and linoleic acids in almost all the samples. Trans unsaturated fatty acids in the Tarhana samples were not detected. Which is good, because this type of fatty acids are related with the development of bad cholesterol levels through the increase of low-density-lipoprotein (LDL) and decrease of high-density-lipoprotein (HDL, good cholesterol) [22] . According to Gabrial et al. [3] , the consumption of dried Tarhana caused a reduction of serum cholesterol, LDL and triglycerides while the levels of HDL increased, suggesting that Tarhana is a functional and probiotic food with hypolipidemic effect.
4. Conclusion
The color, extractable and non-extractable polyphenols and fatty acids of Tarhana were determined. The variation in ingredients used in the preparation of Tarhana collected from different places of Trakya, Turkey affected the color and phenolic compounds in all the samples. The analysis of fatty acids indicated that Tarhana is a good source of oleic and linoleic acid. Also, linolenic acid (n-3), an essential fatty acid, was detected in all samples. However, it is necessary to analyze the ratio of n-6/n-3 in the samples because all them presented high amount of linoleic acid (n-6), indicating that Tarhana should be consumed with foods rich in n-3 to avoid the development of cancer or cardiovascular diseases. Also it is important to analyze the phenolic compound profile and their antioxidant capacity in Tarhana to find a relationship between them and the fatty acids from lipid peroxidation point of view.
Acknowledgements
Authors would like to thank Kristin Whitney with her help with the analysis of the samples.
NOTES
*Corresponding author.