The Effect of Temperature and Doping Level on the Characteristics of Piezoresistive Pressure Sensor ()

1. Introduction
In this paper, we model the thermal behavior of the piezoresistivity in the pressure sensor based on Silicon monocrystal. Since Smith [1] discovered the piezoresistance effect of silicon and germanium having anisotropic energy band structures. They have been widely used as stress and strain sensors. In the works of [2] -[9] have demonstrated that it is possible to model, the thermal behavior of the piezoresistive pressure sensor by adopting one approach based on the thermal behavior of piezoresistance. In this work, we modeled the thermal behavior of the piezoresistive pressure sensor by adopting a simple approach based on the thermal drift of the piezoresistive coefficients. Our formulation is based on a simple and a good accurate analytical model which allows us to calculate the effect of the temperature and the doping level on sensor characteristics in very short time and very good accuracy. The Lenkkeri model [10] is based on the theory of optical phonon scattering unfortunately, it is valid only for the room temperature. The model that is temperature dependent, easy to compute and, at a time, it fits well the very wide range of doping concentrations is the Kanda model. For these reasons, we adopted the model of Kanda [7] . A comparative study of the model with experimental results [8] [9] demonstrated that Kanda’s model gives good estimate of the piezoresistance coefficient. After this, we will then devote a study of the effect of temperature and doping concentration on the piezoresistivity. Then we calculated the effect of temperature and doping concentration on the output characteristics of the sensor. We also study the geometric influence parameters and doping on these characteristics to optimize the sensor performance.
2. Effect of Temperature and Doping on the Piezoresistity
The basic conclusion of Kanda’s work [7] is that the piezoresistance coefficient obeys to the following relation:
 (1)
(1)
The coefficient  stands for piezocoeficient value for the low-doped silicon, N is a doping level value and T is an absolute temperature value. P(N,T) is a correction function that depends on temperature and doping level and is given by the formula [7] :
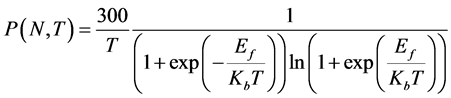 . (2)
. (2)
where Ef represents the Fermi energy in doped silicon and Kb is the Boltzmann’s constant.
2.1. Piezoresistive Factor P(N,T)
The piezoresistance factor P(N,T) and piezoresistance coefficient  based on mathematical calculations for p-type silicon is shows in Figure 1 (Note that the p-type piezoresistors have a larger sensitivity. This makes p-type piezoresistors well-suited for full-bridge applications). Where the term
  is calculated using Equations (1) and (2). They found that the piezoresistances decreased with increasing doping concentration and increasing temperature.
From the experimental results [8] [9] of , it is clear that Kanda’s model gives good estimate of the piezoresistance coefficient and the piezoresistance factor up to doping concentration of 1 × 10¹⁹ atoms/cm3 (Figure 2 and Figure 3).
2.2. Temperature Effects on the Piezoresistance Coefficient π44
Figure 4 shows a piezoresistance coefficient  as a function of temperature and concentration. This coefficient decreased with increasing temperature and increasing doping concentration until the value of 5×1019 cm−3. Beyond this concentration, the coefficient
  is independent of the temperature.
3. Temperature Effect on the Response of Piezoresistive Pressure Sensor
When the membrane is subjected to a uniform pressure P, the values of four resistances will change and a voltage output will be created at the exit of the bridge. Under the effect of temperature, this tension will vary and its law of variation is expressed as follows [4] [11] :
 . (3)
. (3)
where  is the piezoresistive coefficient that depends on temperature and doping level given by Kanda [7] . As shown in Figure 5 the variation in output voltage of a bridge with a supply voltage of Va = 5volt is given for different temperature values. We note that the output voltage of the bridge decreases when temperature increase.
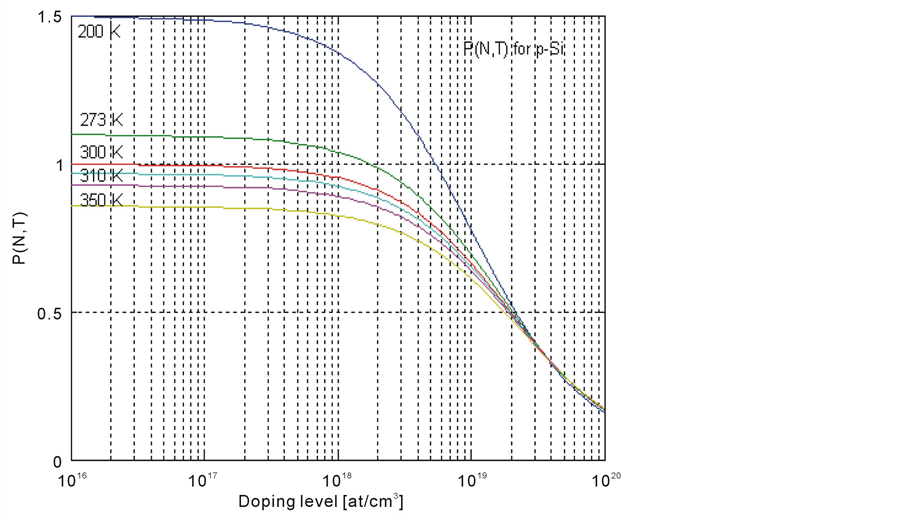
Figure 1. Piezoresistance factor P(N,T) as function of impurity concentration and temprature for p-type silicon.
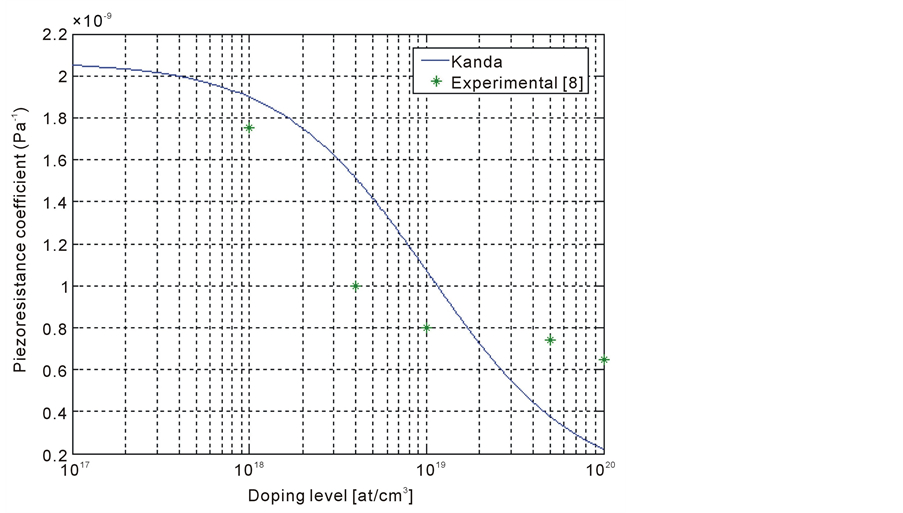
Figure 2. Piezoresistance coefficient π44 against doping concentration at room temprature.
However, the response of the sensor is linear in the temperature range considered. Subsequently we represent the change in output voltage as a function of T for different pressure values. Figure 6 shows sensor output signal versus doping level at different temperatures. It is clear that increasing doping level lowers the output signal. Moreover, for high doping levels (more than 1019 atoms/cm3) stabilize the output signal and make it temperature-independent.

Figure 3. Piezoresistance coefficient π44 against doping concentration for different temprature.

Figure 4. Variation of the piezoresistance coefficient π44(N,T) as function of the T and NA..
4. Doping Concentration Influence on the Sensitivity of the Sensor
Sensitivity is one of the most significant performance criteria of a pressure sensor. A factor that greatly affects the sensitivity of piezoresistive pressure sensors is the doping concentration. This sensitivity is calculated based on the following equation [4] [11] :
 . (4)
. (4)

Figure 5. Variation of the bridge output voltage as fuction of P for tempratures different (Va = 5 volt).
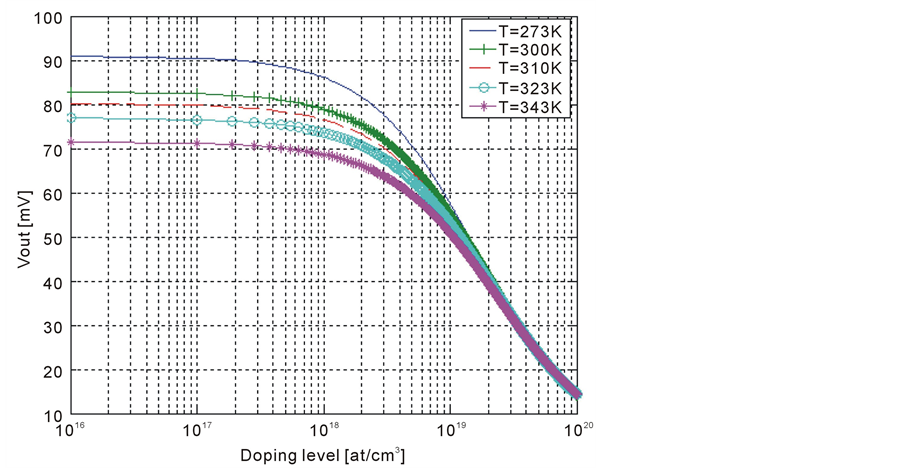
Figure 6. Sensor output vesus doping level at different tempratures.
It is noted that the increase in doping degrades the sensor’s sensitivity to pressure. The thickness of the diaphragm affects also the sensitivity (Figure 7). The sensor is more sensitive when the thickness of the membrane h is going smaller.
For some reasons like strong thermal coefficient of resistance and taking into account that sensitivity drops rapidly for high doping levels, there is no need to design a strain gauges with the impurity concentration higher than a few of 1019 at/cm3.
5. Conclusion
In conclusion, this paper has demonstrated that it is possible to model, with good precision, the thermal behavior

Figure 7. Sensitivity as a function of concentration for different membrane tickness.
of the piezoresistive pressure sensor by adopting a simple approach based on the thermal drift of the piezoresistive coefficients. This approach allows us to see the influence of doping concentration and geometric parameters of the sensor on their characteristics. This property allows us to optimize the sensor performance in function to the application for which it is dedicated.
Acknowledgements
The authors thank Mr. Zeraoulia Hakim for his help in this project, which was totally done at the University Constantine 1, Faculty of Engineering Sciences, Electronics’ Department, MoDERNa Laboratory. We also thank all the staff members of MoDERNa Laboratory, University Constantine 1.