Agricultural Commodity Markets: Reference Point for the Real Value of a Currency ()
1. Introduction
Currency markets are increasingly speculative, and exchange-rate volatility affects many aspects of commercial activity. Richard Cooper [1] in 1999 foresaw that as international financial transactions continue to grow relative to growth in trade and services, financial factors will come to dominate exchange rate determination. Flexible exchange rates, hitherto providing a useful mechanism for absorbing trade shocks and disturbances, would themselves become a source of financial shocks.
Agricultural commodities are by their nature entirely replaceable, and agricultural economists can predict the marginal cost of producing approximately sufficient of each commodity to satisfy the market in the short term. Among such commodities there are numerous close substitutes in each category so that commodities that remain persistently in short supply are gradually replaced in dietary habits. Deaton and Laroque [2] used a statistical model of long-run behaviour of prices of primary commodities produced in poor countries, and concluded that commodity supply in the long run is infinitely elastic; that is, producers can continue to supply a basket of food commodities sufficient to meet any level of demand. This was challenged during the financial crisis of 2008, when speculators turned their attention briefly to food commodity futures markets.
The financial crisis increased food insecurity directly, with food imports constrained for developing countries by balance-of-payments. Ghosh [3] noted two other policy factors affecting global food supply: first, the promotion of biofuels, which led to diversion of crops, notably maize, to fuel production; second, free-market policies allowing shifts to cash crops that rely on purchased inputs. Clapp and Helleiner [4] noted that developments in agricultural derivatives markets attracted little attention among both scholars and policymakers when commodity prices were relatively stable. Food prices on international markets collapsed from their temporary doubling within months, but prices within many developing countries remained high.
The United Nations Food and Agriculture Organisation’s review of the state of food and agriculture, 2013 [5] , commented that:
“changes in activity and dietary patterns are part of a ‘nutrition transition’ in which households and countries may simultaneously face the emerging challenge of overweight, obesity and related non-communicable diseases while continuing to deal with under-nutrition and micronutrient deficiencies”.
There was no general shortage of food—wide scale famine is no longer a threat (except perhaps in war zones). Instead, the concern is that malnutrition impairs life chances, of the young in particular.
The paper is organized as follows. Section 2 reviews conventional approaches to currency valuation. Section 3 presents data from FAO food balance sheets to demonstrate the stability of worldwide annual demand for food in broad categories. We show that the monetary cost of a weighted basket of food commodities is a more stable indicator of real purchasing power than Special Drawing Rights (SDR), a monetary indicator calculated from a weighted basket of freely traded currencies. Section 4 concludes.
2. Exchange Rate Regimes and Currency Valuation
During the decades since the gold standard was temporarily abandoned in 1971, followed by floating exchange rates becoming the norm from 1973, macroeconomists have searched for a consistent method for setting currency exchange rates. During the whole of that period, the OPEC cartel have successfully prevented the operation of a free market in crude oil, whereby the market would have set a crude oil price related to the marginal cost of extracting just sufficient oil to meet world demand. For most other commodities, whether indefinitely replaceable agricultural commodities or resources such as precious metals which are a strictly finite resource, a mostly free market exists for most commodities most of the time. There remains some nostalgia for a standard of value such as formerly provided by gold, when that commodity was of conveniently limited availability.
The calamity of the 2008 banking collapse among western nations gave fresh impetus to pursuit of stability in the global monetary order. Local currency unions for groups of countries with similar economies, such as the Euro zone, were long thought to be a feasible route towards a world currency. Powell and Sturtzenegger [6] considered the costs and benefits not only for a country of joining a monetary union in terms of reduced GDP volatility, but also the third party impacts on other members of the union, and on non members. Dellas and Tavlas [7] traced the long history, from pioneering work by Robert Mundell in 1961, of the concept of an optimal currency area, leading towards a consistent framework in which a country’s characteristics are used to determine its optimal exchange-rate regime, including a welfare function with explicit macroeconomic objectives. Mundell himself [8] , observing that destabilizing capital movements had disturbed exchange rates between areas that within themselves have a high and consistent degree of internal price stability, considered this to be sufficient proof that the markets are not working in a direction and degree that is conducive to economic welfare. His proposed solution was the creation of an international currency that can be used by all countries for international trade purposes.
Other distinguished economists have also observed the benefit that a global currency would bring to the world economic order. Kenneth Rogoff [9] saw that the volatility of exchange rates between the dollar, the euro and the yen surprisingly fails to feed back into domestic goods prices, and therefore pegging a global unit of value to a commodity basket is an attractive concept. Martha Starr [10] used the term “dollarization” for the tendency of countries where the local currency loses credibility to use US dollars alongside it or instead; she presented a theoretical perspective on monetary integration, concluding with the desirable prospect of a stable international monetary domain. Various proposals have emerged for extending the concept of the International Monetary Fund’s Special Drawing Rights (SDRs), a weighted combination of the US dollar, the euro, the yen and the pound sterling, for valuing foreign exchange reserves.
Clements, Lan and Roberts [11] described key aspects of exchange-rate economics for the resources sector, noting the importance of currency volatility and risk management, and identifying some determinants of exchange rates, such as purchasing power parity (PPP). They took account of currency market shocks, arising in various ways. The relative version of long run PPP recognises that baskets of goods vary from country to country, and the arbitrage effect of commodity prices on exchange rates acts over periods of several years. Crucini, Shintani and Tsuruga [12] observed that the persistence of shocks and the volatility of aggregate real exchange rates exceed what economists believe to be consistent with a plausible degree of price rigidity. They found halflife of the median good of about 18 months, considerably lower than the 3 - 5 years half-lives of aggregate real exchange rates.
Exchange rate mechanisms have now been joined by proposals for value-defining baskets of goods as recurring themes in economic literature. Clements and Fry [13] identified countries that are considered to have “commodity currencies” because they are rich in natural resources. In a hint that these resources could provide a standard of value, they found that spillovers from commodities to currencies contributed less than 1% to the volatility of currencies, while spillovers from currencies to commodities contributed between 2% and 5.2% to commodity price volatility.
Cashin, Cespedes and Sahay [14] constructed an index of prices of 44 commodities exported from 58 countries for the period 1980-2002, and found it to be independent of the nominal exchange rate regime. Moreover, the half-life of adjustment of real exchange value to PPP was about eight months, far shorter than typical currency rate adjustment of three to five years (Rogoff, [15] ).
The hiatus in commodity values that followed the 2008 banking collapse was rapidly absorbed, and Baffes and Haniotis [16] confirmed that the “financialisation” of commodities had not permanently affected the longterm trends in prices of food commodities. Otherwise, markets in major agricultural commodities are relatively stable and predictable; Lind [17] noted that cereal markets in particular have large numbers of buyers and sellers of well defined goods, and prices are consequently closely related to underlying fundamentals. Lind found that maize, wheat and rice are cointegrated, and all were subject to a deterministic price decline of approximately 0.1 percent per month in the period between 1930 and 1998, with temporary interludes of high prices in 1942-1946 and 1971-1973. This is consistent with a downward trend of 0.9 percent per year in prices of maize and wheat 1900-1995 reported by Newbold, Rayner and Kellard [18] .
Maize, wheat and rice continue to meet, in similar proportions, a large share of the demand for food calories in the human diet. Statistics from the FAO (Figure 1) show that production of these cereals keeps pace with the increase in world population, corroborating the view of Deaton and Laroque, referred to above, that food supply is infinitely elastic. Figure 1 also shows a significant increase in production of soybeans, soybean meal being the preferred high-protein component of farm animal feed, the increased soybean production thus illustrating the increasing frequency of meat, poultry and fish in the diet in emerging countries.
Supply disruption due to harvest failure in a particular crop or region tends to be smoothed by substitute sources of calories in the human diet, and by drawing on stocks. There is a significant cost in holding large stocks, and there is risk of spoilage if stocks are held for many months, so substitution is the more affordable policy. The predictability of demand, coupled with the rapid response of farm output to price signals, ensures a high degree of stability in the world’s supply chains (Roberts and Schlenker, [19] ). Piesse and Thirtle [20] pointed out that food commodity prices remain stable, or slightly decline in real terms, over long periods. The stability of prices for these goods that are traded in very large volumes is a feature that should be attractive to economists and others for whom economic stability has become a priority.
3. Stability of Food Demand and Supply
The average food energy content in the diets of the world population is one of the parameters included in the Food Balance Sheet prepared by UN FAO for each calendar year, and the values for years 1999-2009 are shown in Table 1, column 2. The values increased steadily during that period, at about 0.3% per year. Dietary reference
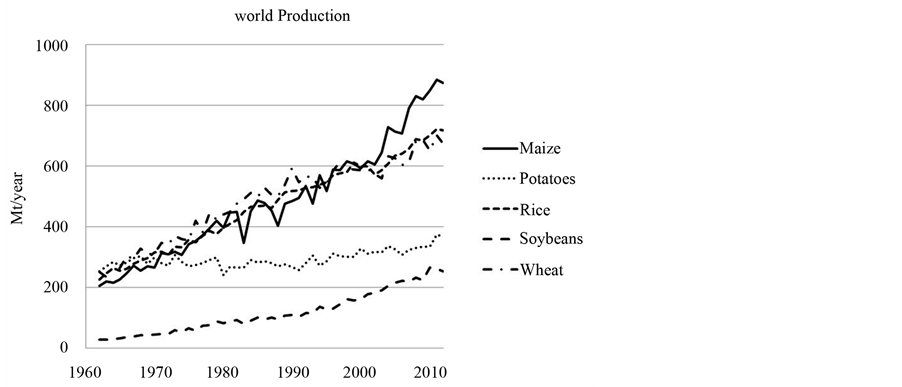
Figure 1. Production of five major food crops, 1964-2011 (source: FAO).

Table 1. Average food consumption of world population.
values for food energy intake vary with body mass and extent of physical activity. According to UK health authorities, boys of 11 - 14 years need about 2220 kcal/day and girls of 11 - 14 years need about 2100 kcal/day; a man age 30 - 60 weighing 80 kg needs between 1800 and 4000 kcal/day, depending on physical activity (UK Dept of Health [21] ), so the FAO values for food energy intake are consistent with slow improvement in food sufficiency.
The Food Balance Sheets also provide indication of the proportions of protein and lipids (oils and fats) in food consumed, and whether the sources are animal or vegetable products. Both protein and fat intakes increased steadily over the period 1999-2009, and more rapidly than energy intake: protein intake increased at about 0.45% per year, mainly from animal sources, and provided an improvement in nutrition, but fat intake increased by about 1% per year, mainly from vegetable oils, and was associated with the increasing problem of obesity worldwide.
The inflation-adjusted cost of the main food commodities tends to decrease over time, as technology advances. The prices of maize and wheat 1970-1990 are shown in Figure 2; the oil price shock of 1973 caused a jump in both prices which gradually declined to below the price in 1970.
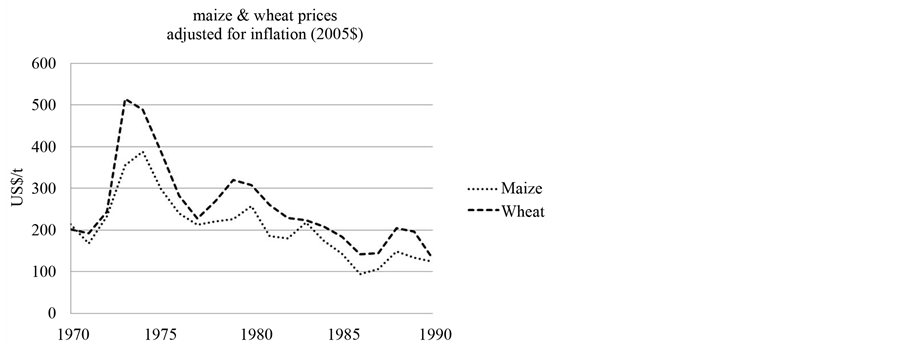
Figure 2. Real prices of maize and wheat crops, 1970-1990 (source: FAO).
As part of research described earlier (McFarlane, [22] ) we have calculated the cost per head per day of a basket of food commodities made up of maize (CME), wheat (FT), rice (CME), potatoes (Potato Weekly), orange juice (FT), soyabeans (FT), soyabean oil (FT), palm oil (FT), refined sugar (FT), rapeseed (FT), cow milk (USDA), hen eggs (USDA), herring (Sildelaget Norway), live cattle (CME), lean hogs (CME) and chicken meat (USDA), sufficient for intake of 2800 kcal/day. This basket is approximately indicative of cost of food worldwide, and is weighted in proportion to actual consumption of each of those commodities. It is calculated in monthly steps for the period January 1999 to December 2013 (Figure 3). The results are consistent with the “dollar-a-day” concept of cost of subsistence (Ravallion, [23] ).
The data illustrated in Figure 3 is arrived at in a sequence of calculations performed on monthly average price data, using annual data for world consumption of the representative basket of food commodities (Source: FAO Food Balanace Sheets). The sequence performed for the month of December 2011 is shown in Table 2.
Column (a) is the world consumption of the 14 most consumed commodity categories, chosen to represent a sufficient range of foods from which to select a balanced diet. Column (b) shows the likely yield after preparation losses, leading to column (c) representing food consumed. Column (d) is the food energy value of that food category from standard tables, which leads to column (e) with the total food calories consumed worldwide in 2011. A diet sufficient for 2800 food calories per day from this set of foods in the proportions in which they are consumed worldwide would provide calories distributed between foods as shown in column (f). Dividing column (f) by the associated food energy values in column (d) provides the weight in kg required of food in each category for subsistence from this representative diet (column (g)). Note that up to this point all values are in SI units, and the only assumptions are in the yields shown in column (b). The calculation can be made more rigorous by inserting yield data (where known) and by extending the list of food items to include foods less commonly consumed. Column (h) is the price for that month (December 2011 in the example shown) based on the price reported for that food in markets indicated above, thus enabling estimate of the subsistence cost per day as the total at the bottom of column (i).
Although there are steep changes and strong volatility in the subsistence cost of food, calculated in monthly time steps, depicted in Figure 3, the variability is largely a currency phenomenon, associated with spillover from financial markets into speculation in futures markets for food commodities; the real cost of food production, represented by labour and other farm business inputs such as fertilisers and irrigation, changes only gradually. This adds weight to the publications reviewed above that advocate some form of commodity-related currency valuation.
4. Conclusions
The very low level of volatility in the Food Balance Sheet data from year to year is in marked contrast to volatility of monetary exchange rates. The fluctuations in the inflation-adjusted prices of maize and wheat in Figure 2 are more related to currency problems than to arable crop cultivation practice, which remains consistent from year to year.
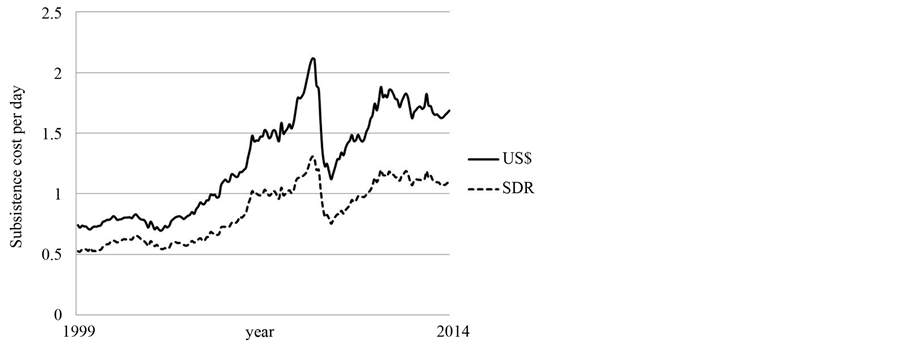
Figure 3. Cost of basket of food goods sufficient to provide 2800 kcal/day.
Table 2. Method of calculation of cost of subsistence for month of December 2011.
Food energy values from Holland et al., [24] .
Similarly, the cost of world food supply represented by the variables in Figure 3 reflects the economic disturbances during 1999-2013; patterns of actual production and consumption of food were varying rather gradually during that period, as shown in Table 1.
In the continuing absence of a standard of monetary value, it may be useful to define a standard of value in terms of physical units, and one way of doing this without making arbitrary assumptions is to take the cost of provision of a basket of food, weighted in proportion to actual worldwide consumption of food goods year by year, and scaled to the recommended levels of food energy intake, as a reference standard.
Acknowledgements
The author is grateful to the University of Reading for facilities to conduct this research.