Analyses Using SSR and DArT Molecular Markers Reveal that Ethiopian Accessions of White Lupin (Lupinus albus L.) Represent a Unique Genepool ()
1. Introduction
Lupinus albus L. (white or broad-leaf lupin, 2n = 50), a member of the Leguminosae, is an annual grain-legume crop grown in Australia and other parts of the world. In Australia, L. albus is grown as an important, high-protein rotational grain crop and is useful in controlling cereal diseases in a mixed-farming crop rotation, and provides alternative herbicide options for weed control. L. albus fixes atmospheric nitrogen through its symbiosis with rhizobia and it is an efficient scavenger of phosphorus due to the presence of proteoid roots which secrete organic acids, increase phosphorus solubility and make it more accessible for plant uptake [1] -[5] . Over the past 3000 years, white lupins have been utilised as feed for livestock (cattle, dairy cows, sheep, horses, and poultry), aquaculture, and food for human consumption [6] -[8] .
Previous work has indicated that the Balkans region in the Mediterranean basin is the likely centre of origin of the L. albus species [9] . In these locations the primitive brown seed colour (graecus) is found, along with genotypes which have shattering pods, hard-seeds, plus high-alkaloid content in the seeds and foliage to deter herbivores [10] . These characteristics have all been replaced with important alternatives (low-alkaloid, white soft seeds, and non-shattering pods) during domestication and the modern breeding process [11] . White lupin and other Lupinus species have been fully domesticated only recently when compared with most crops [12] .
A number of ex situ germplasm collections are in existence containing genetic resources for L. albus. The world’s largest lupin germplasm collection is located at Perth, Western Australia, despite the genus Lupinus being totally absent from the wild in that continent apart from recently naturalised introductions. Like many species exploited by Australian agriculture, the genetic material is sourced 100% from elsewhere, although significant progress in white lupin breeding has been made within Australia for yield, grain quality and disease resistance [6] [13] [14] . Lupin germplasm collections can be exploited to identify novel genotypes which may contain novel genes for traits of commercial value (e.g., disease resistance), and to broaden the genetic base of lupin breeding programs. Genotypes from Ethiopia are the source of important genes for worldwide L. albus breeding, particularly resistance to the wide-spread and devastating fungal disease anthracnose [15] [16] .
Genetic diversity in lupins has been characterized using morphological and agronomical attributes [17] , and isozymes [18] . The assessment of genetic diversity on the basis of morphological traits is not very reliable, as it may be influenced by the environment, and the list of traits with known inheritance is often limited. PCR based markers have the distinct advantages of being independent of the external environment, abundant, and relatively inexpensive and quick to assay. Molecular markers, including randomly amplified polymorphic DNAs (RAPDs), inter-simple sequence repeats (ISSRs), amplified fragment length polymorphisms (AFLPs), and randomly amplified microsatellite polymorphism (RAMP) have been used to assess genetic diversity in white lupin and other species of Lupinus [19] -[21] .
Croxford et al. [41] developed STS markers in white lupin and used them to construct a genetic linkage map. Phan et al. [22] located 105 gene-based PCR markers in a RIL mapping population of white lupin. These markers were based on Intron Targeted Amplified Polymorphisms (ITAP), EST-derived SSR motifs, and Medicago truncatulata cross-specific amplicons [23] . In this study, we have referred to them as PCR-based “genic” markers. The majority of these markers were locus-specific and evenly distributed on the chromosomes. Recently, Diversity Arrays Technology markers (DArT™) [24] were developed in white lupin [25] . DArT™ markers are microarray based and are amenable to high-throughput genotyping and are cost-effective per data point, making them suitable for screening large number of individuals. These markers have been employed for genetic fingerprinting and diversity assessment, molecular mapping of different genomes, and development of marker-trait associations in several crops including: wheat, barley, cassava, canola, rice, and white lupin [24] [26] -[31] . However, the usefulness of these markers in the assessment of L. albus genetic diversity has not been determined.
The availability of a suite of markers based upon structural and functional genes [22] plus a DArT lupin chip, provided an opportunity to assess the genetic diversity and population structure in the germplasm available to the white lupin breeding program at Wagga Wagga, and the opportunity to compare the results from the two marker systems.
2. Materials and Methods
2.1. Plant Material and DNA Extraction
Seeds of 94 accessions of white lupin (Table 1) representing local and foreign varieties, landraces, and advanced breeding lines were provided by the lupin breeding program, located at the New South Wales Department of Primary Industries, Wagga Wagga, Australia. Non-breeding accessions were originally provided by the

Table 1. Accessions used for assessment of genetic diversity in white lupin (Lupinus albus L.) using molecular markers.
*ISO 3-letter country codes. $An appended number after a hyphen in the accession name indicates a single plant selection from the original cultivar or breeding line. #Eight genotypes used in Phase 1 of the analysis.
Australian Lupin Germplasm collection, DAFWA, Perth, Western Australia. They had been imported through quarantine from other collections and following field collection trips [9] .
Seeds were grown either in 250 mm diameter pots in an evaporatively-cooled glasshouse using sandy loam potting mix, or in row-plots in an insect-proof screen house with an irrigated and fertile chromic luvisol soil [32] of pH 5.0, both located at Wagga Wagga Agricultural Institute (35˚03'07"S; 147˚21'06"E). Group “G” rhizobia were added where required to facilitate good nodulation. One leaflet was taken from each of 10 individual plants per genotype. The leaflets were bulked for DNA isolation. The bulk sampling procedure [20] was followed as an efficient way to determine genetic diversity both between and within germplasm accessions. Total genomic DNA was isolated from the pooled leaflet tissue as described by Raman et al. [33] . Molecular marker analysis was performed as described below.
2.2. PCR-Based Genic Marker Analysis
2.2.1. Phase 1
Initially a subset of eight accessions (Table 1) thought to be potentially diverse was tested for polymorphisms: Kiev-mutant, Rosetta, Lucky-1, P27174, P25758, P27593, XA100 and Start. These genotypes were important because they included the parents of the mapping population used to produce the L. albus linkage maps [22] [25] , to locate the loci for low seed-alkaloid content (pauper) [34] , and to develop PCR markers for resistance to anthracnose [35] and phomopsis [31] . In addition, they included parents of other mapping populations made for use in research to identify markers for loci controlling Pleiochaeta Root Rot resistance, and low seed alkaloid content locus exiguus [6] .
Sixty-three published primer sequences of Lupinus angustifolius and L. albus [22] [23] were tested across the eight L. albus genotypes. A total of 30 combinations of primer and restriction enzyme were employed to generate 70 resolvable polymorphic fragments. The number of fragments varied from 1 to 8 per marker (mean = 2.23). Six random individuals per genotype were visually examined for their phenotypic uniformity. All genotypes were uniform, which was not surprising given that these genotypes had been carefully grown to prevent insectmediated cross pollination for several generations at Wagga Wagga.
2.2.2. Phase 2
For the screening of the complete 94 accession/genotype set (Table 1), 20 polymorphic markers that were easy to score were employed for genetic diversity analysis (Table 2). PCR analyses were performed following the recommended PCR thermocycler programs [22] [23] . The 5’ ends of the primers generating amplicons below 400 base pairs in size were tailed with the M13 sequence as described previously [36] . SSR genotyping was performed using tailed and labelled M13 primers as described by Raman et al. [33] . Amplified DNA fragments were separated and visualised on a CEQ8000 DNA sequencer (Beckman Coulter Inc.) and their sizes measured using fragment analysis software from the manufacturer [33] . Primers generating amplicons over 400 bp were used as standard oligonucleotides and PCR products were separated by electrophoresis on either 2.5% (w/v) agarose or 8% (w/v) polyacrylamide gels. Restriction enzyme digestion of PCR products (CAPS analyses) were performed as described previously [22] [23] . The digested products were resolved on 2% (w/v) agarose gels. All gels were stained with ethidium bromide and visualized on UV transilluminator.
2.3. DArT Marker Analysis
A multi-species Lupinus DArT chip was employed for analysis of the set of 94 genotypes of Lupinus albus. The chip-based array comprised 15,000 clones derived from the metagenome of 96 diverse genotypes/accessions of the main annual Lupinus crop species: L. angustifolius (genotype/accession number, n = 59), L. albus (n = 7) and L. luteus (n = 5), L. mutabilis (n = 4), L. cosentinii (n = 3), L. atlanticus (n = 4), L. digitatus (n = 1), L. hispanicus (n = 4), L. princei (n = 1), L. pilosus (n = 6) and L. palaestinus (n = 2) (B. Buirchell, pers. comm.). DArT analysis was conducted at DArT Pty Ltd (Canberra, Australia, URL: www.diversityarrays.com) using the general procedures previously described [37] . Genomic library construction, array development, hybridisation to microarray, image analysis, and data analysis were performed as described in Vipin et al. (2013).
2.4. Data Analysis
The allele data for PCR-based genic markers were converted to a presence (1)-absence (0) matrix for analysis.
Table 2. PCR-based genic markers [23] used for genetic diversity analysis of 94 accessions of white lupin (Lupinus albus L.).
*Markers which involve one or more restriction enzyme digests of the PCR products are CAPS markers [45] . $L. albus genetic map linkage group as defined by [22] .
Binary data resulting from the DArT marker analysis was also analysed.
2.5. Tree Construction and Principal Coordinate Analysis
Dissimilarity matrices were calculated for single data based on the presence/absence of alleles using the Jaccard coefficient as implemented in DARwin 5 software (URL: http://darwin.cirad.fr/Home.php) [38] . Cluster analysis was performed using the unweighted neighbour-joining method [39] with 1,000 bootstraps. A cophenetic correlation was calculated to compare the dissimilarities and the distances between accessions as represented in the dendrograms from the PCR-based genic and DArT sources. Principal Coordinate (PCO) analysis was conducted to visualise the genetic relationships among the accessions as described by Anderson et al. [40] . The first two dimensions representing the largest components of the total variance were used to generate a diagnostic scatter plot.
3. Results
Forty eight per cent (30/63) of the PCR-based markers were found to be polymorphic among the initial set of eight accessions (Table 1). For the 20 easy-to-score markers that were subsequently employed to estimate genetic diversity among the 94 accessions of white lupin, a total of 50 polymorphic fragments were identified. The most informative marker locus (an SSR) was PT1, at which nine alleles were identified among the 94 accessions (Table 2). 295 of the DArT markers were polymorphic with a call rate of more than 80% (quality threshold).
Neighbour-joining trees constructed using 21 PCR-based and 295 DArT markers (Figure 1 and Figure 2) showed a high level of genetic diversity in the germplasm collection. High cophenetic coefficients of 0.91 and 0.97 for PCR based and DArT markers, respectively, indicated that both types of markers gave a good correlation between genetic distance matrices and tree structures.
The dendrogram constructed from the PCR-based marker data identified only two large clades plus one smaller one (Figure 1). Groupings of genotypes in these clades, based on their geographic origin, were not obvious. However, the dendrogram resulting from the DArT data showed a clear grouping of accessions into four

Figure 1. Unweighted neighbour-joining tree based on dissimilarities between 94 white lupin accessions using 20 PCRbased markers amplifying 50 polymorphic fragments. Scale (0 - 0.1) indicates genetic distance. Bootstrap values are given on the tree, showing for each node its occurrence frequency (between 0% and 100%) in all the bootstrapped trees (n = 1000).
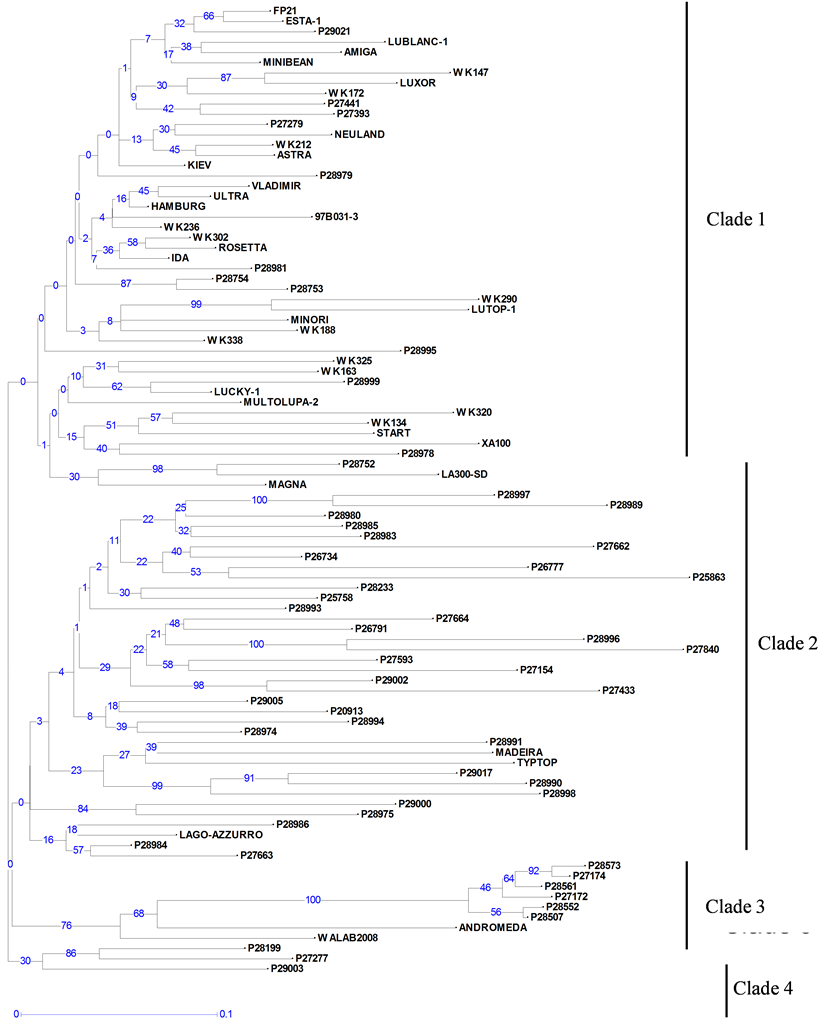
Figure 2. Unweighted neighbour-joining tree based on dissimilarities between 94 white lupin accessions using 295 DArT markers. Scale (0 - 0.1) indicates genetic distance. Bootstrap values are given on the tree, showing for each node its occurrence frequency (between 0% and 100%) in all the bootstrapped trees (n = 1000).
clades (Figure 2). Most of the landraces (Table 1) were grouped in Clade 2, and the breeding lines and varieties into Clade 1, with few exceptions. Six of the seven Ethiopian landraces (P27172, P27174, P28507, P28552, P28561 and P28573) formed a separate, distinct group in Clade 3, along with two progeny from crosses with Ethiopian lines (Andromeda and WALAB2008). Clade 4 contained only three accessions of which two are landraces from the Mediterranean region.
The first two PCO dimensions explained 30% of the total observed variation. A 2-D plot of dimension 1 × dimension 2 confirmed that most of the Ethiopian accessions are highly diverse and clustered together (Figure 3). The plot also showed that the Australian lupin varieties and breeding lines are quite genetically similar, clustered well away from the Ethiopian material, and away from most of the landraces of European origin.
Two Western Australia-bred genotypes, cv. Andromeda and breeding line WALAB2008, fall midway between their anthracnose-resistant Ethiopian parent (P27174) and their Ukrainian parent (cv. Kiev-mutant) (Figure 3). It remains to be seen whether such diverse new cultivars have the necessary adaptation to produce high-yield under local conditions in Australia or whether further breeding is required.
Several landraces lay on the periphery of the main PCO groupings, namely, P28997 and P27154 (ex-Spain), P28989 (ex-Greece), P27840 (ex-Syria); along with a breeding line from UK (P25863) (Figure 3). These genotypes are potentially very useful as sources of new genes for breeding. The Chilean determinant cultivar Typtop was also a relative outlier in the distribution.
4. Discussion
The application of DArT and PCR-based markers for the assessment of genetic diversity in white lupin has not been previously reported. Recently, a newer DArT chip was developed and utilised by Vipin et al. [25] ; it was assembled primarily from L. albus accessions and showed greater polymorphism but was not available when the
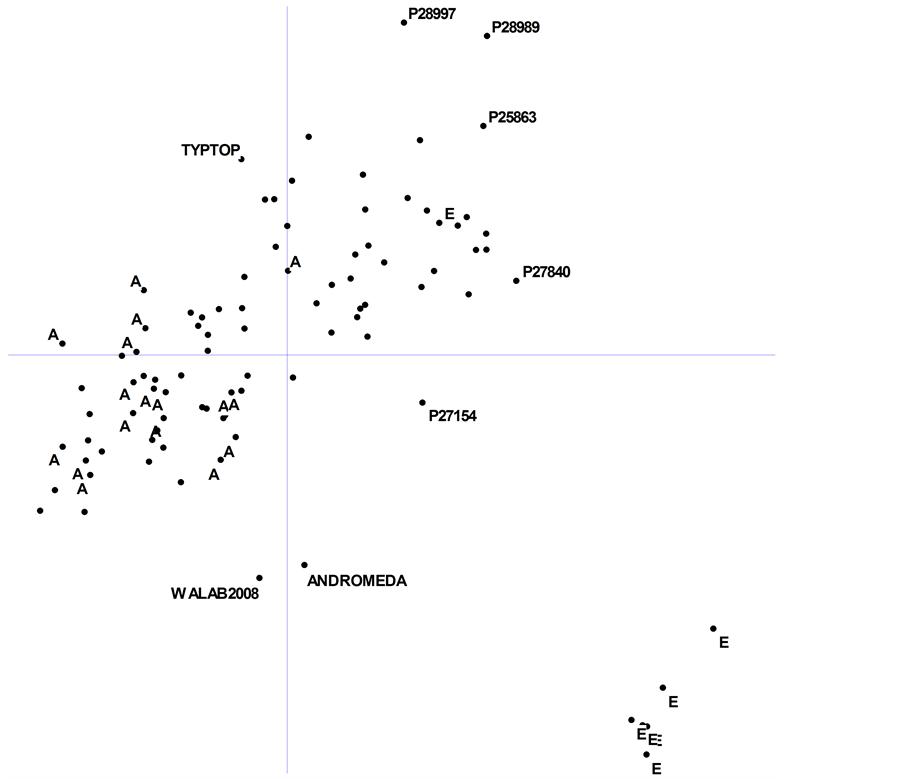
Figure 3. Principal coordinate analysis of 94 accessions of Lupinus albus L. based upon combined data from 315 DArT and PCR-based markers. Accessions labelled as “A” and “E” are breeding lines and cultivars from Australia, and landraces from Ethiopia, respectively (see Table 1). Axis (dimension) 1 and axis 2 explained 17% and 13% of the genetic variation, respectively. Some diverse and unusual accessions are labelled (see text for explanation). Scale: origin to top of Y-axis = 0.25 (tick marks and labels omitted for clarity).
work described here was undertaken. The metagenomic chip of Lupinus species used in this work was a compromise, and the low level of observed useful polymorphism for this diversity set (295/15,000 = 2% of the total clones on the chip) was not surprising since L. albus accessions only contributed 7.3% (7/94) of the metagenome used to construct the array.
It is difficult to anticipate how many markers are sufficient for complete germplasm characterisation within a while lupin germplasm collection. Well-distributed markers per chromosome should be used, as the accuracy of genetic distance depends on the number and distribution of markers on the genome [42] . For the purpose of measuring genetic distance, 20 well-spread markers per chromosome are probably sufficient [43] . In this study, we employed 315 markers across 25 chromosomes—a less-than-ideal number for an assessment of genetic diversity.
The principal advantage of the DArT markers is that they are microarray-based and several hundred markers can be screened in a single experiment. They are therefore cheaper than PCR-based SSR or CAPS markers but more expensive than SNP markers. Currently, SNP markers are recognised as the marker of choice in plant improvement programs as they are highly polymorphic, chromosome specific, and ubiquitous in plant genomes. In some cases, particularly when a SNP is present within a gene controlling a trait of interest, it is directly responsible for an observed mutation.
It has always been a challenge to characterise germplasm precisely; accessions from gene banks and breeding programs may be heterogenous and/or heterozygous, depending on their origin, history, and the breeding system of the species. Our findings suggest that molecular markers, both PCR-based and DArT, are suitable for assessment of genetic diversity in white lupin. These results will allow breeders to increase their efficiency when phenotyping the germplasm for new traits of interest.
Most of the Australian breeding material examined in this work clusters with the European cultivars and breeding lines, no doubt reflecting their pedigree and breeding history. It may also indicate that certain linkage blocks have been retained as necessary for adaptation to modern farming systems. In contrast, the Ethiopian landraces examined here were tightly clustered (except for P28233 in clade 2) and they were very distinct from all other genotypes. P28233 may have been misclassified in the genebank collection. Such a distinct separation is evidence that the Ethiopian material has evolved in isolation from the L. albus populations of the Mediterranean basin. The genetic differences could be due to ancient founder effects and subsequent divergence from original genotypes sourced from the purported Balkan centre of origin [9] . This is perhaps the most likely scenario since the Ethiopian landraces are not wild types, that is, they possess most of the domestication characteristics, and none have brown graecus seeds. However, Luckett et al. [44] showed that Ethiopian and Greek landraces had different genetic control of white seed colour, and this could have been selected in separate gene pools in the two regions.
The 94 accessions used in this study are not an exhaustive list of the available L. albus germplasm world-wide. Now that an improved DArT array is available [25] , there would be merit in extending this analysis to all accessions held in collections world-wide. Nevertheless, we have identified significant genetic diversity among the landraces, varieties and breeding lines—genetic variability that is ready to be explored by breeders and used to donate new or rare alleles to their breeding gene pools.
Acknowledgements
The authors thank the NSW Department of Primary Industries, the Grains Research and Development Corporation of Australia, and the Australian Research Council for their financial support. We thank Drs Bevan Buirchell & Andrzej Kilian for kindly providing details of the Lupinus DArT chip.
NOTES
*Corresponding author.