Anti-Hyperglycemic Effect of Single Administered Gardeniae Fructus in Streptozotocin-Induced Diabetic Mice by Improving Insulin Resistance and Enhancing Glucose Uptake in Skeletal Muscle ()
1. Introduction
It has been reported by the World Health Organization that there will be 366 million cases of diabetes by the year 2030. Diabetes mellitus is a problem to perplex the world [1]. Diabetes mellitus is a group of metabolic diseases marked by hyperglycemia, which arises from abnormal insulin secretion and/or peripheral insulin resistance [2]. Insulin plays an important role in maintaining whole body glucose homeostasis by stimulating the transport of glucose into peripheral tissues, such as skeletal and cardiac muscles and white and brown adipose tissues [3]. Insulin resistance is defined as a reduced responsiveness of insulin on a target cell or a whole organ [4], which results in reducing insulin-mediated glucose utilization in peripheral tissues, accompanying glucose intolerance and insulin intolerance [5]. Insulin resistance is not only the major pathophysiological condition of type 2 diabetes (non-insulin-dependent diabetes mellitus) [6], but also present in type 1 diabetes (insulin-dependent diabetes mellitus) [7].
Impaired glucose uptake in skeletal muscle is present in insulin resistance diabetes [8]. The rate-limiting step in muscle glucose uptake is the transmembrane transport of glucose mediated by glucose transporter 4(GLUT4). GLUT4, a protein stored in intracellular vesicles, plays a pivotal role in regulating insulin-stimulated glucose transport into skeletal muscle and adipose tissue [9,10]. The conditional depletion of GLUT4 caused insulin resistance and chronic hyperglycemia [11]. In a diabetic state, reduced expression of GLUT4 causes impairment of insulin signaling pathway in skeletal muscle and stimulates glucose production in the liver [12]. It has been reported that GLUT4 can be activated by phosphatidylinositol 3-kinase (PI-3)/Akt insulin signaling pathway in peripheral tissues. Concretely, under the stimulation of insulin, glucose uptake is induced by phosphorylation and activation of Akt which lead the translocation of GLUT4 from intracellular storage particles to the cellular surface for glucose uptake [13]. Skeletal muscle accounts for nearly 40% of body mass and is the most important tissue for glucose utilization. Skeletal muscle plays an important role in regulating insulin sensitivity [14]. Hence glucose uptake in skeletal muscle is an important target for anti-hyperglycemia.
Streptozotocin (STZ) has been commonly used to induce models of Type 1 and Type 2 diabetes. According to the dosages used, STZ is producing mild to severe types of diabetes by either single intravenous or intraperitoneal injection [15]. STZ-diabetic mice have the features such as polydipsia, polyphagia, polyuria, dyslipidemia and hyperglycemia [4,16,17]. Insulin resistance is also observed in STZ-induced diabetic rats [18].
In the recent year, plant-based medicines have gained advance of the treatment of metabolic diseases such as diabetes [19]. Gardeniae Fructus (GF) is a traditional Chinese medicine, which has alleviating effect on cytotoxicity [20], antioxidant activity [21] and protective action on pancreatitis [22]. We have also reported [23,24] that GF composed in Bofutsushosan alleviates the abnormal glucose/lipid metabolism in STZ-diabetic mice. In the present study, we sought to investigate the mechanisms of single administered GF for anti-hyperglycemic action in STZ-diabetic mice. The effects of GF on glucose tolerance, insulin tolerance, glucose uptake in soleus muscle, the expression of GLUT4 in the plasma membrane and P-Akt in cytosolic fraction of soleus muscle will be unveiled in STZ-diabetic mice.
2. Materials and Methods
2.1. Preparation of STZ-Diabetic Mice
Fed male mice (ddY strain; 4 weeks of age; 16 - 20 g; Japan SLC, Shizuoka, Japan) were injected with a single dose (150 mg/kg) of STZ (Sigma, St. Louis, MO, USA) in saline into the tail vein. STZ-diabetic mice (7 weeks of age; blood glucose over 450 mg/dl) were used for experiments at 3 weeks after the injection of STZ. Agematched normal male mice (ddY strain; 7 weeks of age) were used in the control experiments. These mice were given by CRF-1 (Oriental Yeast Co., Tokyo, Japan) and water ad libitum and kept at 25˚C - 26˚C with lights on from 7 a.m. to 7 p.m. The Ethics Review Committee for Animal Experimentation of Hokuriku University approved the experimental protocol.
2.2. Preparation and Administration of Drug
GF was purchased from Tsumura Co. (Tokyo) and extracted in 10 volumes of distilled water with an automatic extractor “Torobi” (Tochimoto, Osaka, Japan) for 1 hour. A water extract of GF was filtered through a mesh (No. 42, Sanpo, Tokyo), lyophilized with a freeze-drier (DF- 03G, ULVAC, Tokyo), and stored at 4˚C [25,26]. A dosage of 300 mg/kg GF solution or H2O were singly administered intraperitoneally (0.1 ml/10g body weight) into 3 hour-fasted STZ-diabetic mice. Because GF significantly lowered blood glucose levels in STZ-diabetic mice at the dosage of 300 mg/kg in the previous study [23,24], we used only 300 mg/kg GF in this study to research the mechanism of GF for anti-hyperglycemic action.
2.3. Measurement of Glucose, Insulin, Triglyceride and Cholesterol Levels in Serum
Blood was collected from the neck vein plexus of STZ-diabetic mice before and 6 hours after single administration of GF or H2O. Blood samples were centrifuged at 8000 rpm at 25˚C for 5 min. Glucose level of the supernatant was measured by the glucose oxidase method with a serum glucose monitor set (MEDISAFE MINI, Terumo, Tokyo). Serum insulin level was measured with a mouse ELISA kit for insulin (Morinaga, Yokohama, Japan). Serum triglyceride and cholesterol levels were measured with ELISA kits for triglyceride and cholesterol (Wako, Osaka), respectively.
2.4. Determination of Glucose Tolerance and Insulin Tolerance
Six hours after treated with GF or H2O, glucose tolerance in STZ-diabetic mice was assessed by intraperitoneal (ip) glucose tolerance test (IPGTT). After a bolus of glucose (1.5 g/kg, 30% solution, ip) was injected, blood was collected sequentially from the neck vein at time intervals of 0, 30, 60, 90 and 120 min and tested serum glucose and insulin levels.
To evaluate insulin tolerance, intraperitoneal insulin tolerance test (IPITT) was performed. A bolus of insulin (0.65 U/kg, ip) was injected and blood was taken sequentially from the neck vein at time intervals of 0, 30, 60, 90 and 120 min and tested serum glucose level.
2.5. Determination of Insulin Resistance by Homeostasis Model Assessment of Insulin Resistance (HOMA-IR) Analysis
HOMA-IR analysis was used to assess insulin resistance in STZ-diabetic mice. After over-night fasting, values for HOMA-IR were calculated from the values of fasting serum glucose (mg/dl) and fasting serum insulin (μU/ml) by using the following formula: HOMA-IR = fasting glucose value (mg/dl) × fasting insulin value (μU/ml)/405 [27].
2.6. Assay for 2-Deoxy-D-Glucose Uptake
Six hours after treated with GF or H2O, soleus muscles isolated from STZ-diabetic mice or normal mice were dissected out respectively, and incubated for 30 min at 35˚C in 2 ml of Krebs-Henseleit buffer (KHB) containing 0.1% bovine serum albumin (BSA), 32 mM mannitol, and 8 mM glucose in the presence or absence of insulin (10 nmol/ml) under the condition of 95% O2 /5% CO2. All muscles were transferred to 2 ml of KHB containing 0.1% BSA and 40 mM mannitol in the presence or absence of insulin (10 nmol/ml) for 10 min at 29˚C to wash out glucose. Muscles were then incubated for 10 min in 2 ml KHB containing 1 mM 2-[3H]-Deoxy-D-glucose (2- DG) (2.25 μCi/mmol), 39 mM [14C] mannitol (8.5 μCi/mmol) and 1% BSA at 29˚C under 95% O2 /5% CO2. Insulin was added to KHB when insulin was present in the previous incubations. The muscles were processed by lysing in 0.5 N NaOH for 1 hour at 60˚C with shaking. Muscle extracts (100 μl) were placed in scintillation vials containing 4 ml of scintillation liquid (Triton X-100: methylbenzene, 1:2) and counted in liquid scintillation counter with channels present for simultaneous [3H] and [14C] counting. The amount of each isotope present in the samples was determined and used to calculate the intracellular concentration of 2-DG [28].
2.7. Western Blot Analysis
The plasma membrane and cytosolic fractions were prepared from soleus muscles as described previously [29]. Briefly, 6 hours after treated with GF or H2O, soleus muscles of STZ-diabetic mice were dissected out and chopped into pieces as small as possible with scissors. Muscles (100 mg) was homogenized with 3 volumes of buffer A (10 mM Tris at pH 7.8, 10 mM KCl, 1.5 mM MgCl2, 1 mM phenylmethylsulfonyl fluoride , 0.5 mM dithiothreitol (DTT), 5 μg/ml aprotinin and 10 μg/ml leupeptin) containing 0.1% Nonidet P-40, and passed through a 22-gauge needle three times. The homogenate was centrifuged at 1000 × g for 10 min at 4˚C. The pellet was resuspended in buffer A and centrifuged at 1000 × g for another 10 min at 4˚C. Plasma membrane fraction was obtained by resuspending the resulting pellet in buffer A containing 1.0% (v/v) Nonidet P-40, and centrifuged at 10,000 × g for 20 min at 4˚C.
To obtain the cytosolic fraction, soleus muscles were homogenized in buffer A and lysed with buffer B(10 mM Tris at pH 8, 150 mM NaCl, 1.0% (v/v) Nonidet P-40, 0.5% (w/v) sodium deoxycholate, 0.1% (w/v) sodium dodecyl sulfate (SDS), 0.5 mM DTT, 1 mM phenylmethylsulfonylfluoride, 5 μg/ml aprotinin and 10 μg/ml leupeptin), and centrifuged at 16,000 × g for 20 min at 4˚C. The supernatant was referred as the cytosolic fraction.
After the proteins of the plasma membrane and the cytosolic fractions of soleus muscle had been respectively separated by 8% SDS-polyacrylamide gel electrophoresis (SDS-PAGE), they were transferred to PDVF membranes and blocked for 1 hour with 1% (w/v) nonfat dry milk in TBST (10 mM Tris at pH 7.6, 150 mM NaCl and 0.1% Tween-20). The plasma membrane fraction was incubated with the primary antibody of GLUT4 (G4048, SIGMA-ALDRICH Co., Tokyo), and the cytosolic fraction was incubated with the primary antibodies of Akt (9272, Cell Signaling Technology Co., Tokyo) or phospho-Akt (Ser 473) (9271, Cell Signaling Technology Co., Tokyo) for over night at 4˚C. The membranes were further incubated respectively with secondary antibody (7074s, Cell Signaling Technology Co., Tokyo) for 1 hour at room temperature. The antibody-bound proteins were detected by fluorescence assay with an ECF Western Blotting Kit (GE Healthcare; Little Chalfont, Buckinghamshire, UK), and bands were analyzed using a Typhoon 9410 imaging analyzer (GE Healthcare; Little Chalfont, Buckinghamshire, UK).
2.8. Statistical Analyses
All values were expressed as means ± S.E.M. Differences between group data were evaluated by unpaired ttest at P = 0.05 or 0.01. A value of P < 0.05 was considered statistically significant.
3. Results
3.1. Characteristics of STZ-Diabetic Mice
To confirm the characteristics of our STZ-diabetic model, body weight, levels of serum glucose, insulin, triglyceride and cholesterol, and HOMA-IR index were compared with those in normal mice (Table 1). Mice injected with a single dose (150 mg/kg) of STZ displayed significantly increased serum glucose level (915.4 ± 55.0 mg/dl) when compared to normal mice. The insulin level of STZ-diabetic mice was significant lower (299.0 ± 31.6

Table 1. The different characteristics between normal mice and STZ-diabetic mice.
pg/ml) than that of normal mice. STZ-diabetic mice also showed significantly high levels of triglyceride (187.3 ± 10.3 mg/dl) and cholesterol (183.2 ± 4.8 mg/dl) compared to normal mice. Using serum glucose and insulin concentrations in mice fasted over night, HOMA-IR was calculated. HOMA-IR of STZ-diabetic mice was 11.3 time-greater increased compared to that of normal mice. STZ-diabetic mice showed increased levels of serum glucose, triglyceride, cholesterol and HOMA-IR, and decreased level of serum insulin.
3.2. Effect of GF on Glucose Tolerance
Effect of GF on glucose tolerance was examined in STZdiabetic mice. After glucose loading, the levels of serum glucose (Figure 1(a)) and serum insulin (Figure 1(b)) were measured in normal mice, GF-treated and H2Otreated STZ-diabetic mice. There was a significant increased in serum glucose level from 773.6 ± 94.1 to 1217.6 ± 119.1 mg/dl at 30 min after glucose loading, and continually increased to 1296.4 ± 86.5 mg/dl at 60 min. High glucose level reached a plateau and was not changed from 60 min to 120 min. Glucose level in GFtreated STZ-diabetic mice increased from 498.0 ± 48.7 to 882.5 ± 149.2 mg/dl at 30 min after glucose loading, and then quickly reduced in a time-dependent manner during 30 min to 120 min. At 120 min after glucose loading, the glucose level lowered significantly from 882.5 ± 149.2 to 631.3 ± 90.8 mg/dl in GF-treated STZ-diabetic mice. This pattern of glucose-lowering action in GF-treated STZ-diabetic mice was similar to that of normal mice (Figure 1(a)). GF-treated STZ-diabetic mice showed better control of glucose than H2O-treated control after glucose loading.
After glucose loading, the level of insulin in GFtreated STZ-diabetic mice was significantly increased at 30 min (Figure 1(b)). Although increased level of insulin in GF-treated diabetic mice was smaller than that in normal mice, this increasing pattern of insulin in GFtreated diabetic mice was similar to that in normal mice.
 (a)
(a)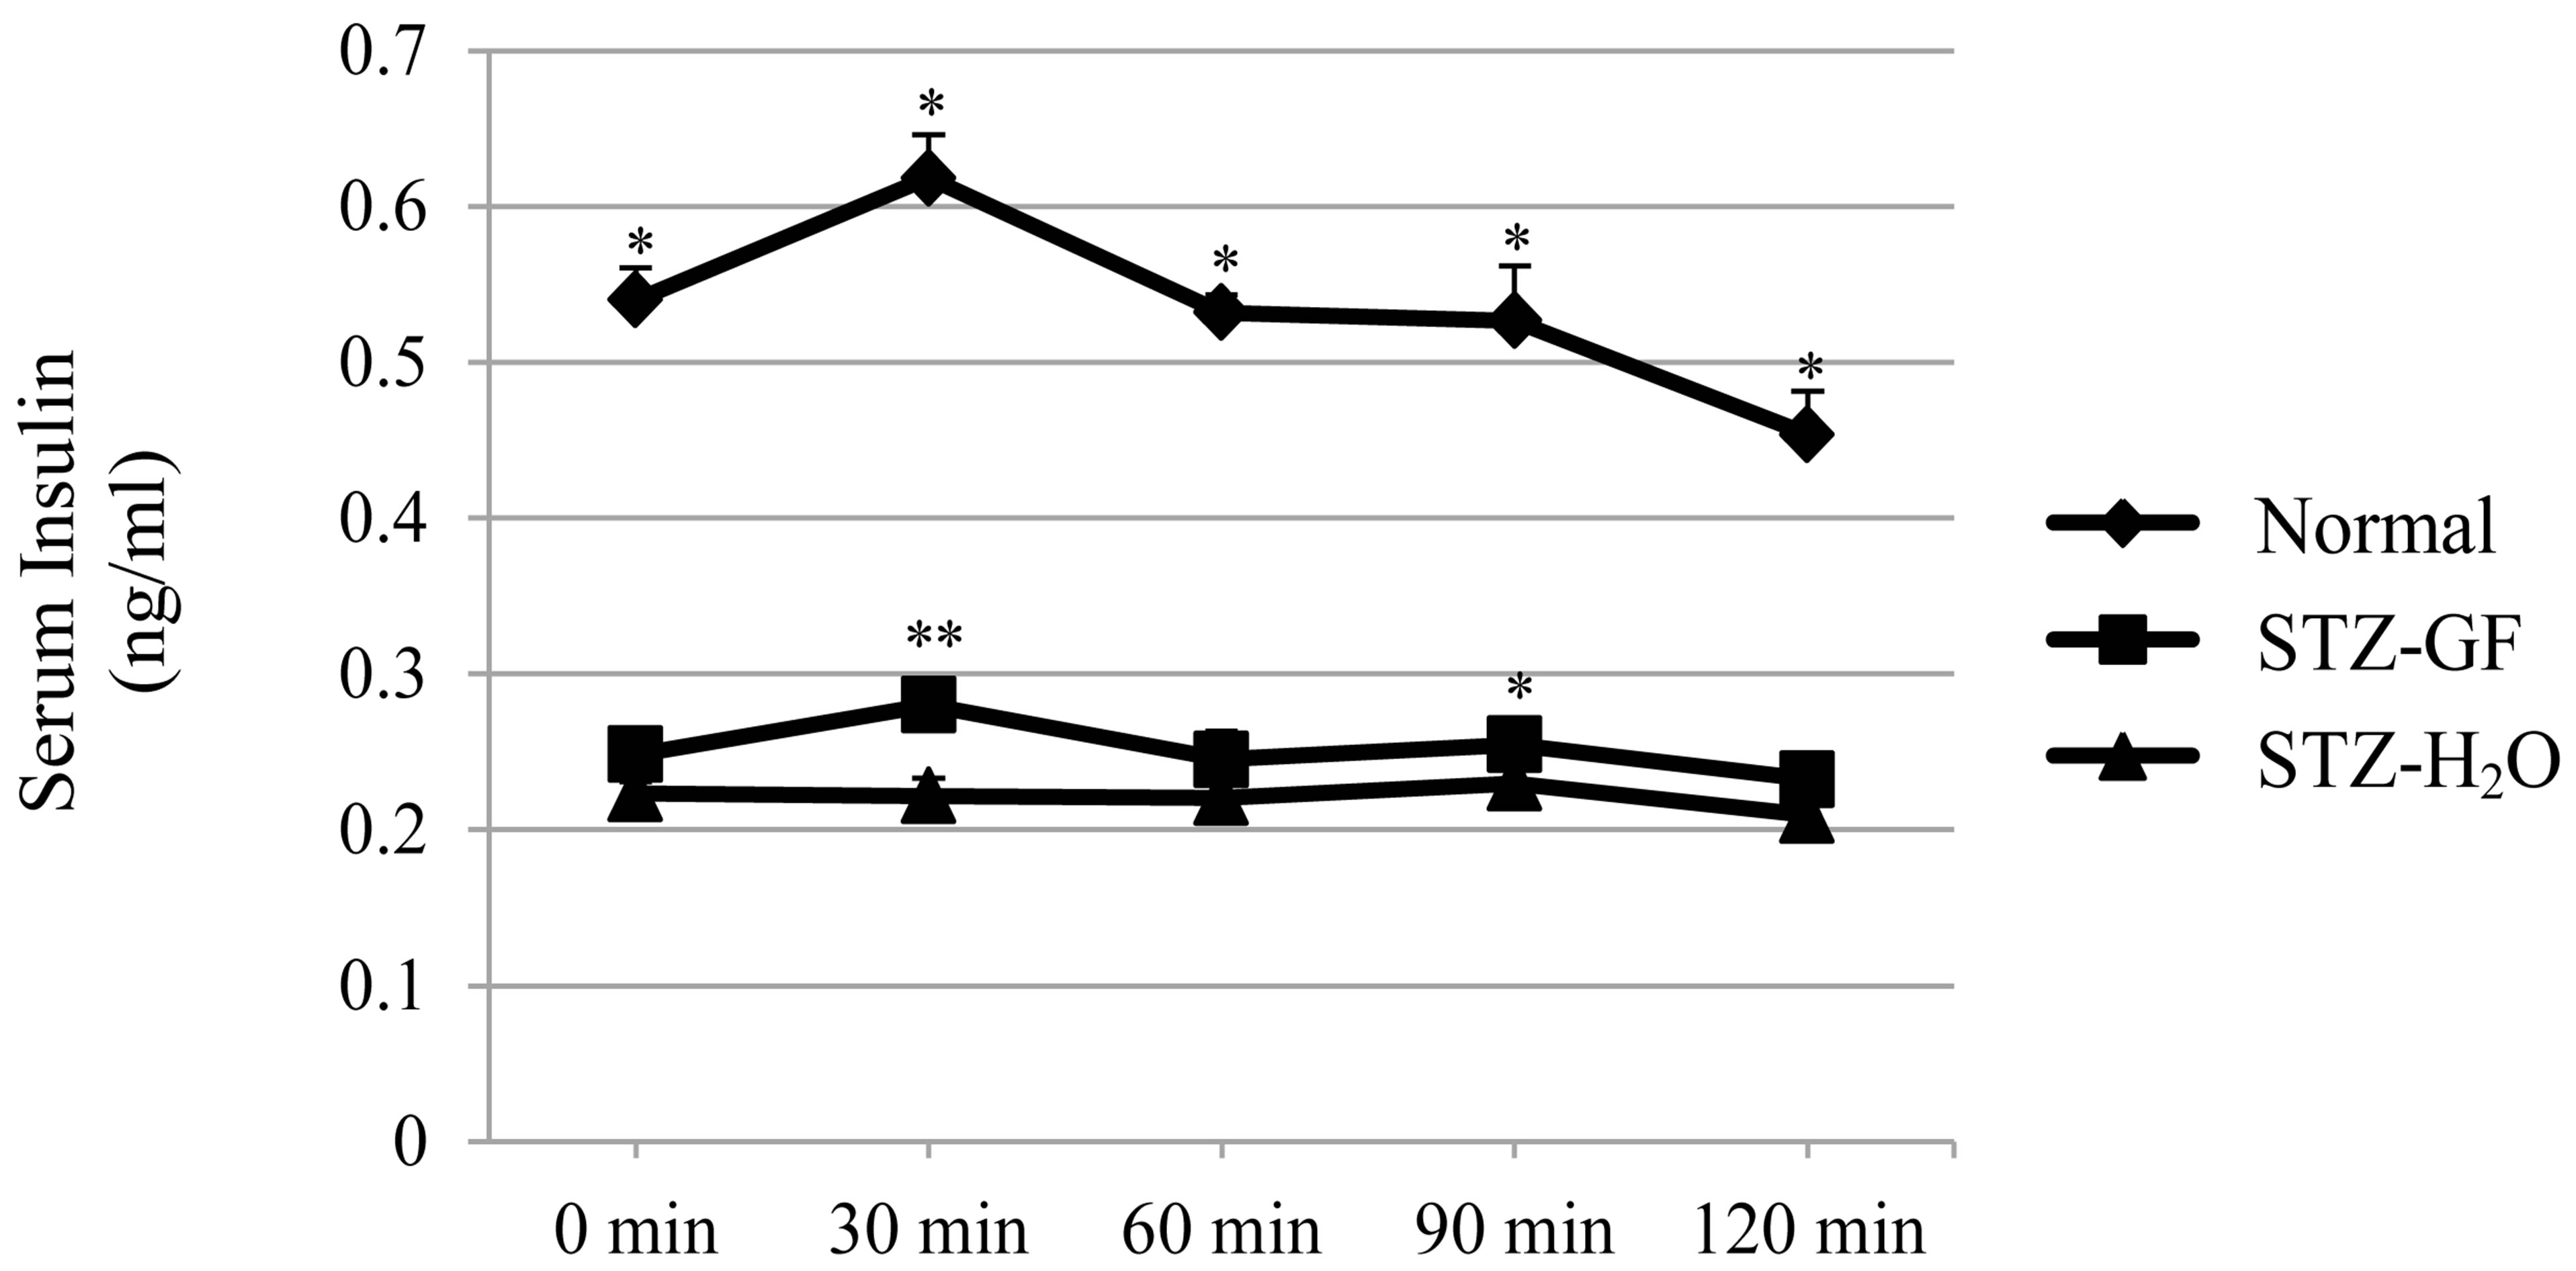 (b)
(b)
Figure 1. Effects of GF on serum glucose level (a) and serum insulin level (b) in STZ-diabetic mice after loading a bolus of glucose. GF was treated for 6 hours into 3 hourfasted STZ-diabetic mice. After loading a bolus of glucose (1.5 g/kg), blood was collected sequentially from the neck vein at intervals of 0, 30, 60, 90 and 120 min and measured serum glucose level and serum insulin level. Values represent means ± S.E.M. of 4-7 data. *P < 0.05, **P < 0.01: Significantly different from H2O-treated STZ-diabetic mice.
In contrast, insulin level in H2O-treated STZ-diabetic mice was not changed after glucose loading. GF stimulated insulin release after exogenous glucose loading.
3.3. Effect of GF on Insulin Tolerance
Effect of GF on insulin tolerance was examined in STZdiabetic mice. After loading a bolus of insulin (0.65 U/kg), insulin-induced changes of glucose level were measured in normal mice, GF-treated and H2O-treated STZ-diabetic mice (Figure 2). The serum glucose level of GF-treated STZ diabetic mice decreased significantly from 30 min to 120 min after insulin loading. However, serum glucose level was only decreased at 30 min in normal mice but was not influenced in H2O-treated STZdiabetic mice during incubation times. GF significantly decreased serum glucose in STZ-diabetic mice in the presence of insulin.
3.4. Effect of GF on HOMA-IR
Effect of GF on HOMA-IR was examined in STZ-diabetic mice. HOMA-IR analysis was used to assess insulin resistance in normal mice, GF-treated and H2O-treated STZ-diabetic mice (Figure 3). Values for HOMA-IR were

Figure 2. Effect of GF on serum glucose level in STZ-diabetic mice after loading a bolus of insulin. GF was treated for 6 hours in 3 hour-fasted STZ-diabetic mice. After loading a bolus of insulin (0.65 U/kg), blood was collected sequentially from the neck vein at intervals of 0, 30, 60, 90 and 120 min and measured serum glucose level. Values represent means ± S.E.M. of 4-5 data. *P < 0.05, **P < 0.01: Significantly different from H2O-treated STZ-diabetic mice.

Figure 3. Effect of GF on values of HOMA-IR in STZ-diabetic mice. HOMA-IR was calculated from glucose (mg/dl) and insulin (μU/ml) levels, using the following formula: HOMA = fasting glucose (mg/dl) x fasting insulin (μU/ml) / 405. Values represent means ± S.E.M. of 4-22 data. **P < 0.01: Significantly different from H2O-treated STZ-diabetic mice.
calculated from the values of serum glucose (mg/dl) and serum insulin (μU/ml) in mice fasted over night. HOMAIR in STZ-diabetic mice was about 11.3 time-greater than that in normal mice. However, HOMA-IR in GFtreated STZ-diabetic mice was significantly smaller than that in H2O-treated control. GF improved insulin resistance in STZ-diabetic mice.
3.5. Effect of GF on 2-Deoxy-D-Glucose Uptake in Soleus Muscle
Effect of GF on uptake of 2-DG was measured in soleus muscle of STZ-diabetic mice. 2-DG uptake in soleus muscle of H2O-treated STZ-diabetic mice was significantly lower than that of normal mice. After treated with GF, GF increased 2-DG uptake 1.5 time-greater than control of H2O-treated STZ-diabetic mice (Figure 4). GF promoted basal 2-DG uptake in soleus muscle of STZdiabetic mice.
Insulin (10 nmol/ml) significantly increased 2-DG uptake of soleus muscle1.4 times and 1.3 times greater in normal and GF-treated STZ-diabetic mice, respectively. Whereas insulin did not affect 2-DG uptake of soleus muscle in H2O-treated STZ-diabetic mice. Compared to H2O-treated control, GF increased 2-DG uptake 1.8 timegreater with insulin in STZ-diabetic mice (Figure 4). GF promoted insulin-induced 2-DG uptake in soleus muscle of STZ-diabetic mice.
3.6. Effect of GF on Expression of GLUT4 to the Plasma Membrane in Soleus Muscle
Effect of GF on GLUT4 expression in plasma membrane was measured in soleus muscle of STZ-diabetic mice. After treatment of GF for 3 hours in STZ-diabetic mice, GF significantly increased GLUT4 expression in plasma membrane fraction 1.1 time-greater than that in H2Otreated control. After its treatment for 6 hours, GF significantly increased GLUT4 expression 1.4 time-greater (Figure 5). GF increased GLUT4 expression in plasma membrane of soleus muscle in STZ-diabetic mice in an incubation time-dependent manner.
3.7. Effect of GF on Phosphorylation of Akt (P-Akt) in Soleus Muscle
Effect of GF on the P-Akt in cytosolic fraction of soleus muscle was measured in STZ-diabetic mice. After treatment of GF for 3 hours in STZ-diabetic mice, GF significantly increased ratio of P-Akt to Akt in cytosolic fraction of soleus muscle 1.4 time-greater. After its treatment for 6 hours, GF significantly increased ratio of P-Akt to Akt in the cytosolic fraction 1.9 time-greater (Figure 6).
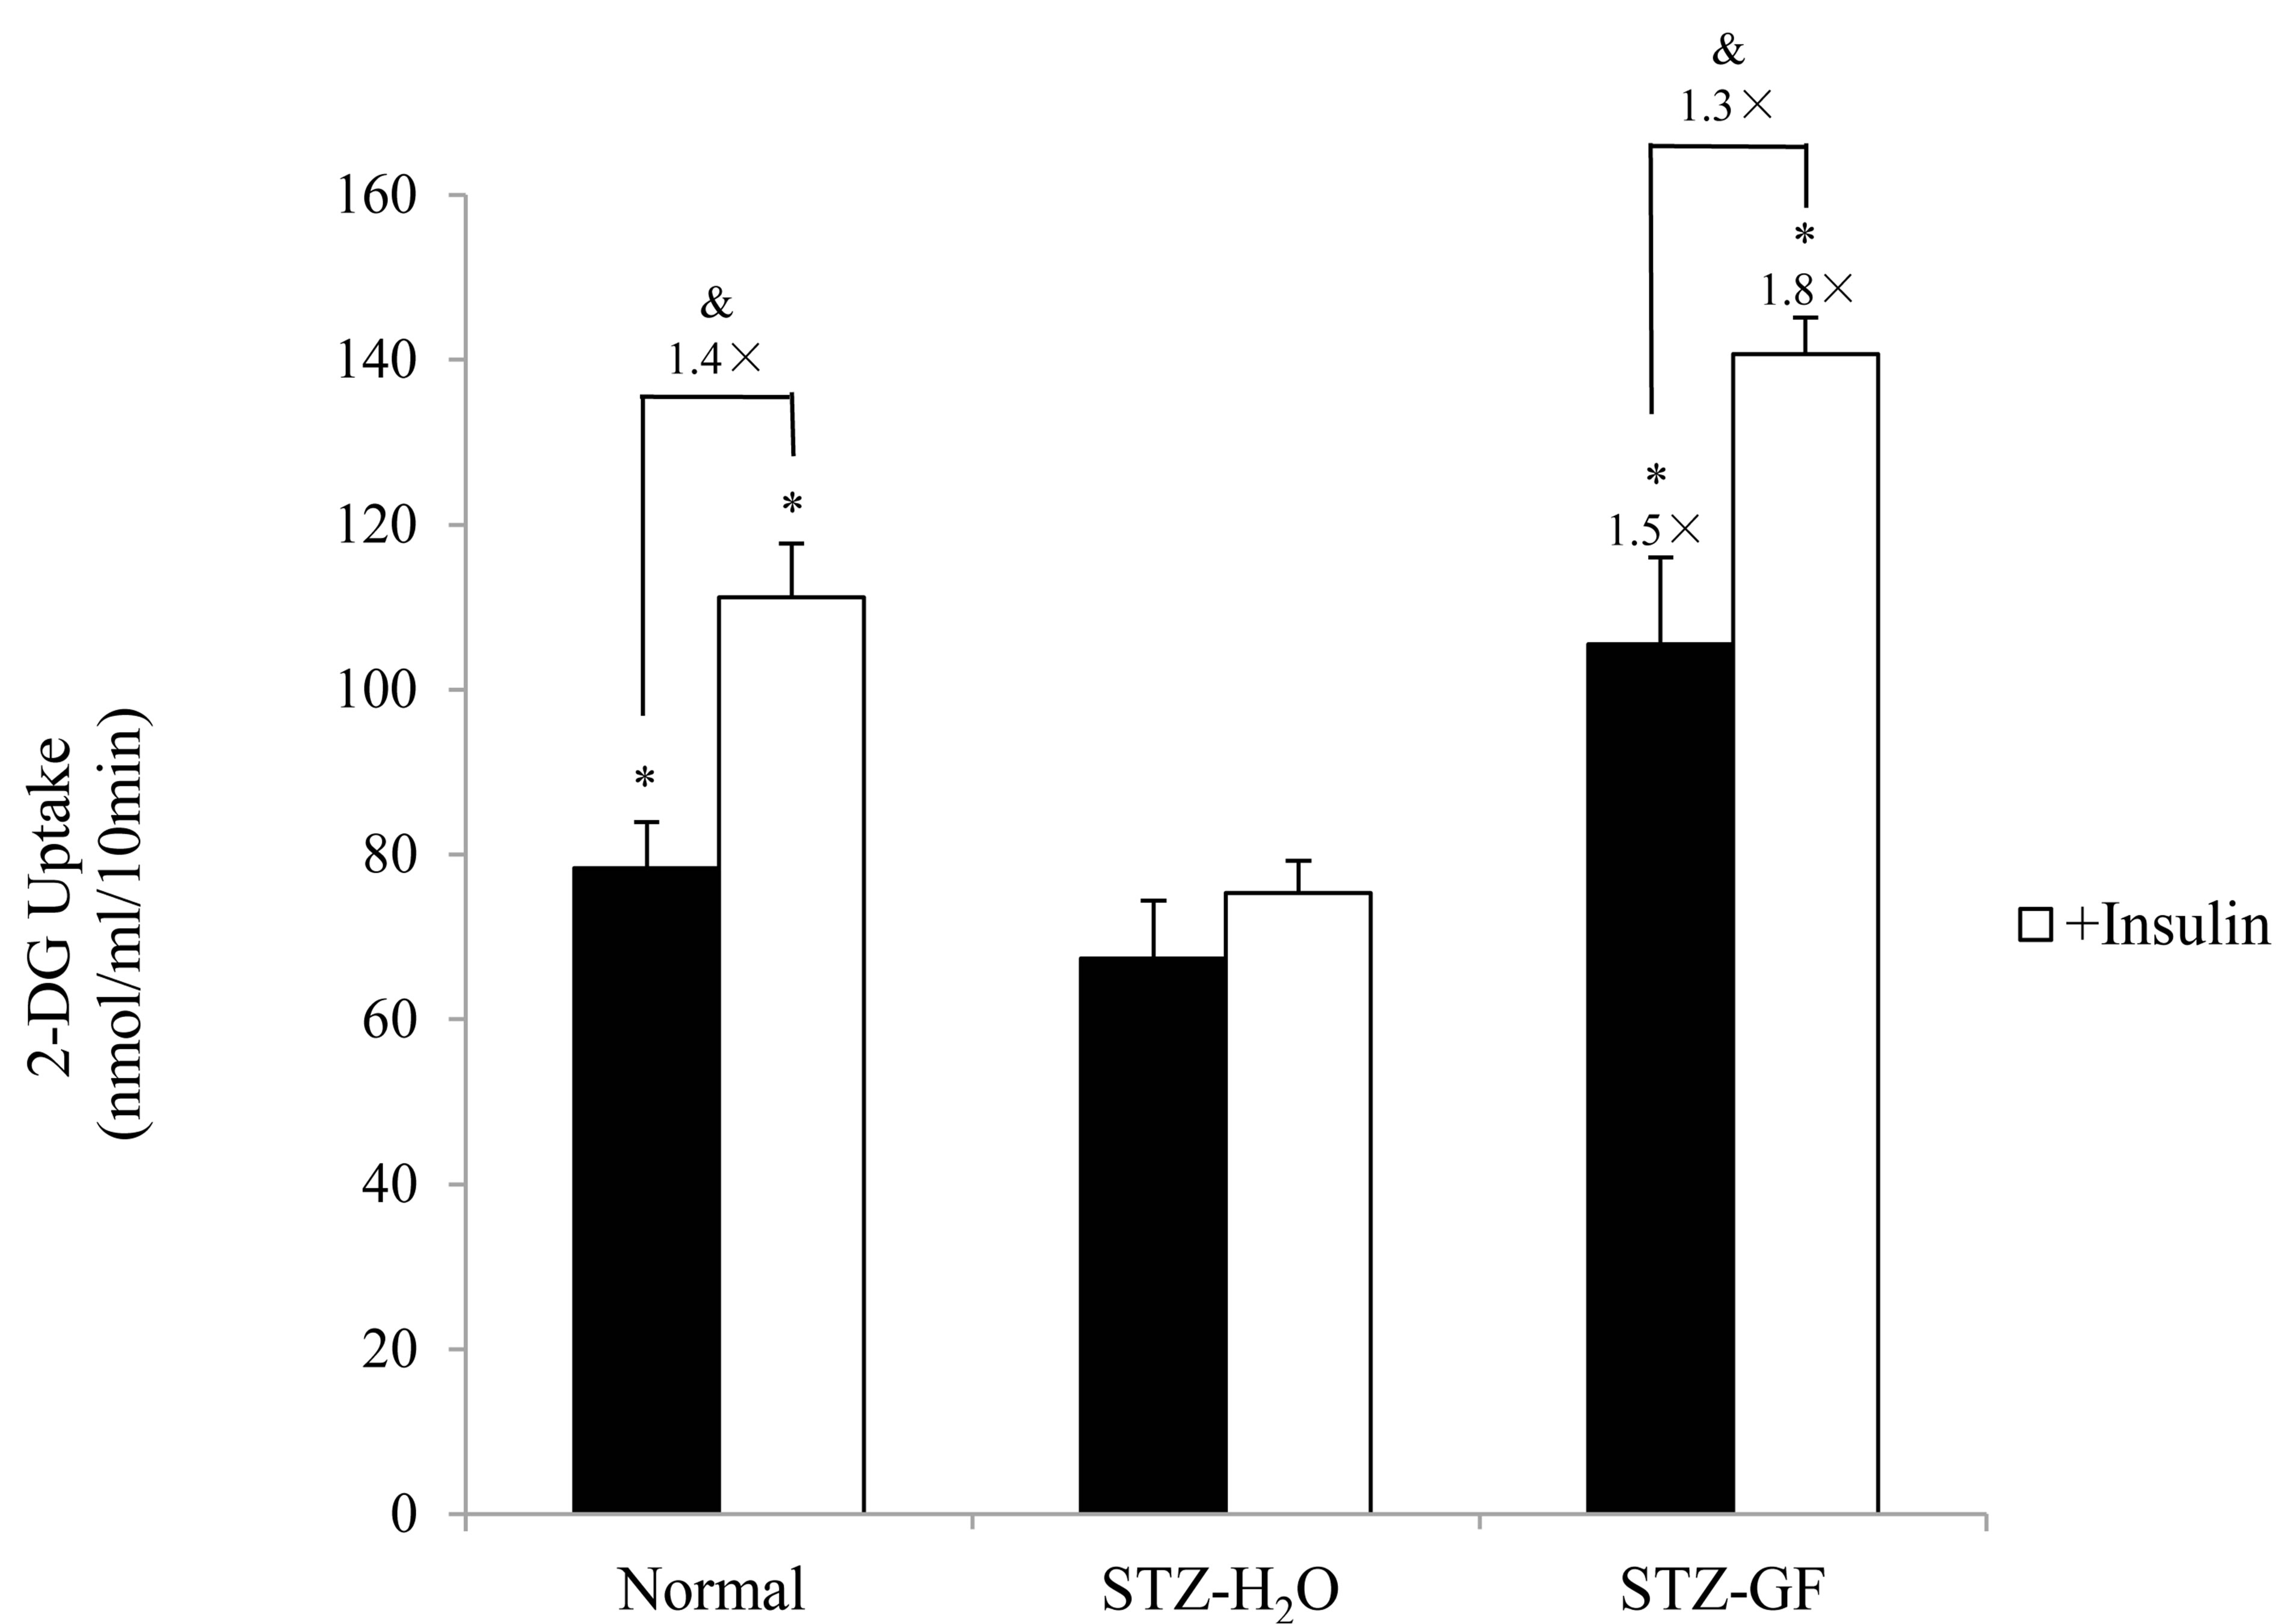
Figure 4. Effect of GF on 2-DG uptake in soleus muscle of STZ-diabetic mice. Soleus muscles were incubated for 10 min in 2-DG with or without insulin (10 nmol/ml). 2-DG uptake was normalized to tissue weight. Values represent means ± S.E.M. of 3 data. *P < 0.05: Significantly different from H2O-treated STZ-diabetic mice. &P < 0.05: Significantly different from without insulin.
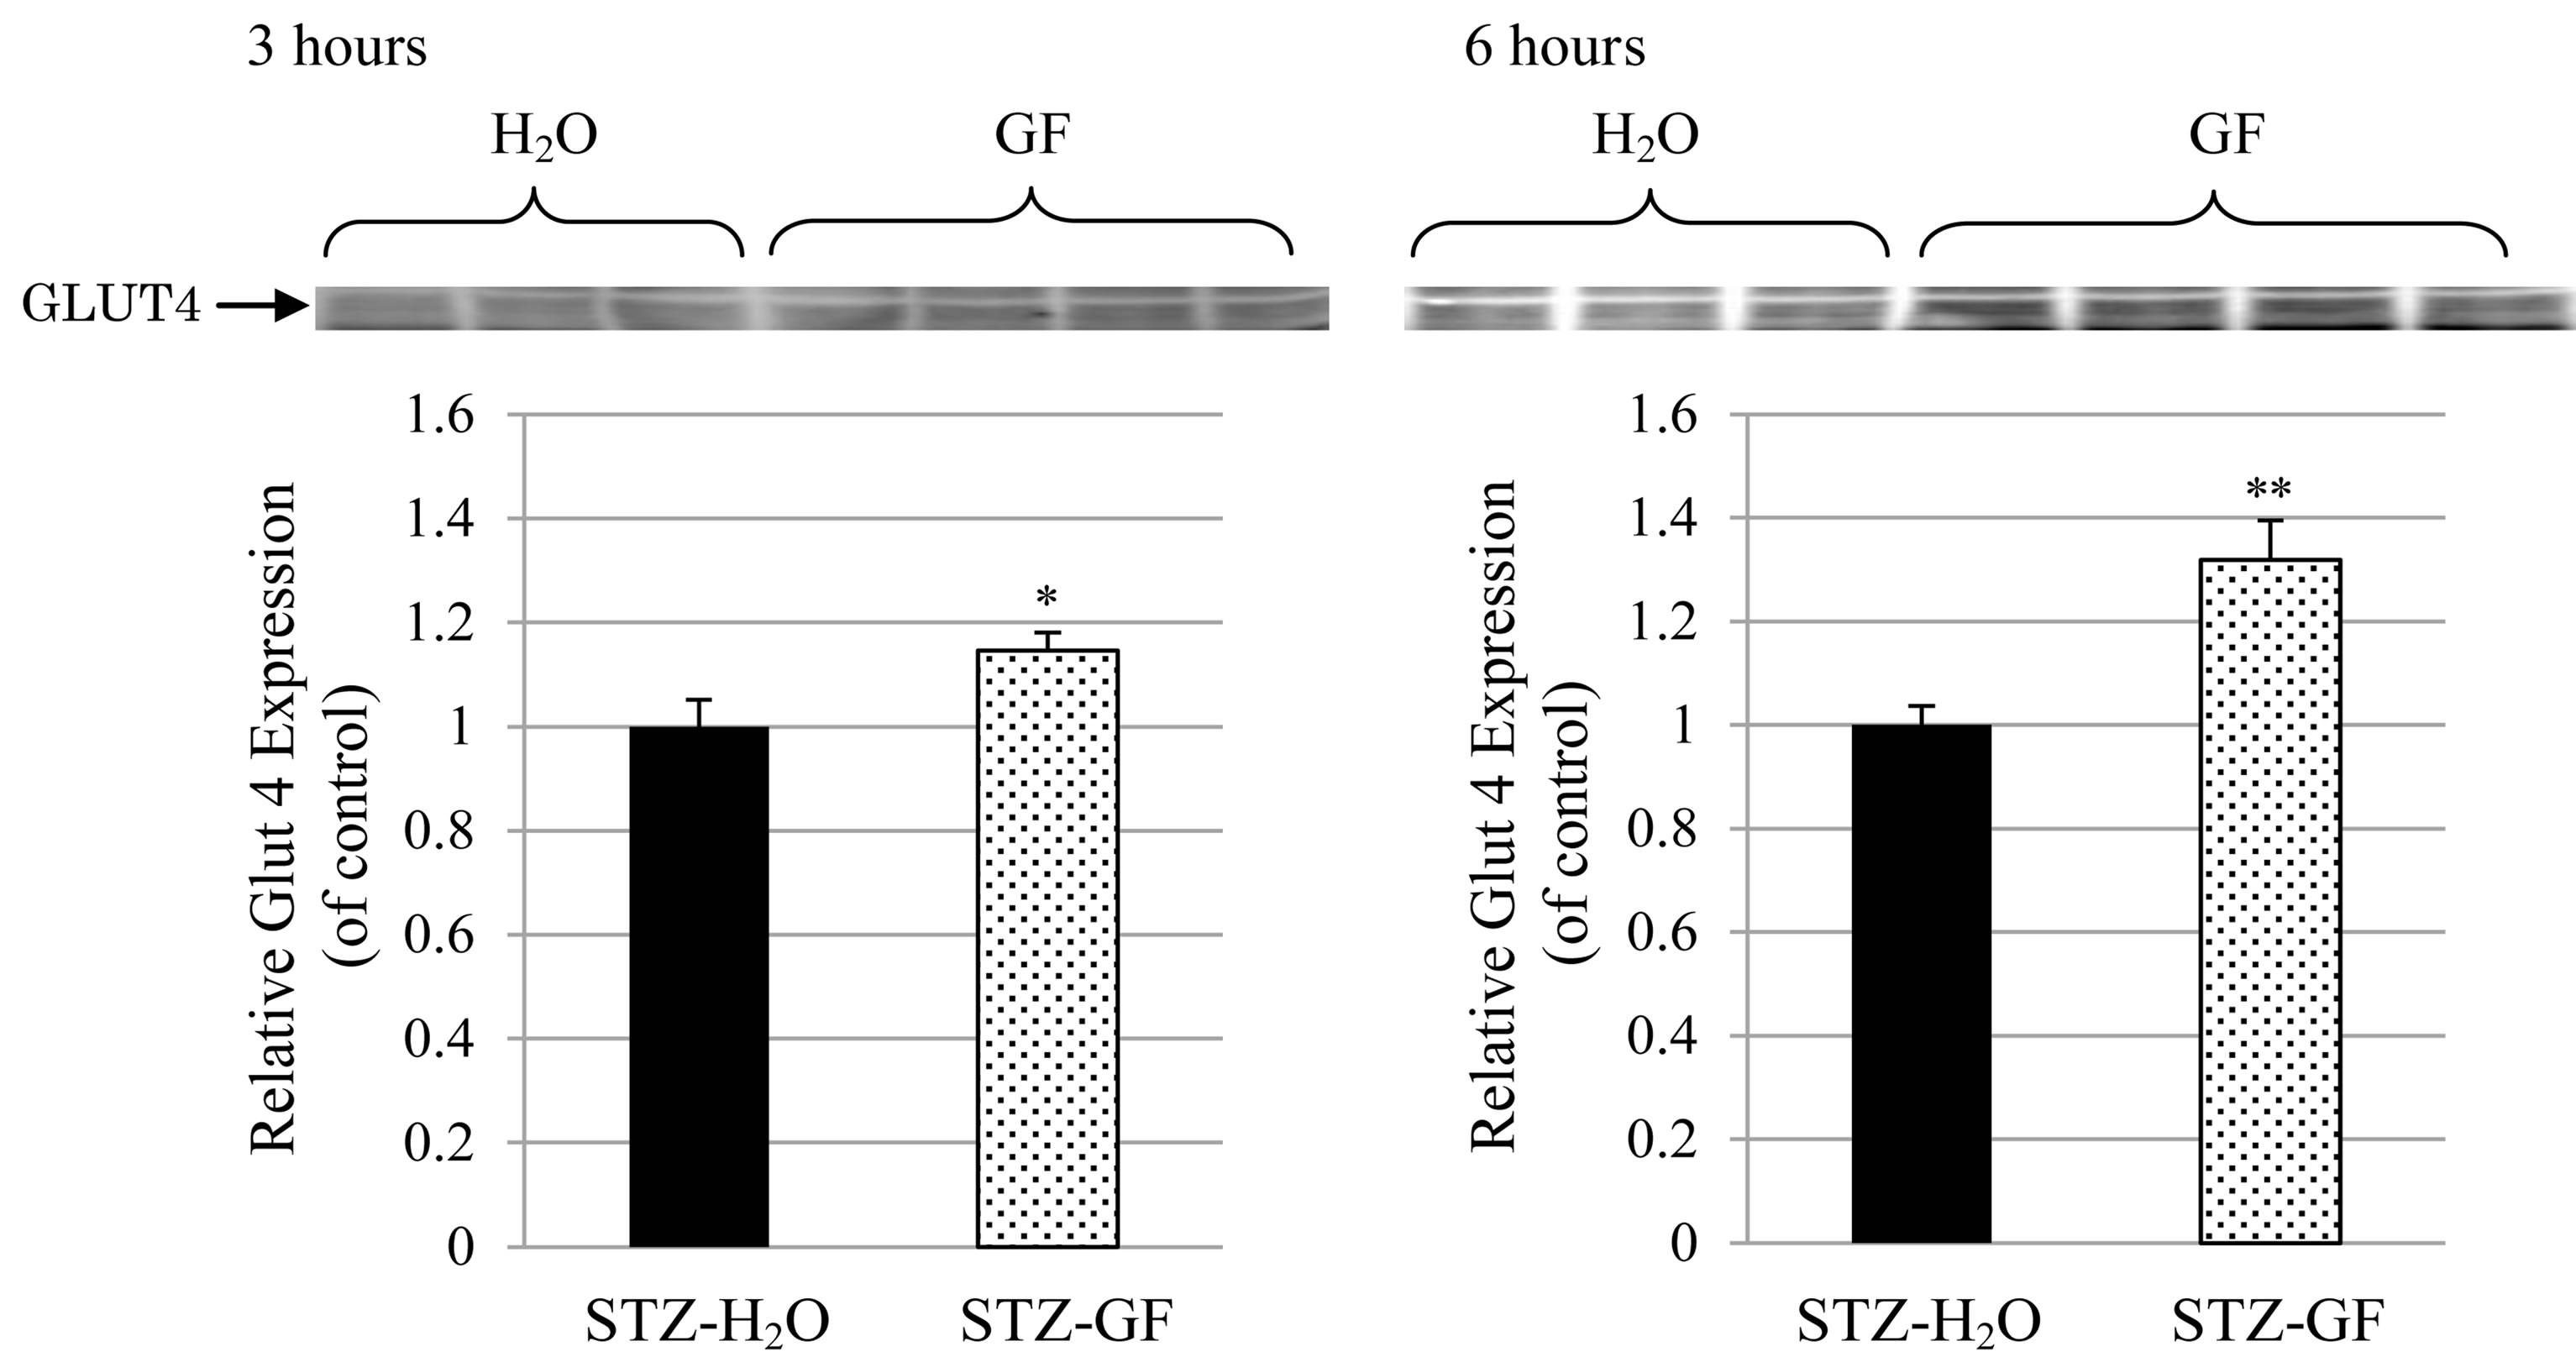
Figure 5. Effect of GF on GLUT4 expression in the plasma membrane of soleus muscle in STZ-diabetic mice. GF was treated in 3 hour-fasted STZ-diabetic mice for 3 hours (left) and 6 hours (right). The protein levels of GLUT4 in plasma membrane fraction of soleus muscle were detected by western blotting analysis. Values represent means ± S.E.M. of 6-12 data.*P < 0.05, **P < 0.01: Significantly different from H2O-treated STZ-diabetic mice.

Figure 6. Effect of GF on proportion of P-Akt in Akt in cytosolic fraction of soleus muscle in STZ-diabetic mice. GF was treated in 3 hour-fasted STZ-diabetic mice for 3 hours (left) and 6 hours (right). The protein levels of Akt and P-Akt in cytosolic fraction of soleus muscle were detected by western blotting analysis. Values represent means ± S.E.M. of 4 - 6 data. *P < 0.05, **P < 0.01: Significantly different from H2O-treated STZ-diabetic mice.
GF significantly increased relative Akt phosphorylation in soleus muscle of STZ -diabetic mice in an incubation time-dependent manner.
4. Discussion
GF has long been used in traditional Chinese medicine [30] and alleviates the abnormal glucose/lipid metabolism in STZ-diabetic mice [23,24]. The present study demonstrated mechanisms of GF for anti-hyperglycemic action in STZ-diabetic mice. Single administrated GF to STZ-diabetic mice improved glucose level after glucose loading, as observed in the IPGTT (Figure 1). GF accelerated clearance of exogenous glucose, and significantly lowered serum glucose level in STZ-diabetic mice. GF also reduced insulin intolerance in STZ-diabetic mice as observed in the IPITT (Figure 2). After insulin loading, GF potentiated insulin-induced decrease in serum glucose level in STZ-diabetic mice, demonstrating that GF improved insulin sensitivity in STZ-diabetic mice. STZ-diabetic mice increased HOMA-IR, another insulin resistance index (Table 1). GF significantly reduced HOMA-IR in STZ-diabetic mice (Figure 3), supporting that GF improve insulin resistance of diabetic mice.
Effect of GF on insulin resistance for 2-DG uptake was investigated in soleus muscle of STZ-diabetic mice. Insulin did not affect 2-DG uptake in soleus muscle of STZ-diabetic mice. However, GF increased both basal 2-DG uptake without insulin and insulin-induced 2-DG uptake to soleus muscle. The effect of GF on insulin-induced 2-DG uptake was greater than that on basal 2-DG uptake (Figure 4). These results demonstrate that GF improves resistance of insulin for 2-DG uptake in the soleus muscle of STZ-diabetic mice. The uptake of 2-DG is closely associated with expression of GLUT4 in plasma membrane of soleus muscle. GF increased expression of GLUT4 in the plasma membrane of diabetic soleus muscle in a treatment time-dependent manner (Figure 5). GF may enhance expression of GLUT4 in plasma membrane to improve insulin sensitivity for glucose uptake in STZ-diabetic mice. These effects of GF on GLUT4 expression and 2-DG uptake are a novel and intriguing finding in STZ-diabetic mice. Moreover, GF increased proportion of phosphorylated Akt in cytosolic fraction of soleus muscle (Figure 6). From these results, GF-increased phosphorylation of Akt may have a key role for translocation of GLUT4 to plasma membrane and for improvement of insulin resistance for glucose uptake in diabetic soleus muscle. Ma et al. reported that genipin, an aglycone of geniposide which was a main bioactive compound of GF, activated IRS-1, PI3-K and P-Akt, and resulted in GLUT4 translocation and glucose uptake in C2C12 myotubes [31].
Our previous study demonstrated that GF had anti-hyperglycemic action but did not change serum insulin level when GF was treated in 3 hour-fasted STZ-diabetic mice for 6 hours [23,24]. However, GF significantly increased serum insulin level at 30 min after glucose (1.5 g/kg) loading in IPGTT test (Figure 1(b)). It implied that GF did not directly stimulate insulin secretion like sulfonylurea. The effect of GF on release of insulin was under the stimulation of high exogenous glucose in STZ-diabetic mice. Possible mechanism of GF maybe associated with one or some factors, which restrict insulin secretion in the presence of glucose.
Mitochondrial uncoupling proteins (UCPs) are present in the mitochondrial inner membrane, which dissipate the proton gradient by allowing the re-entry of protons into the mitochondrial matrix during oxidative ATP generation, resulting in the uncoupling of the respiratory chain and heat production [32]. It has been reported that UCP2 and UCP3 gene expressions were increased in skeletal muscle in STZ-diabetic rat, while UCP1, UCP2 and UCP3 gene expressions were reduced in brown adipose tissue of these rats [33]. UCP2 negatively regulates glucose-stimulated insulin secretion in type 2 diabetes models through altering the yield of ATP synthesis from glucose [34,35]. UCP3 is suggested to limit the product of reactive oxygen species (ROS) by mediating mechanism of mild uncoupling, diminishing super oxide production [36]. Genipin is an inhibitor of UCP2 and increased insulin secretion by pancreatic β cell under the stimulation of glucose [37]. Genipin inhibited UCP3 to increase levels of ROS and ATP, activated IRS-1, PI3-K and downstream signaling pathway, resulting in GLUT4 translocation and increased glucose uptake in C2C12 myotubes [31]. It is also reported that geniposide activates the glucagon-like peptide-1 receptor (GLP-1R) to improve glucose stimulated insulin secretion in INS-1 cells [38].
5. Conclusion
Single administered GF improved insulin resistance and showed anti-hyperglycemic action in STZ-diabetic mice. The improving action of GF on insulin resistance was coupled to reduced glucose intolerance, improved insulin tolerance, reduced HOMA-IR, and the potentiation of insulin signaling pathway via P-Akt, GLUT4 and glucose uptake in soleus muscle of STZ-diabetic mice.
NOTES