Generic Substitution Effects on Firm Level Market Shares in the Finnish Beta Blocker Market 1997Q1-2007Q4 ()
1. Introduction
Industrial organization (IO) aspects of health care markets do not have a central position in the health economics literature. However, typical questions found in IO textbooks and research articles—like market structure, number of firms, firms’ market shares, price competition, and regulation—are in the core of health care market analysis. Evidently some research has been conducted from standard IO perspective with valuable insights [1-4]. However, analysis of drug markets with references to IO literature has been quite active. Market dynamics between the brand name drugs and their generic copies is a question of some interest in the current IO research agenda (see e.g. references cited below). In the following, our focus is on the firm level market structure of beta blocker packages sold in Finland during period of 1997Q1- 2007Q4. The hypothesis is that, although prices have decreased in response to the generic substitution system introduced on the 1st of March 2003, the firms’ observed market shares have not necessarily decreased. The market structure analysis is conducted with data analysis and with four different market concentration measures. The analysis is also augmented with different regression methods.
The structure of the paper is as follows. Section 2 reviews the background of generic substitution in the drug markets. Section 3 gives the details on the measurement of market concentration and power. Section 4 analyzes the market structure of beta blockers in Finland in the sample period. The focus is on the descriptive analysis of the number of involved firms and on the measurement of firms’ whole sales and substitution group market shares. The analysis is also cast in difference-in-difference regression framework in order to derive more transparent effects of substitution policy on firms’ market shares. Sections 5 and 6 discuss the results and conclude the paper.
2. Background
The target in the EU region is to urge governments to encourage price differentiation and competition in drugs markets. Regulation instruments like reference pricing systems, prescribing budgets, generic substitution, patient co-payments, monitored pharmacy sales and physician prescriptions employed by governments can be effective in stimulating generic up-take. However these measures must also stimulate competition in the markets [5,6]. Ultimately, generic substitution is a key issue for all generic pharmaceutical manufacturers as it can provide an effective boost to the dispensing of generic medicines, consequently providing room for the growth of the generic market; for example, reference pricing is believed to increase price variability and hence promote competition between firms. However, if firms strategically respond to regulation by optimally anticipating the effects on the reference price level then the effectiveness of enhancing competition might be jeopardized [7]. Regulation systems that predominate in Europe indicate that, although it may lead to price reductions, application of these policies may constitute a barrier to dynamic competition in consumer prices [8].
In Finland a generic substitution with regulated price system started on the 1st of March 2003. The medicines are categorized into chemical or therapeutically equivalent product sub-groups. These groups with identical or similar active ingredients (molecules) are called “reference” or “substitutions” groups. The national health authority classifies similarity between medicines. The pharmacist has to suggest substitution of the original drug if it is not already located in the price band determined by the price of the least expensive product in the substitution group by a margin of EUR2 or EUR3 depending on the level of package price. The consumer can deny the replacement. Most importantly, many brand name products that can be dispensed are outside the group price bands. The consumer pays the price difference above the group’s upper price margin. The prices are typically subsidized by the state up to 60% for most of prescribed drugs. Thus it is expected that firm competition also takes place within these substitution groups. Note that the maximum wholesale prices of prescription drugs available to all pharmacies that are reimbursed by the government are determined by negotiations between the producers and the regulatory authority. The authority also sets the retail mark-up price for reimbursed drugs.
The active generic substitution policy has reduced pharmaceutical expenditures and drug prices across Europe, including Finland, but less is known about how the markets have been re-structured after the policy change. Important questions to ask are those such as (1) have new firms with generic products penetrated the market? and (2) have the market shares of firms producing brand names been eroded? Most papers in the field have focused on the first question [9,10]. On the general level results on generic entry and its factors are well known. Number of brand names in the markets, expected revenues, and profits increase the number of entrants. However, the number of generic firms already in the market, regulated markets with price caps, and reference price systems supporting price convergence effects lower the number of entrants.
The second question is considerably less analyzed. In the United States (US) original brand market shares have been found to have an inverse relationship to the age of the originals, and major brand names typically lose half of their market shares within one year of patent expiry. The penetration (i.e. market shares) for un-branded products, a decade after patent expiration, is quite strong in the US and in Germany, but less in the United Kingdom and in France [11-13]. High price ratio between brands and generics, the market size, and the number of brand names in the market also mean a larger share for generics. In Slovenia the introduction of generic substitutions based on the reference price system in November 2003 led to a large increase of market share of generics [14,15]. Finally, in Sweden, data on 12 different chemical substance classes for the years 1972-1996, the relative change of market shares of original drugs was nonpositive and the relative price of the original drug to the price of the generic substitute significantly decreased the market size of brand names in five substance classes [16]. The reference price system introduced in 1993 had the same effects on three classes. The authors emphasize that the differences in results between the substance classes underline the importance of using disaggregate data.
All these studies focus on the market shares of brand products versus shares of generics on the aggregate level or on some chemical substance level. However, this type of aggregation masks the firm level market share dynamics. In the context of price regulation, like reference price or generic substitution systems, the firm level policy implications are less evident.
First of all, price regulation does not correspond to efficient (competitive or non-competitive) market conditions, since the objective of regulation is to reduce costs of private and public drug expenditures [17]. This can happen in the environment where market conditions may be very non-competitive and regulation effects on these conditions are minimal. Second, price regulation targeted to reduce retail prices also lowers profits for the entrant firms. Thus regulation does not necessarily increase the number of firms—and the competition—in the market. Third, both vertical and horizontal product differentiation still have their role in the multi-market context typical for the drug markets. Here the contact dimensions between the firms are important [18]. Firms with many brand names and generics in the multi-market competition are a complex playground wherein firm level shares do not necessarily decrease in the presence of generic substitutions and reference price systems. On the market level the dominant firms can redistribute their market powers in the contact space with their brand and generic products (i.e. the “own generics” phenomena) so that their whole or average market shares are not eroded [19-21]. Also by adjusting their product prices in substitution groups in response to generics they can keep their whole market and average group level market shares. Evidently the policy change of generic substitution may leave the market shares and contacts intact. Overall market specific drug prices decrease because of generics induced by the policy change but the market may not evolve towards being a more competitive one identified with firms’ market power and shares. Finally, the policy change can also have some negative side effects, such as non-permanent firm and product entries, that may be harmful for the drug users.
With this background the paper analyses the Finnish beta blocker market during the period of 1997Q1 to 2007Q4 (T = 44). During this period 47 different firms or their distributors were observed. The data contained 83 product names with 359 product items. The number of still-protected brand names was 31 in the beginning of the sample period and they belonged to sub-group 0 wherein the generic substitution was not practiced. The rest of the products (52) consisted of brand names with patent expiry and of generics distributed in 38 substitution groups. The observed number of active chemical ingredients was 20. In total the number of observations was 8050.
3. Methods
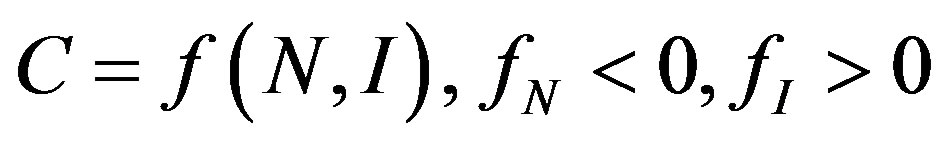
The purpose of a measure of market and industrial concentration is to provide summary statistics reflecting the distribution of firms in a market, indexing one element of market power [22]. It is generally agreed that this should be a one-dimensional measure, incorporating two relevant aspects of market structure, namely number of firms (N) and size inequalities (I). We can represent a proper index of concentration, C, as:
 (1)
(1)
We assume, on the basis of almost any theory of market structure, that the smaller the number firms and the more unequally sized they are, the more market power they can exert as a group. Note that the structure of  entails that “iso-concentration” curves have the shape of
 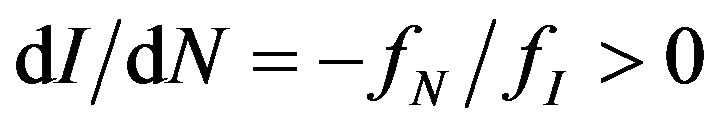 in (I,N)-space and that concentration C increases because of increased firm size inequality with a given number of firms.
The main target of market concentration analysis is to find an appropriate way to measure size inequalities in combination with firm numbers. Given the need to measure inequality, we need a convention for measuring firm size. In this context inequality will be based upon the relative drug market shares of the firms. More precisely, we focus on the total monetary or nominal sales of firms on particular drug markets; that is , where piqi is the firm i’s
  nominal sales and PQ is the total market sales of drugs on the relevant market (e.g. beta blockers). Note that nominal sales have two components, the price and the quantity. In the following we pay more attention to sold quantities
  than nominal sales. Only if relevant differences between quantity and nominal sales are observed are they reported. The observed differences can be interpreted as residual terms referring to firms’ prices.
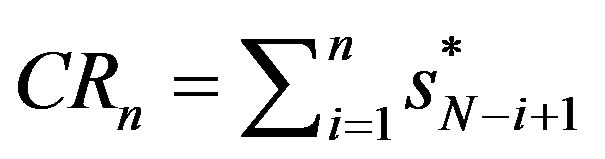
Note that if all firms have the equal nominal or the equal “output” then  for all i. In general Equationh (1) demands that there will be an inverse relationship between firm numbers and market shares. The easiest way to handle Equation (1) in practical concentration analysis is to observe that the concentration ratio is defined as
 (2)
(2)
where the firms in the market are ranked from largest market share  to smallest, with the nth largest being indexed with
 is popular because of its easy interpretation as it provides a sign of the oligopolistic nature of a market and indicates the degree of competition. For this purpose we use
  and
and . Note that value of
  is increasing both in
  and in
  violating the proper conditions for
 .
.
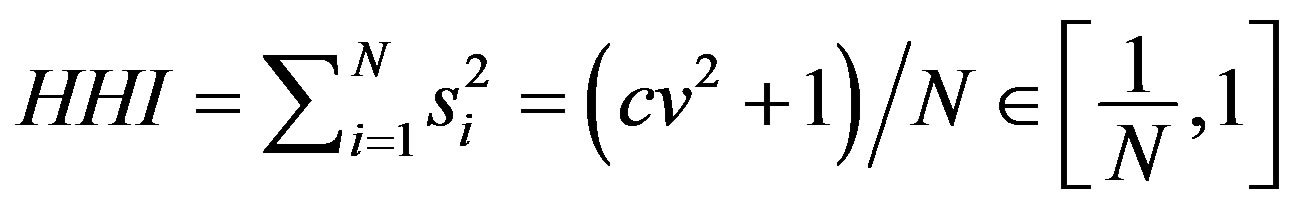
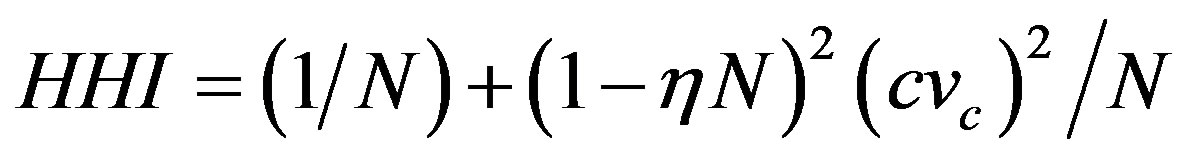
In principle we could calculate  but the most straightforward and popular index that captures the whole market size distribution is the Hirschman-Herfindahl index (HHI)
 (3)
(3)
where cv is coefficient of variation of . Thus HHI encapsulates in a proper way both the inequality and firm number effects suggested in
  as cv is a statistical measure of inequality. In addition to this it can be shown that under the Cournot oligopoly model with
where  is market demand price elasticity,
  is firm’s marginal cost, and P is the market price, HHI has the following form
 (4)
(4)
where  is the coefficient of variation of marginal costs [23]. Thus HHI is closely related to basic theoretical results that determine the market structure. The reciprocity of index indicates the “equivalent” number of firms in the market.
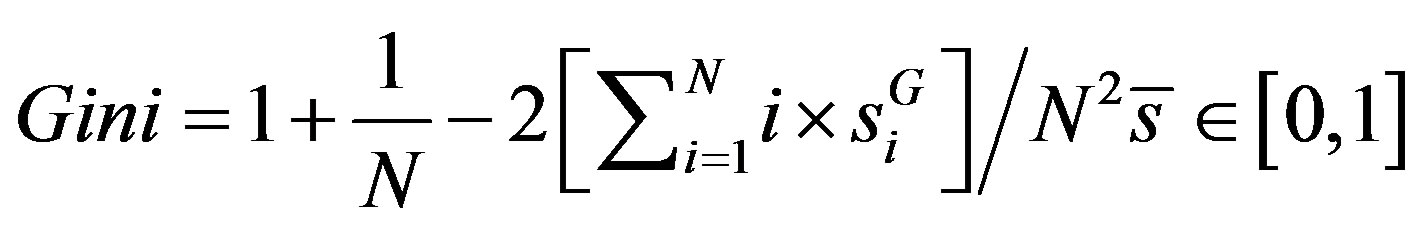
Another global measure that focuses on the inequality is the Gini-coefficient developed from the Lorenz curve. Let  be the ith ordered firm share in increasing order
 . Now the Gini coefficient or index can be calculated as [24]
 . (5)
. (5)
The problem with the Gini coefficient is related to the fact that two intersecting Lorenz curves can provide equal or even non-intuitive Gini coefficients.
The problems of global measures can partly be avoided if the concentration analysis is cast at the local level. The concept of market dominance is important here. By market dominance we mean that one firm, obviously the largest one, dominates the market. This suggests the following measure for market dominance:
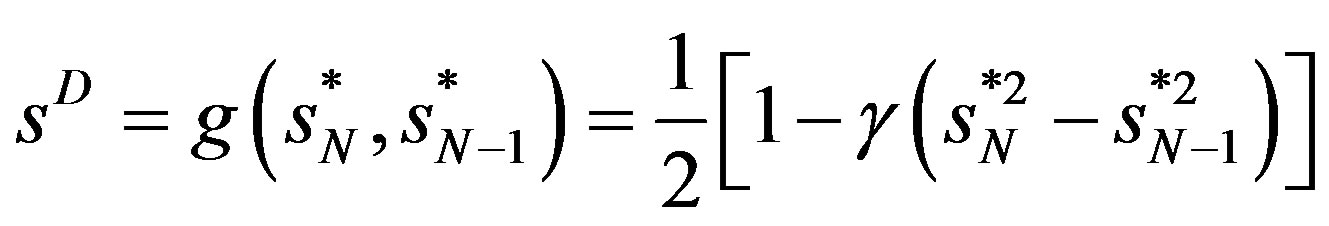 (6)
(6)
where  is the largest market share and
  is the next largest market share. Reference [25] argues that
  is suitable as a benchmark. We scale
  in the following way
 (7)
(7)
to get the measure comparable with the other indexes suggested earlier. Thus if  and if
  (with
(with ),
),  , not 0 like sD . Now all the market structure measures,
  ,
,  , GINI, HHI, and sD*, get a high value when the relevant drug market is dominated by few firms having large market shares. Value of one is obtained for all if there is only one firm in the market.
4. Results
4.1. Prices and Sales
Although the defined daily doses (DDD)-adjusted package prices of beta blockers are not the main focus of the paper, we report some results on the average price development during the sample period. The substitution policy started on the 1st of March 2003. We connect this to the time point of 2003Q2 in the sample. Figure 1 depicts the cross section means of product DDD-prices with  2
2 standard errors during period of 1997Q1- 2007Q4. The substitution policy period is shown with yellow shading. The figure shows a clear downward trend in prices after the policy change in the second
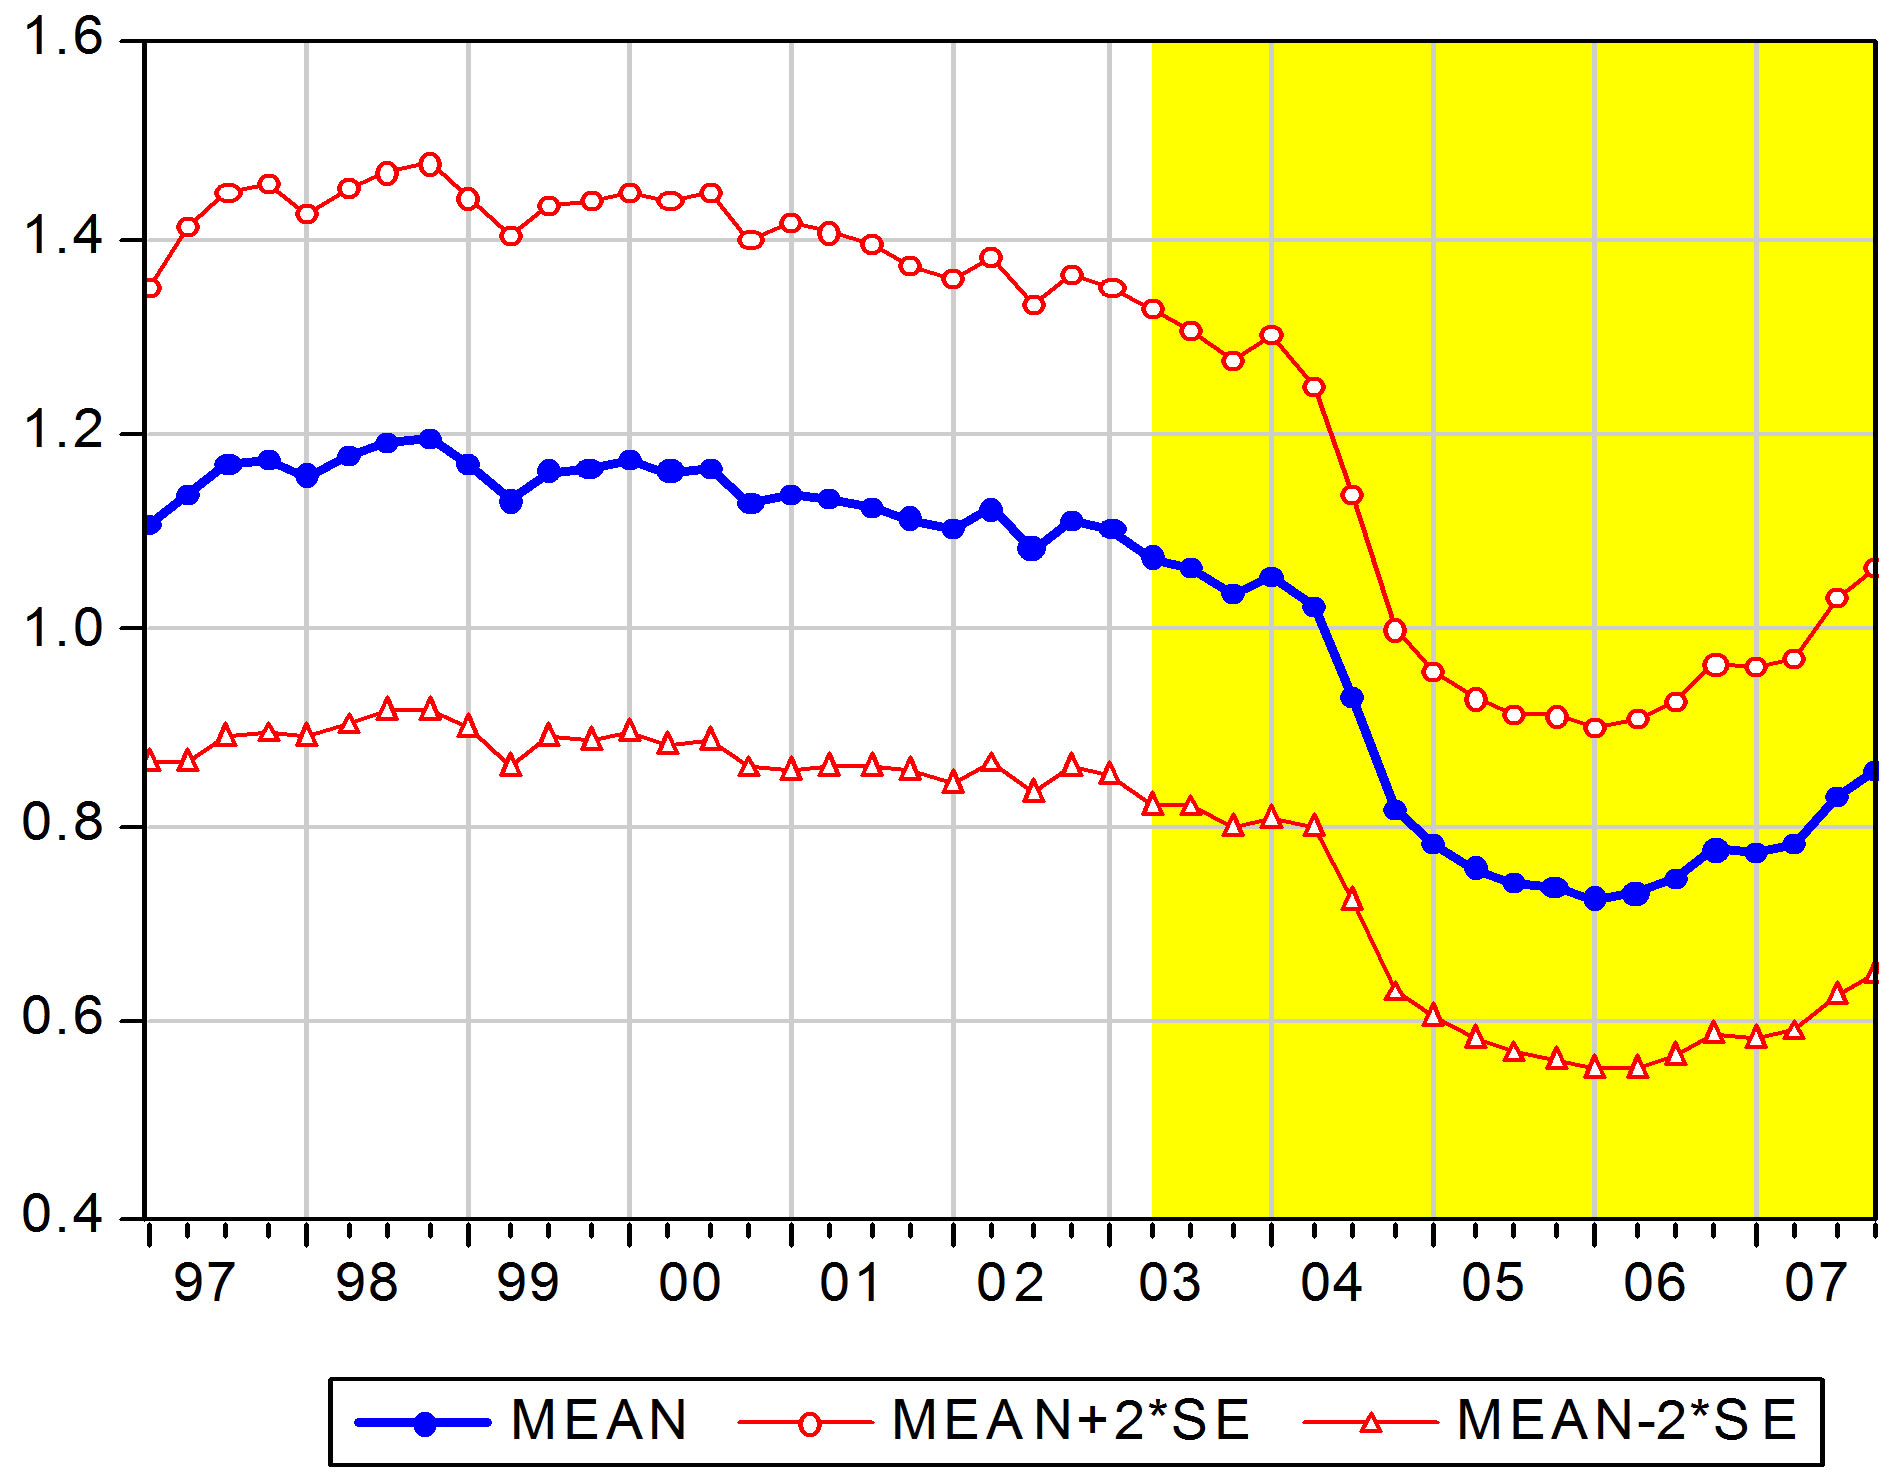
Figure 1. Mean DDD-adjusted package prices by time.
quarter of 2003.
4.2. Nominal and Package Sales
Figure 2 shows the total market nominal sales (PQ) and the number of sold packages (Q) of beta blockers in 1997Q1-2007Q4. We observe that total nominal sales are sensitive to price reductions observed in Figure 1. However, the quantity part of sales, the number of sold beta blocker packages, do not respond to the policy change. Note that if we transform the packages to corresponding number of sold pills the figure remains the same (not reported). Thus any package re-sizing in response to the policy change has not occurred.