Effect of Alumina Particles Addition on Physico-Mechanical Properties of AL-Matrix Composites ()
1. Introduction
In the last decades, there is an increasing trend towards using composite materials, in order to achieve better performance in engineering materials [1]. Applications of AL-based metal matrix composite continue to expand for structural applications. Particularly in aerospace and automotive industries, owing to their low density, high thermal conductivity, high specific strength, stiffness, and better wear resistance resulting in considerable economic advantages [2-9]. Aluminum alloy has disadvantages as low hardness and poor wear resistance which are the main obstacles for their high performance tribiological applications [10,11]. Addition of ceramic oxide such as alumina reinforcement into ductile matrix such as Al affects greatly on both mechanical and physical properties of the produced composite [12-18]. During the last decades, enormous researches focused on hard ceramic particulate, fiber and whiskers reinforced aluminum metal which causes a modification of strength, stiffness, hardness, wear and fatigue resistance specially at elevated temperature applications. Those particularly improves corrosion resistance of the material, compared with conventional aluminum alloy [19-22]. The aim of this study is how to obtain a composite material of AL matrix with a uniform distribution of ceramic particles. AL2O3 is the most popular ceramic oxide that can be used as reinforcement due to its high stability at elevated temperatures that prevents its reaction with AL matrix [1]. There are several methods for fabrication of the Metal-Matrix Composites including mechanical milling, vortex process and ultra sonic cavitations, but all of these techniques are expensive because they need more energy. Powder metallurgy is a good technique in producing MMCs. Its main advantage is the low processing temperature than the melting technique, so there is no interaction between the matrix and the reinforcement. Also high homogenization between the two phases is achieved [23]. Another advantage is the fabrication of a near net shape product with low cost [24]. In this research, mixing of AL powder and AL2O3 particles was achieved and a uniaxial pressed was used to produce the composite samples. Physico-mechanical properties of the produced composites were investigated.
2. Material and Experimental Procedures
2.1. Mixing, Cold Compaction and Sintering
In this research, AL powder with purity 99.99% and particle size 5 - 10 µm was used as a matrix and reinforced with 5, 10, and 15 wt% of AL2O3 with 10 µm particles size. Aluminum and alumina powders were investigated by SEM of model JEOL-JSM-4510, Development XRD diffractometer model Burcker D8 Advance with Ni filtered and Cu target in Central Metallurgical Research Institute (CMRDI) in Cairo. The powders were mixed with 0.5 wt% paraffin wax as a lubricant to reduce friction during compaction and liquid acetone was used as a process control agent, then dried at 80˚C for 30 min and cold compacted at room temperature in a uniaxial press at 1060 Mpa. The samples were sintered in a vacuum furnace at 600˚C for 1 hr and a heating rate of 10˚C/min.
2.2. Composite Characterization
Relative densities of the sintered samples were measured using Archimedes method using water as a floating liquid according to MPIF standard 42, 1998, in which the sintered specimen was weighed in air and in distilled water then the density (D) was calculated according to the following equation:
 g/cm3 (1)
WhereWa and Ww are the masses of the sample in air and water respectively. The theoretical densities (Dth) for the investigated materials were calculated according to the following equation:
 g/cm3 (2)
Where,
 is the volume fraction of alumina reinforcement,
 is the density of AL2O3 equal 3.95 g/cm3VAL and DAL are the volume fraction and density of the AL powder respectively. The degree of porosity of the sintered compacts was calculated according to the following equation:
 (3)
(3)
WhereDth is the theoretical density of the sintered sample and Do is the actual density. Microstructure investigation was performed using both optical and scanning electron microscope using a JEOL JSM 5410-microscope. The diffraction patterns of the sintered samples were achieve by x-ray diffraction analysis using x-ray diffractometer model x, pert PRO PANalytical with Cu kα radiation (λ = 0.15406 nm) The electrical resistivity of the sintered materials was measured using the four-probe method using Omega CL1084 multimeter device, where the outermost two contacts were for passing D.C. current & the inner two contacts were for measuring the potential difference.
A fixed DC current of one ampere was passed through the sample via two crocodile clips. For each test the multimeter was zeroed with no current passing the specimen, and then the measurement was carried out. The resistively (ρ) was calculated according to the following equation:
 (4)
(4)
WhereR is the resistance in mΩ, L is the measured length in cm and A is the cross section area in cm2. The thermal conductivity of the composites was derived from the Wiedemann-Franz Law, which links the thermal conductivity to the electrical conductivity according to the following equation:
 (5)
(5)
WhereK is the thermal conductivity in W/mK, T is the absolute temperature in K, σ is the electrical conductivity in Ω−1∙m−1, and L is the Lorenz number, equal to 2.45 × 10⁻⁸ WΩ/K2. Electrical conductivities of the polished samples were determined from the electrical resistivity measurements. The size of the samples used for testing is 32 mm × 11 mm × 4 mm size. The electrical resistivity measured using Omega micro-ohmmeter in the two-probe mode. Vickers micro hardness was measured as the average of 5 readings along the cross section surface of the specimen using Vickers hardness tester by applying 4.9 N load and load time 10 sec. Compression strength test of investigated samples was also measured using uniaxial SHIMADZU universal testing machine UH-F500KN. The applied cross-head speed of universal test machine used in this study is 2 mm/min. The test was conducted at room temperature (25˚C).
3. Results and Discussion
3.1. Powder Characterization
(Figures 1(a) and (b)), show the experimental results of the XRD pattern of pure AL and AL2O3 powders respectively, which indicate the appearance of AL and AL2O3 peaks with high intensity that indicates the purity of the raw materials. (Figures 2(a) and (b)), show that the particle diameter of AL and AL2O3 was 5 - 10, and 10 μm respectively.
3.2. Composite Characterization
3.2.1. X-Ray Diffraction Analysis
X-ray diffraction was performed to determine the phase


Figure 1. XRD pattern of: (a) AL and (b) AL2O3.
structure of the composites. Figure 3 show the XRD pattern of 5, 10 and 15 wt% AL2O3.
It can be seen that the sintering process did not produce any new phases rather than face centered cubic structure with space group Fm-3m, a = 0.40494 for AL and corundum hexagonal bravais lattice, space group R3m, a = b = (3.079) and c = (67.996 nm) for AL2O3 this means that the phases indicated by XRD analysis were similar for the three composites. The XRD pattern indicated that as the AL2O3 percent increases the intensities of the peaks that belongs to AL2O3 was increased and that of AL was slightly decreased. So from XRD charts there is no solid state reaction between Al and AL2O3 during the sintering process.
3.2.2. Density
Relative density of the composite is the ratio of the measured sintered density to the theoretical one. It was determined for pure Al and AL-AL2O3 composites. The values of the relative density of 5, 10 & 15 wt% AL-


Figure 2. SEM Micrographs of: (a) AL and (b) AL2O3 powder.
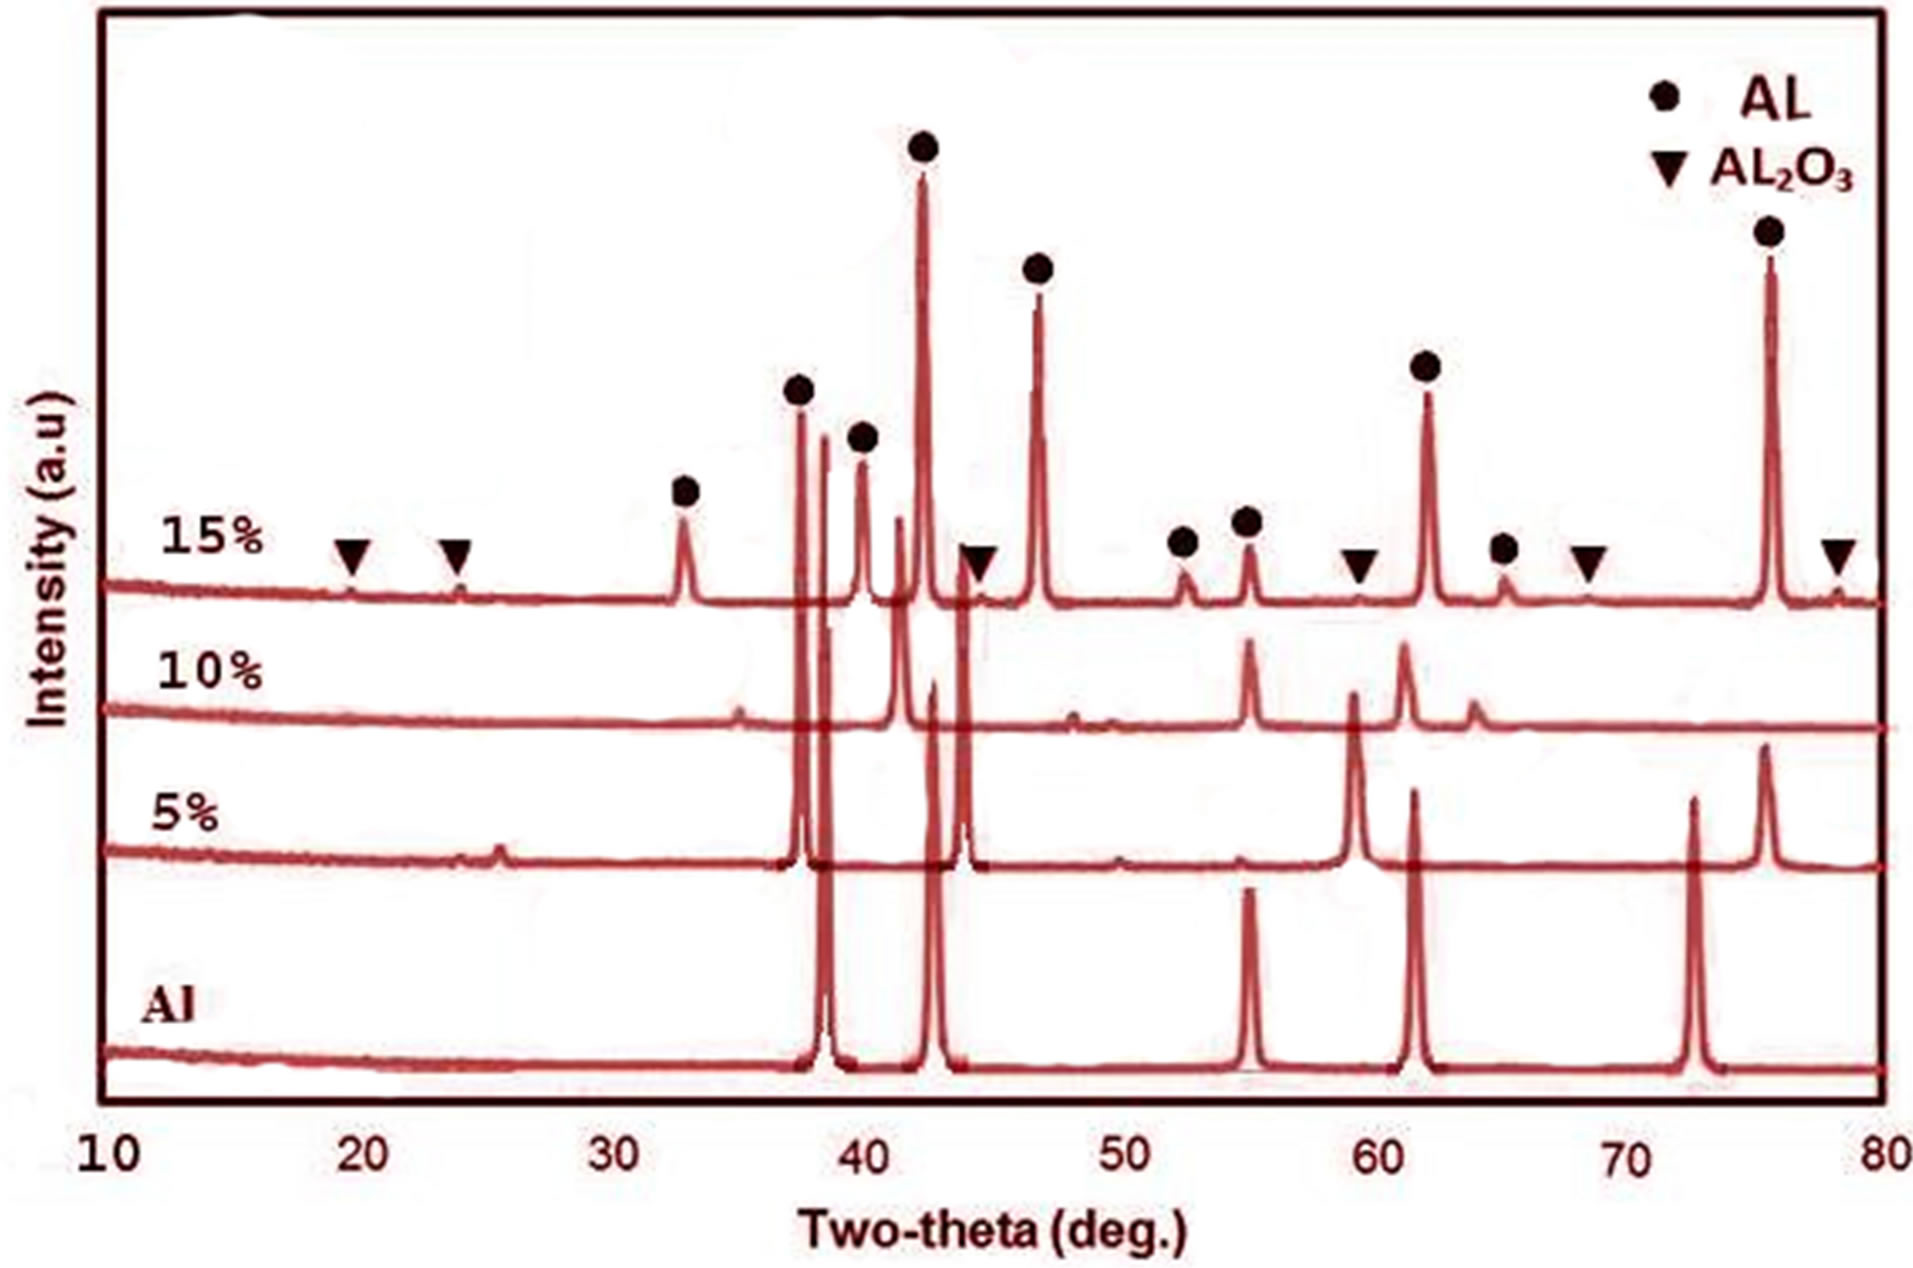
Figure 3. XRD pattern of pure Al & 5, 10 & 15 wt% ALAL2O3 composite.
AL2O3 composites are shown in Table 1. This Table shows that the theoretical density increases by increasing the AL2O3 percent.
This can be attributed to the higher density of AL2O3 more than Al. Figure 4 indicates the experimental results for studying the relation between the relative density and alumina content. From this figure, the bulk density of 5 wt% AL2O3 was about 96.5% which is near fully density. This may be rationalized by the near ratio between the volume fraction of 5 wt% AL2O3 and that of 95% AL. By increasing the AL2O3 percent the density decreases, this is due to the higher hardness of AL2O3 than that of AL. It acts as a barrier network against consolidation that prevents the densification of the particles. Also increasing the AL2O3 percent leads to more contact between ALAL2O3 particles and so more intensive form appear [25]. The experimental results for investigating the relation between porosity and alumina content are shown in Figure 5. From this figure, the porosity of AL-AL2O3 composites where 5 wt% AL2O3 recorded 3.5% this mean that this sample is near full dense with higher density compared with the other samples.

Table 1. Relative density of 5, 10 & 15 wt% AL-AL2O3 composites.

Figure 4. Relative densities of AL-AL2O3 composites.

Figure 5. Porosity percent of AL-AL2O3 composites.
3.2.3. Microstructure of the Sintered Samples
In order to study the micro structure changes of AL matrix by mixing with AL2O3 particles, both optical and scanning electron microscopes (SEM) were used. Figures 6(a)-(c) show the optical micrographs of AL-AL2O3 sintered samples with 200× magnification.
Alumina particles are homogenously distributed all over the Al matrix. This may be due to the suitable mixing technique, time of mixing, compaction and suitable sintering temperature. SEM micrographs of pure Al & AL-AL2O3 samples were shown in Figures 7(a)-(d), with high magnifications and EDAX analysis for 10 wt% AL2O3.


Figure 6. Optical micrographs of: (a) AL-5 wt% AL2O3; (b) AL-10 wt% AL2O3; and (c) AL-15 wt% AL2O3.
It was observed that the spectrum of 10 wt% AL2O3 shows the presence of AL and oxygen elements which indicates that AL2O3 particles are dispersed into AL matrix with no other contamination. Both optical and SEM micrographs shows the homogeneous dispersion of AL2O3 in the AL matrix for the three AL-AL2O3 composites. The micrographs contains three phases one of them is the gray matrix which is the AL matrix and the dispersed phase is the white spots which represents the AL2O3 particles and the third phase is the black spots that is the pores in the sintered samples which was performed by EDAX. Addition of more AL2O3 than 5 wt% causes the increasing of the internal porosity. This can be attributed to the poor wettability between the AL matrix and AL2O3 which causes aggregation of AL2O3 particles that distinct obstructed densification creating gaps that prevents the complete densification of the particles. The increasing of porosities is dark point which affects greatly on the mechanical properties such as hardness & compression.
3.2.4. Electrical Resistivity Measurement
In this investigation, the electric resistance of the investigated samples was measured and converted to the electrical conductivity according to the ASTM standard B193- 72. Figure 8 and Table 2 show that the electrical resistivity increases by increasing the AL2O3 percent.
This is according to the lower conductivity value of AL2O3 more than that of AL that restricts the motion of the electrons which are responsible for the conductivity. Also the high porosity of the higher AL2O3 percent samples resulted from the weak bond and non-wettability between AL and AL2O3 creates voids that decrease the motilities of the free electrons causing a high resistivity [26].
3.2.5. Thermal Conductivity Measurement
Thermal conductivity is affected by many factors those are the conductivities of the constituents, reinforcement distribution, the volume fractions, shape & size of the components, the interaction between the two phases and the method of preparation. The experimental results for investigating the relation between thermal conductivity and alumina content are shown in Figure 9. From this figure, the thermal conductivity of the composite decreases by increasing the AL2O3 percent. Also thermal conductivity is directly affected by the porosity, since the conductivity of a pore is zero so by increasing the AL2O3 content the pores increases and the thermal conductivity decreases. The relation between porosity and thermal conductivity is given by the following equation [27].
 (6)
(6)
Wherek is the thermal conductivity (w/mk)KS is the intrinsic thermal conductivity, and

Figure 8. Electrical conductivity of pure AL & 5, 10, and 15 wt% AL2O3 composites.

Table 2. Electrical conductivity values for pure Al & 5, 10 and 15 wt% AL2O3.
F is the fractional porosity. Also the nature of the ceramic AL2O3 particles that distort the structure forms barrier for the electrons which are responsible for thermal conductivities [28]. The values of Thermal conductivity for pure Al & 5, 10 and 15 wt% AL2O3 are shown in Table 3.
3.2.6. Hardness Measurements
Micro hardness of Al-AL2O3 composites were shown in Figure 10 from this figure, it was clear that 5% AL2O3 sample has the highest hardness due to the strengthening effect of the hard AL2O3 oxide ceramic, also the higher density and lower porosity of this sample. The presence of pores has a negative effect on the hardness. As the porosity of the samples increases by increasing alumina content the hardness decreases.
3.2.7. Compression Test Measurement
Figure 11 shows the results of compressive strength, from this figure it was evident that 5 wt% Al2O3 sample has the highest compressive strength value more than that of 10 & 15 wt% Al2O3. This can be rationalized by the lower porosity of this sample than the other ones, in