Design of a Concentration Sensor Based on Photonic Crystal Fiber Placed between Two Single Mode Fibers ()
1. Introduction
Sensors based on photonic crystal structure (PCS) are gaining interest during last decade. The reason for this increasing demand of research in this area is due to flexibility of PCS in tailoring different optical properties as per the requirements. Two dimensional photonic crystal structures have been extensively studied for their possible use in different sensing applications [1,2]. Many researchers have investigated PCS application in sensing such as temperature, strain, corrosion, etc. To accompany the wide use of PCS as the sensing element, recently photonic crystal fiber (PCF) has also attracted great interest.
In this paper, we propose a novel concentration sensor based on photonic crystal fiber (PCF). The sensors based on PCS have limitation in fixing. For this purpose the PCS-2D is firmly placed between two glass slides [3-5], before the incident signal is allowed to pass through it. But, in this proposed mechanism, the PCS is replaced by PCF and is placed between two single mode fibers. This solves two problems. First, extra coupling needed from source to the sample is avoided; second as no extra glass slides are used, transmission efficiency in this case would be better than previous method [3].
This paper is organized as follows. In Section 2, FDTD simulation is described. Design of the structure is presented in Section 3, followed by numerically experimental analysis of the sensor system in Section 4. And finally, conclusion is given in Section 5.
2. FDTD Simulation
We have employed FDTD solution from Lumerical to simulate light propagation through a combination of three different dielectric layers with the use of Gaussian source using Phase Match Layer (PML) boundary condition. Due to the constraint in memory only 1 µm of dielectric layer is considered for this simulation. However with the increase in memory the dimension can be extended to few centimeter.
3. Design
The cross sections of photonic crystal fiber (PCF) and single mode fiber (SMF), taken for our investigation are shown in Figures 1 and 2 respectively. A space is formed initially in between two SMF of length 1 μm each. Then PCF of 1 μm length with the fluid injected in to the holes is placed in the gap. Care must be taken to ensure that no air gap is left in between SMF and PCF interfaces. The proposed design of sensor is shown in Figure 3.
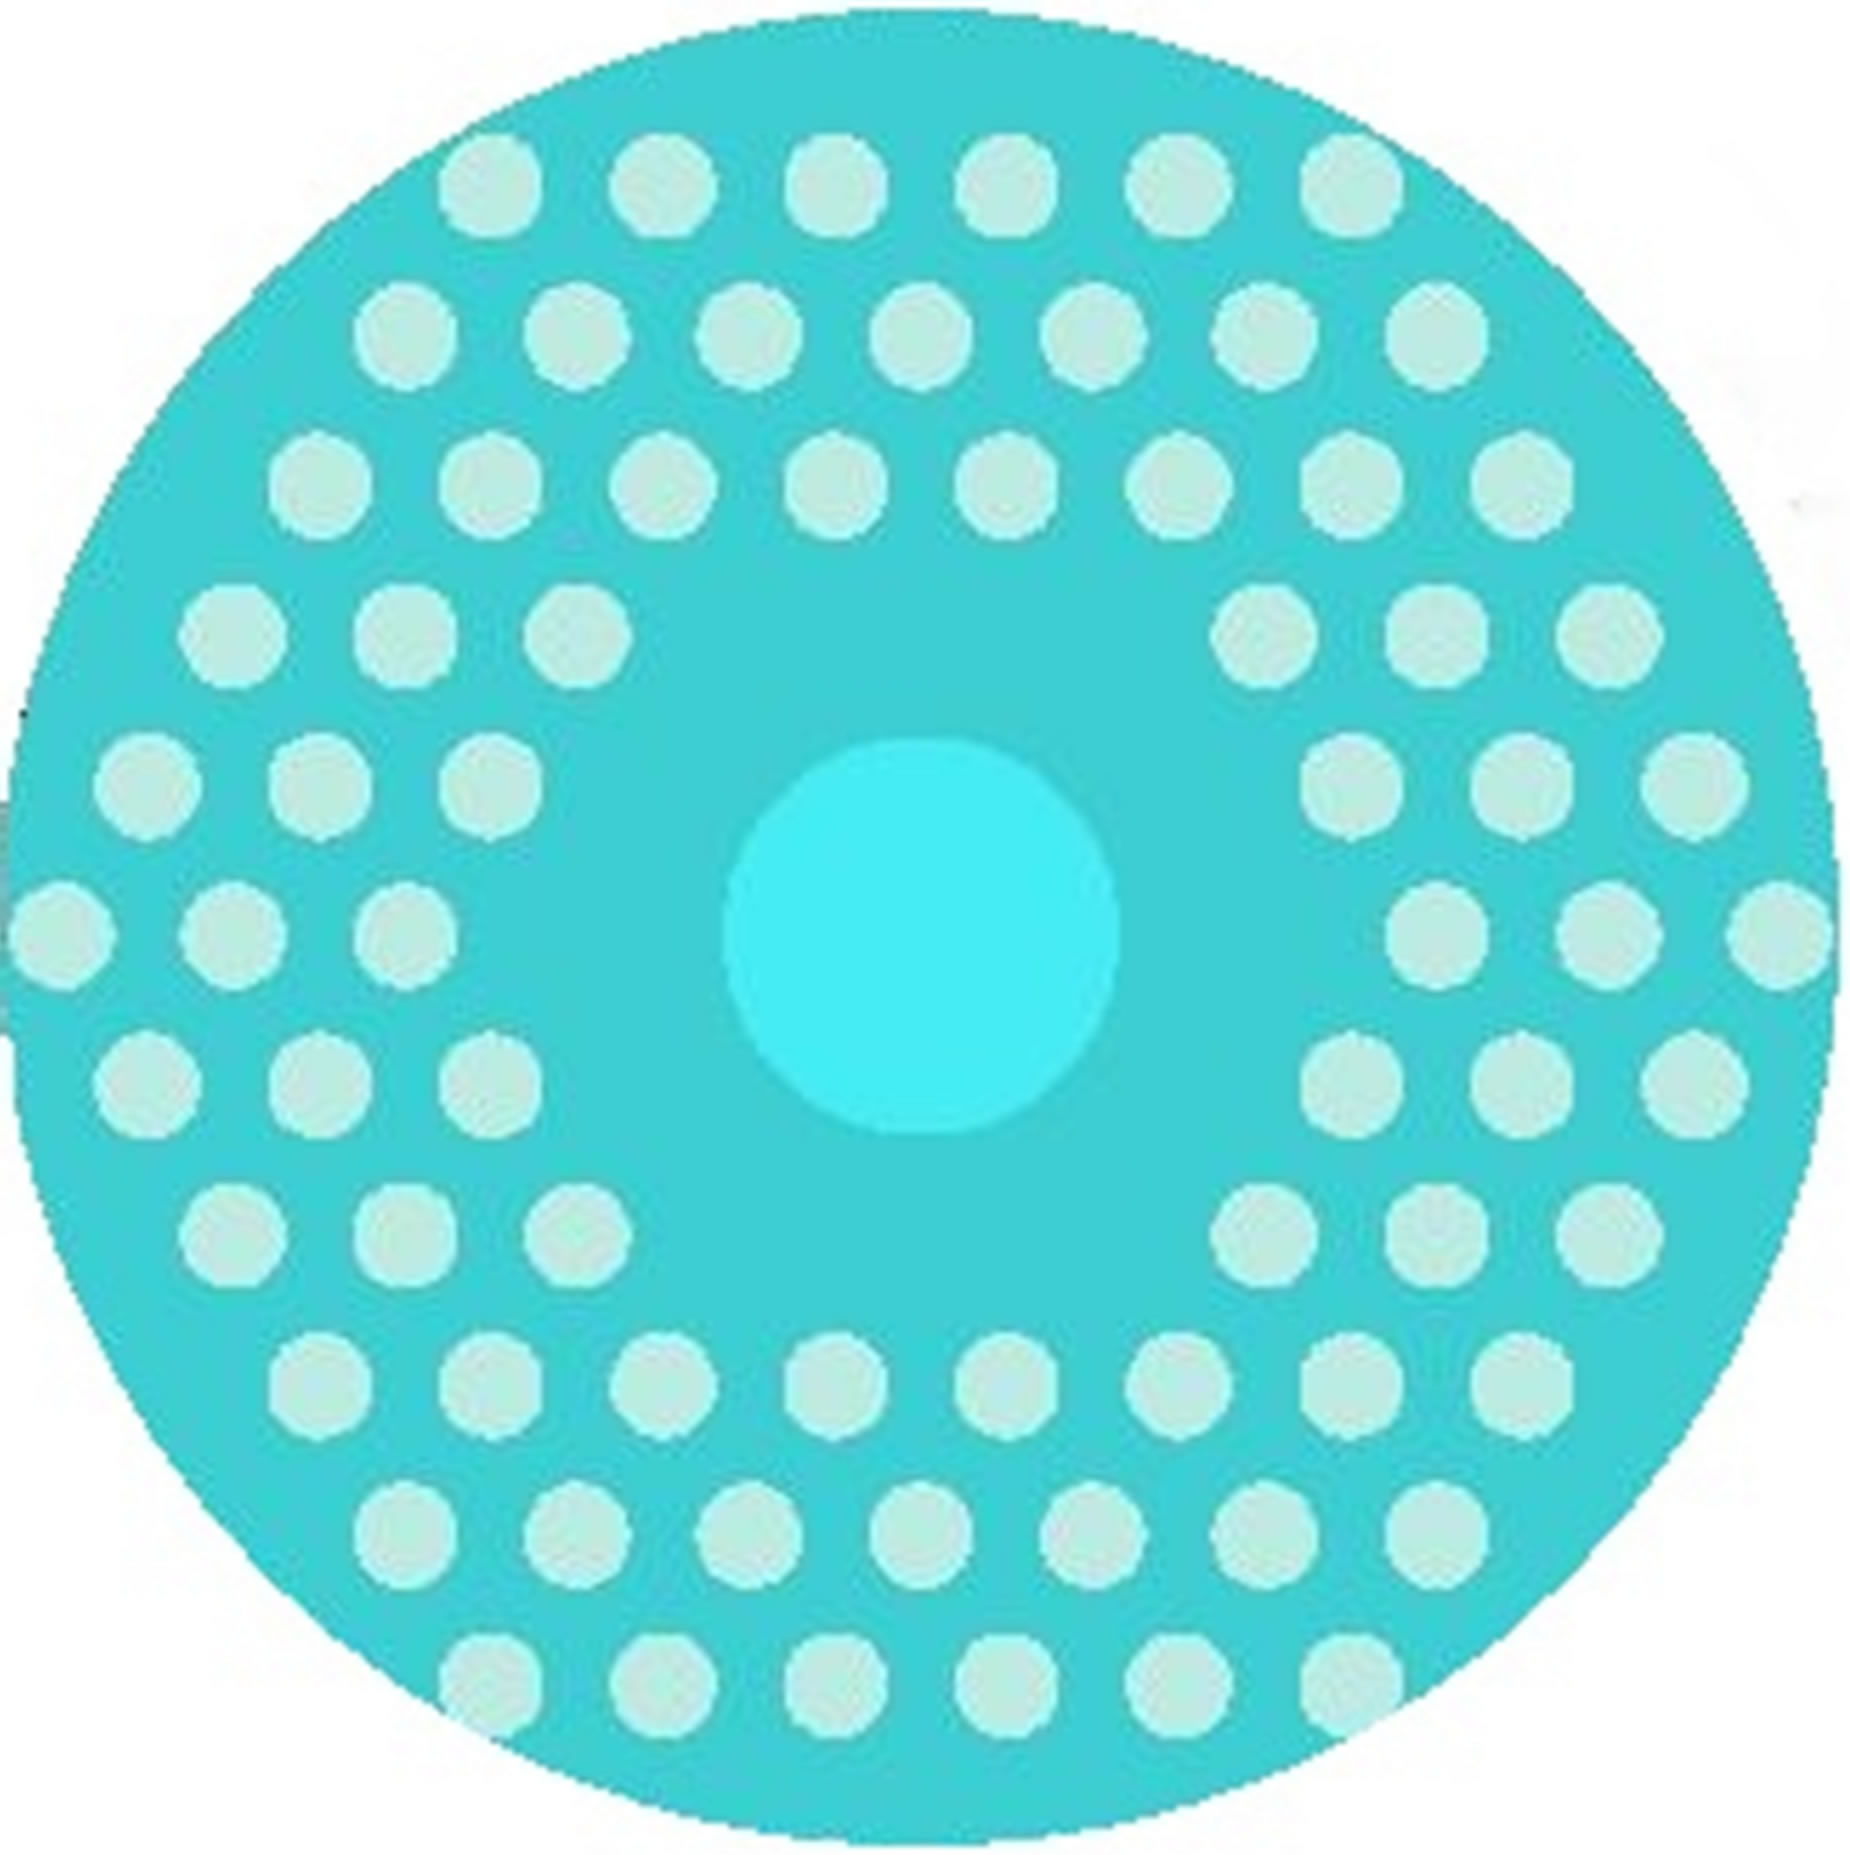
Figure 1. Cross section of photonic crystal fiber, with hexagonal lattice of constant a = 0.13 μm , radius of air hole = 0.04 μm and core radius r = 0.15 μm.

Figure 2. Cross section of single mode conventional Fiber with core and cladding radius r = 0.15 μm and r = 0.7 μm. Refractive Index of the core and cladding are 1.45 and 1.43 respectively.
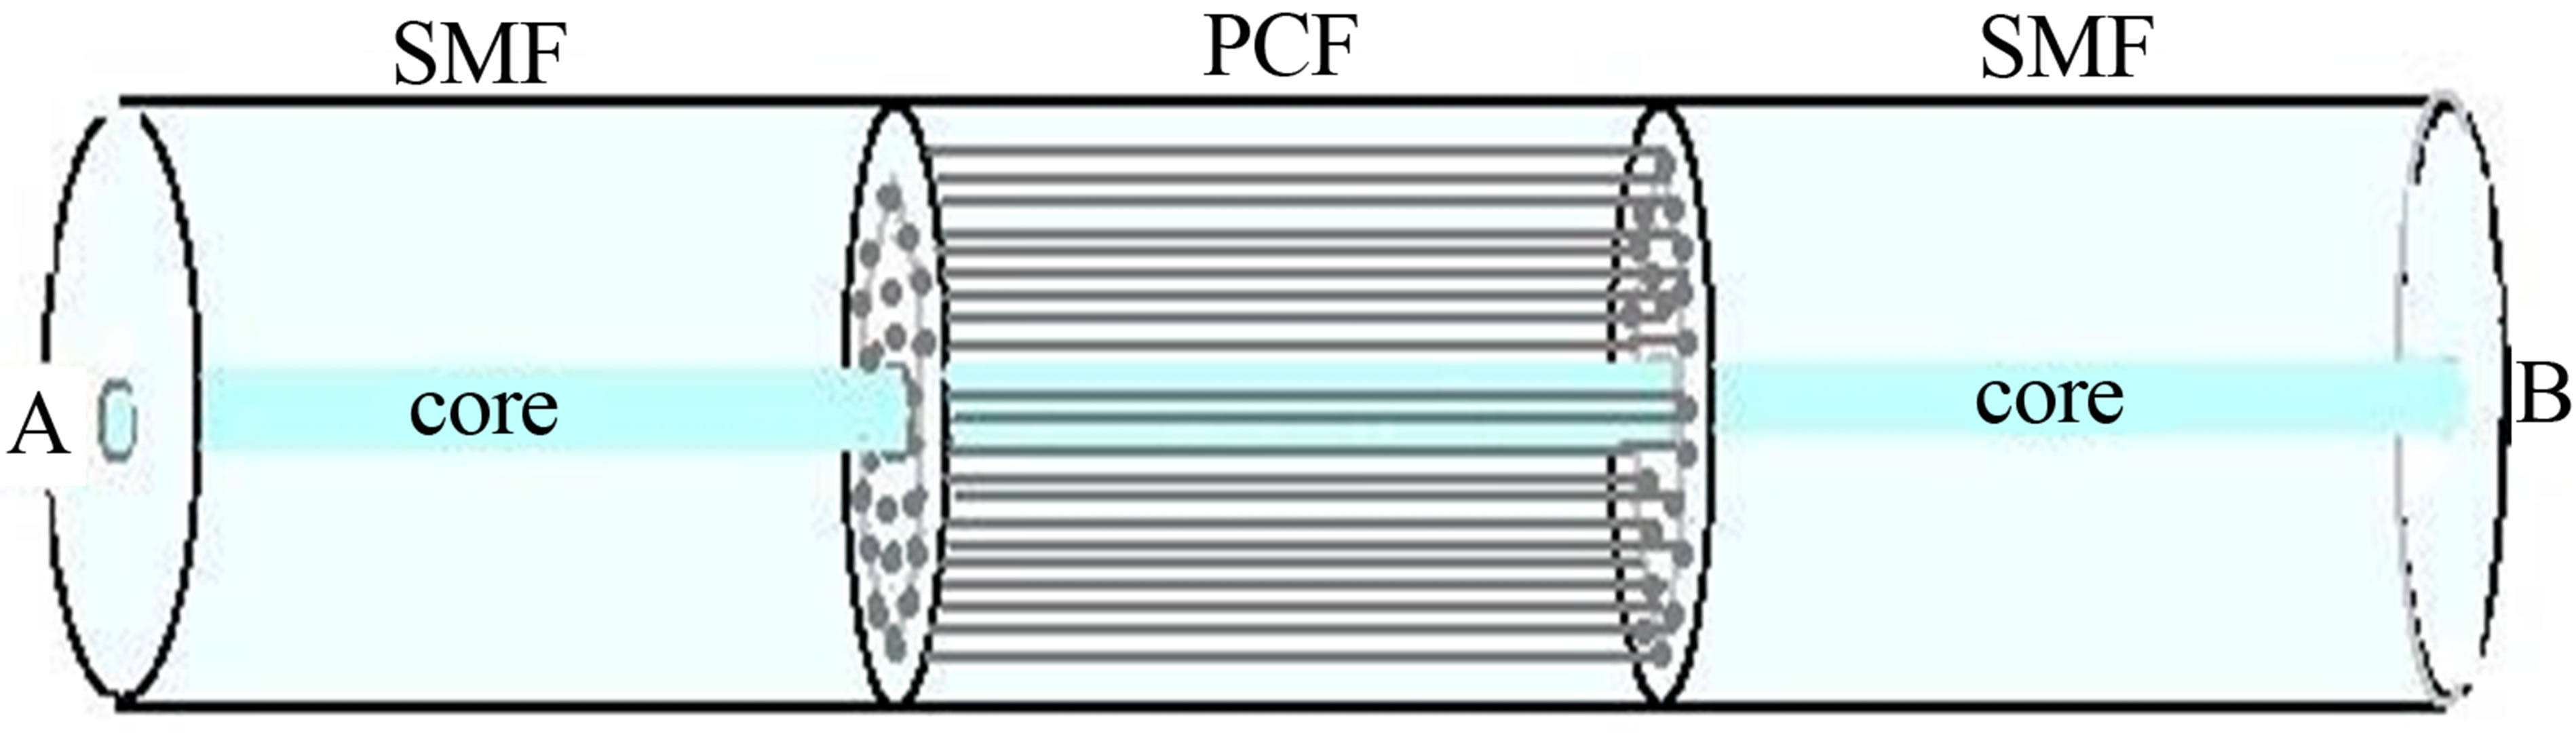
Figure 3. Proposed design of the sensor. A is the input where the signal is fed into and B is the output where the signal is analyzed.
4. Numerical Simulation and Analysis
To simulate the field intensity for a given concentration fluid filled in PCF, across the output B for given input at A, we use the data from reference [3] shown in Table 1. For a given refractive index at the holes of PCF, FDTD simulation is used to get the field distribution at the output (at B). The simulated field for one such concentration is shown in the inset of Figure 4. The wavelength of the signal is maintained at the third window i.e., 1550 nm. As expected the distribution at the output is somewhat similar to the input, but as the concentration and hence the refractive index is changed, the field at the end face of output also changes. The results of this simulation are shown in Figure 4, where the variation of the electric field along the cross section of fiber is shown. The variation of electric field intensity with the change of dielectric constant can be explained as follows: when the refractive index of the fluid filling the air gap in PCF changes, photonic band gap of the structure also changes. Power transmitted along PCF depends on this photonic band gap. Thus there is a variation of transmitted electric field with the change of refractive index. But, for sensing application this change of electric field should be linear. To examine this we plot a graph between refractive index and corresponding field at the axis across the output B as in Figure 5. The perfect linear variation shows that concentration can be measured more accurately using this principle.
One of the disadvantages of this method is the small dimension of PCF. It is worth mentioning that the investigation can’t be done here for larger dimension due to our computational limitations. However, this can be extended for long length PCF, using improved computational facilities.
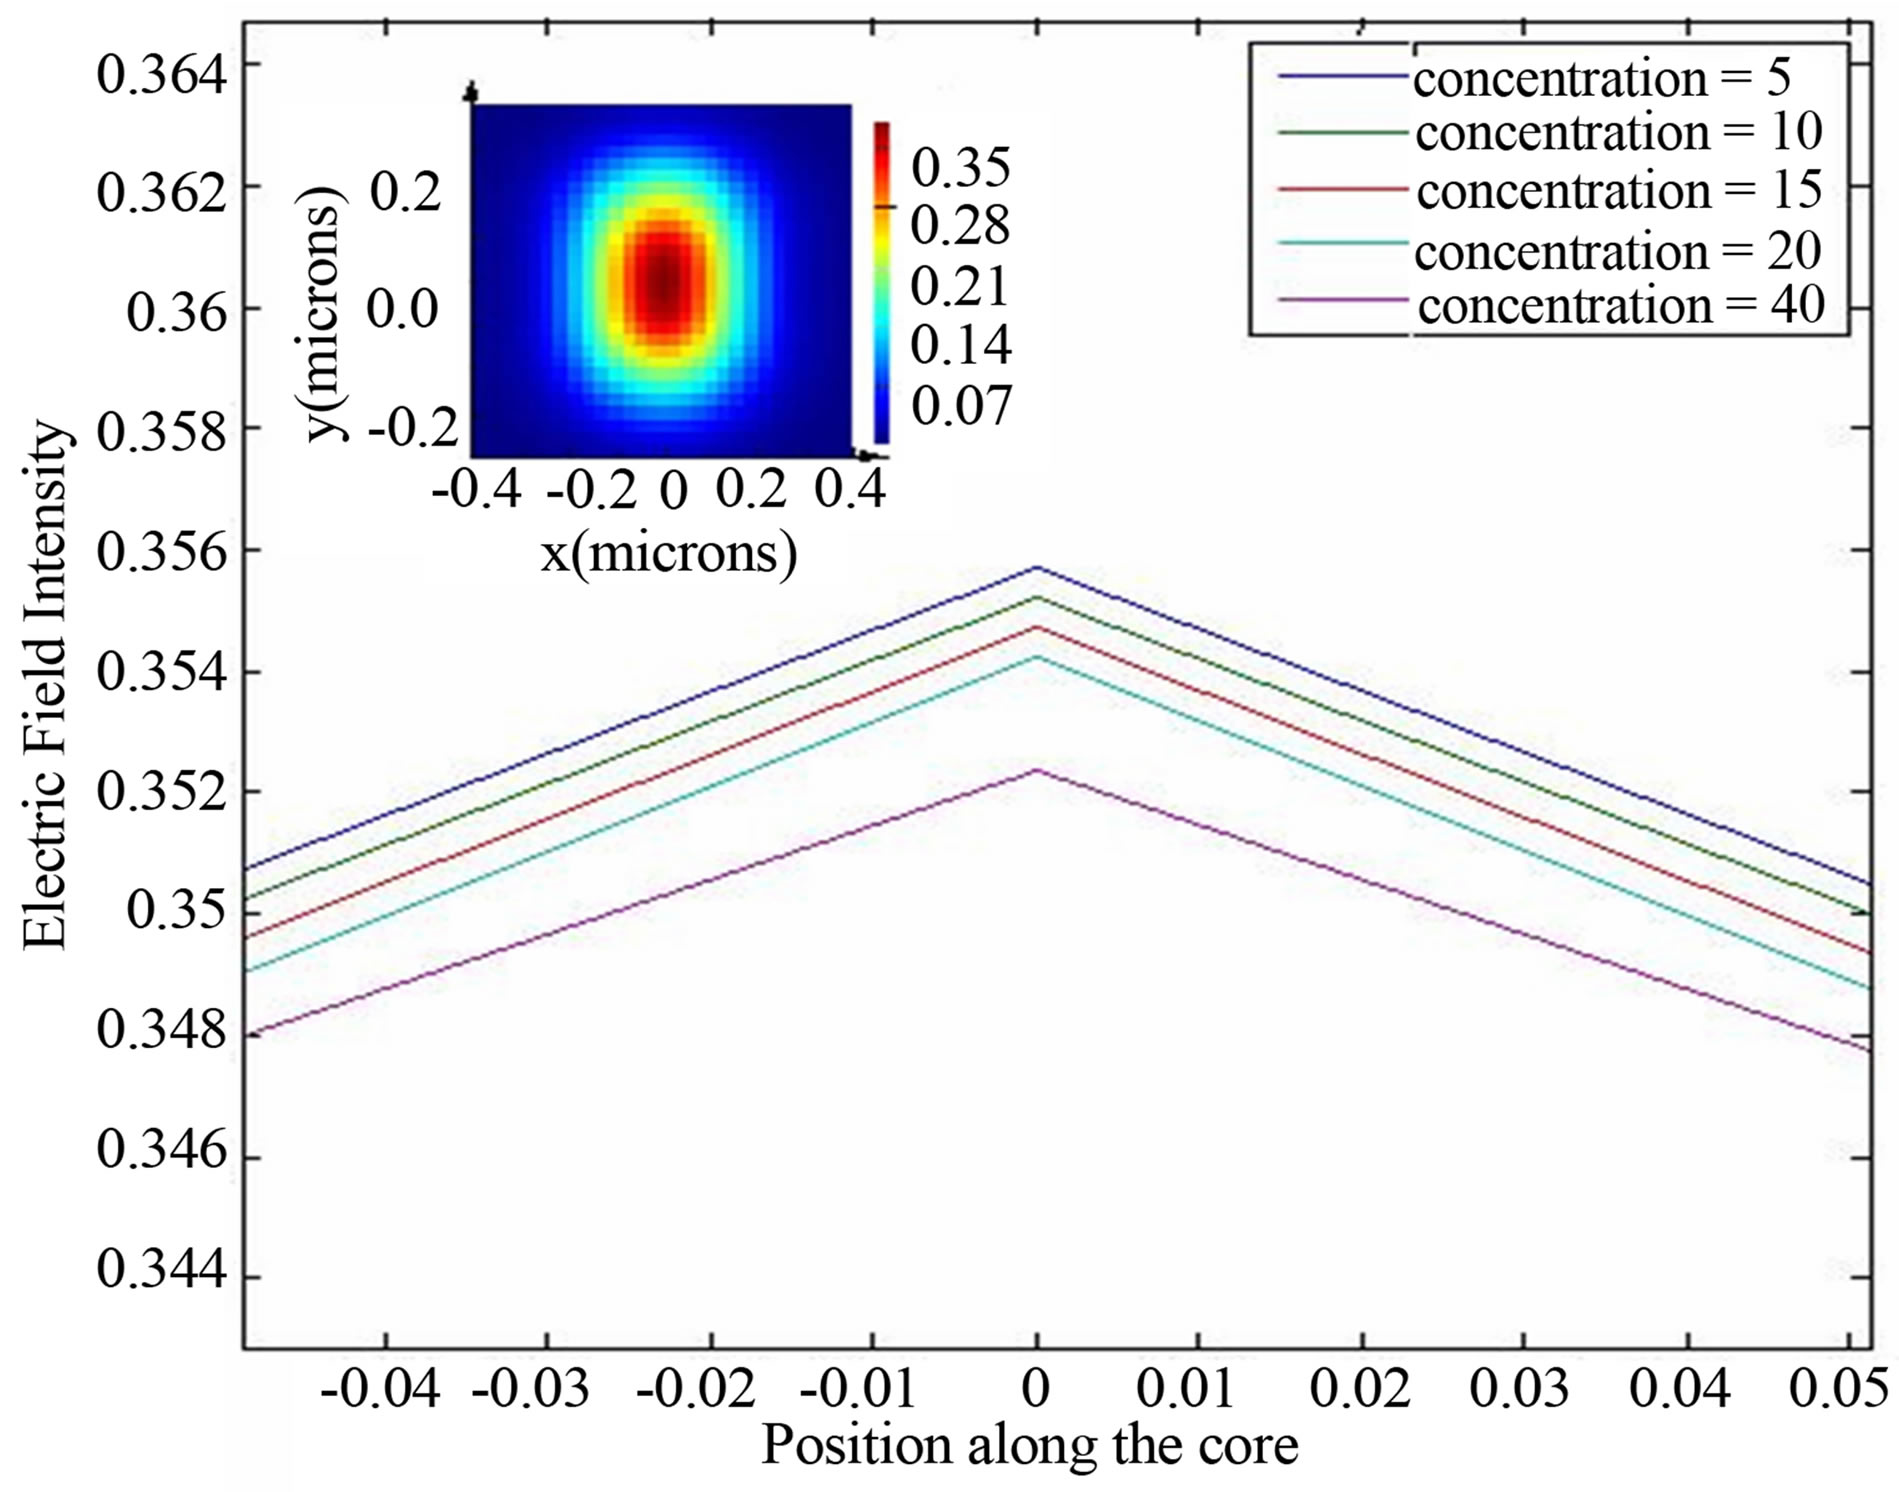
Figure 4. Electric field variation due to different concentration in the air holes of PCF. Inset shows electric field distribution obtained in position B of the fiber for 15 g/ml concentration.
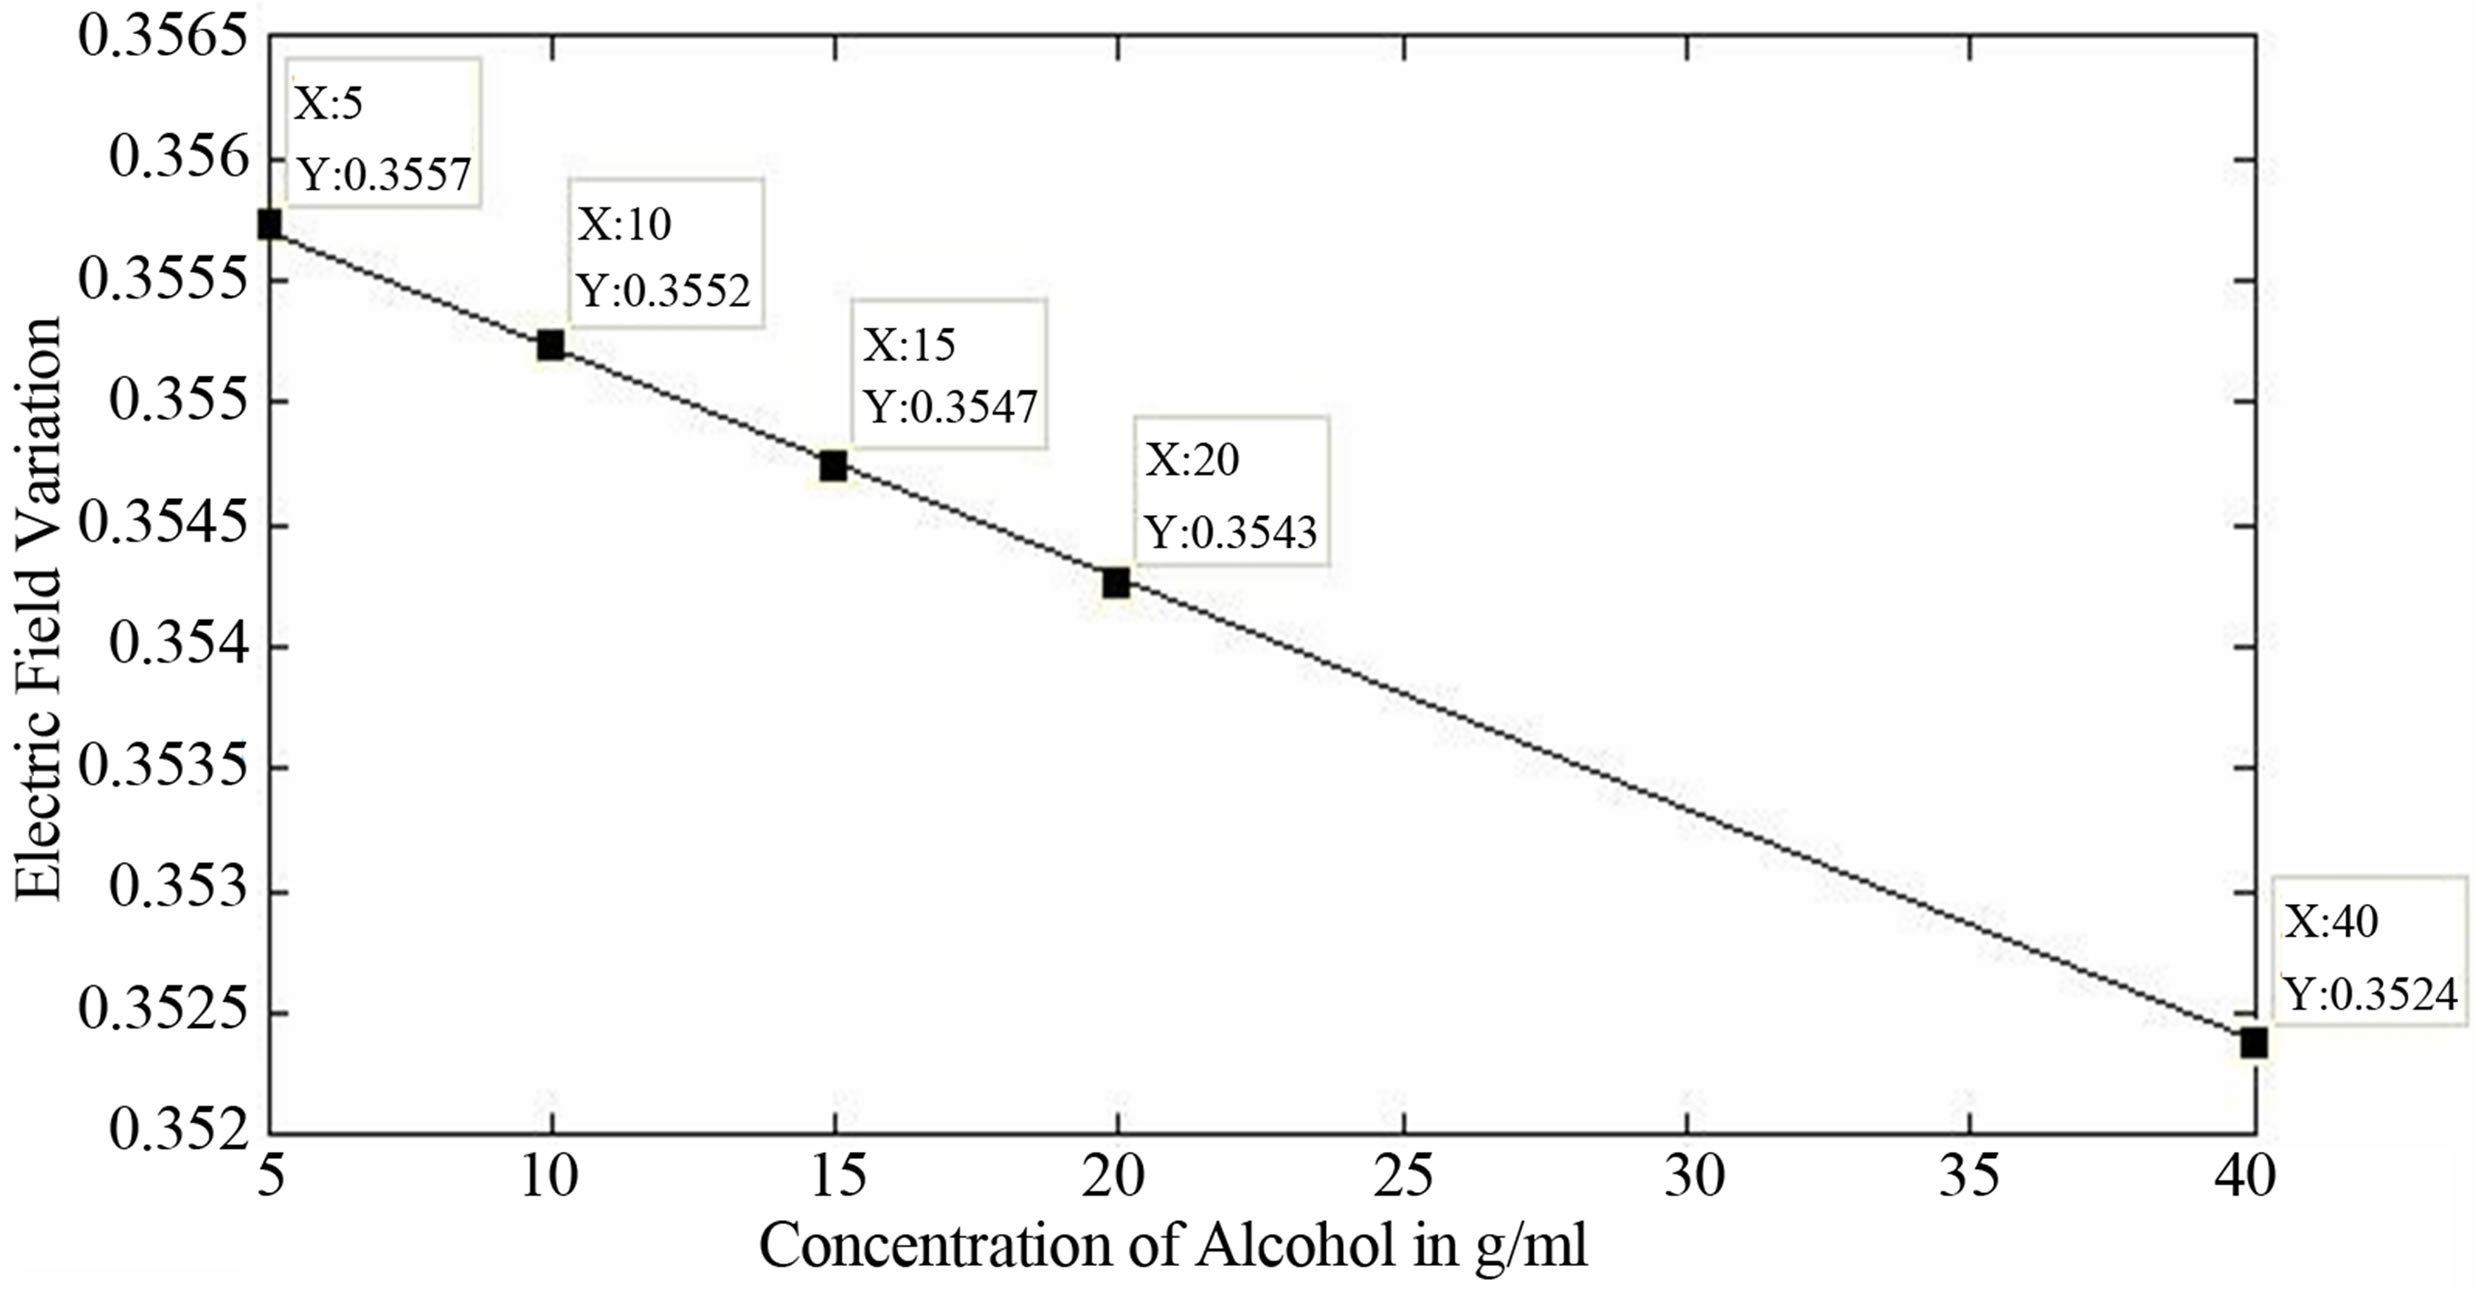
Figure 5. Plot of electric field versus concentration at the end B of fiber.
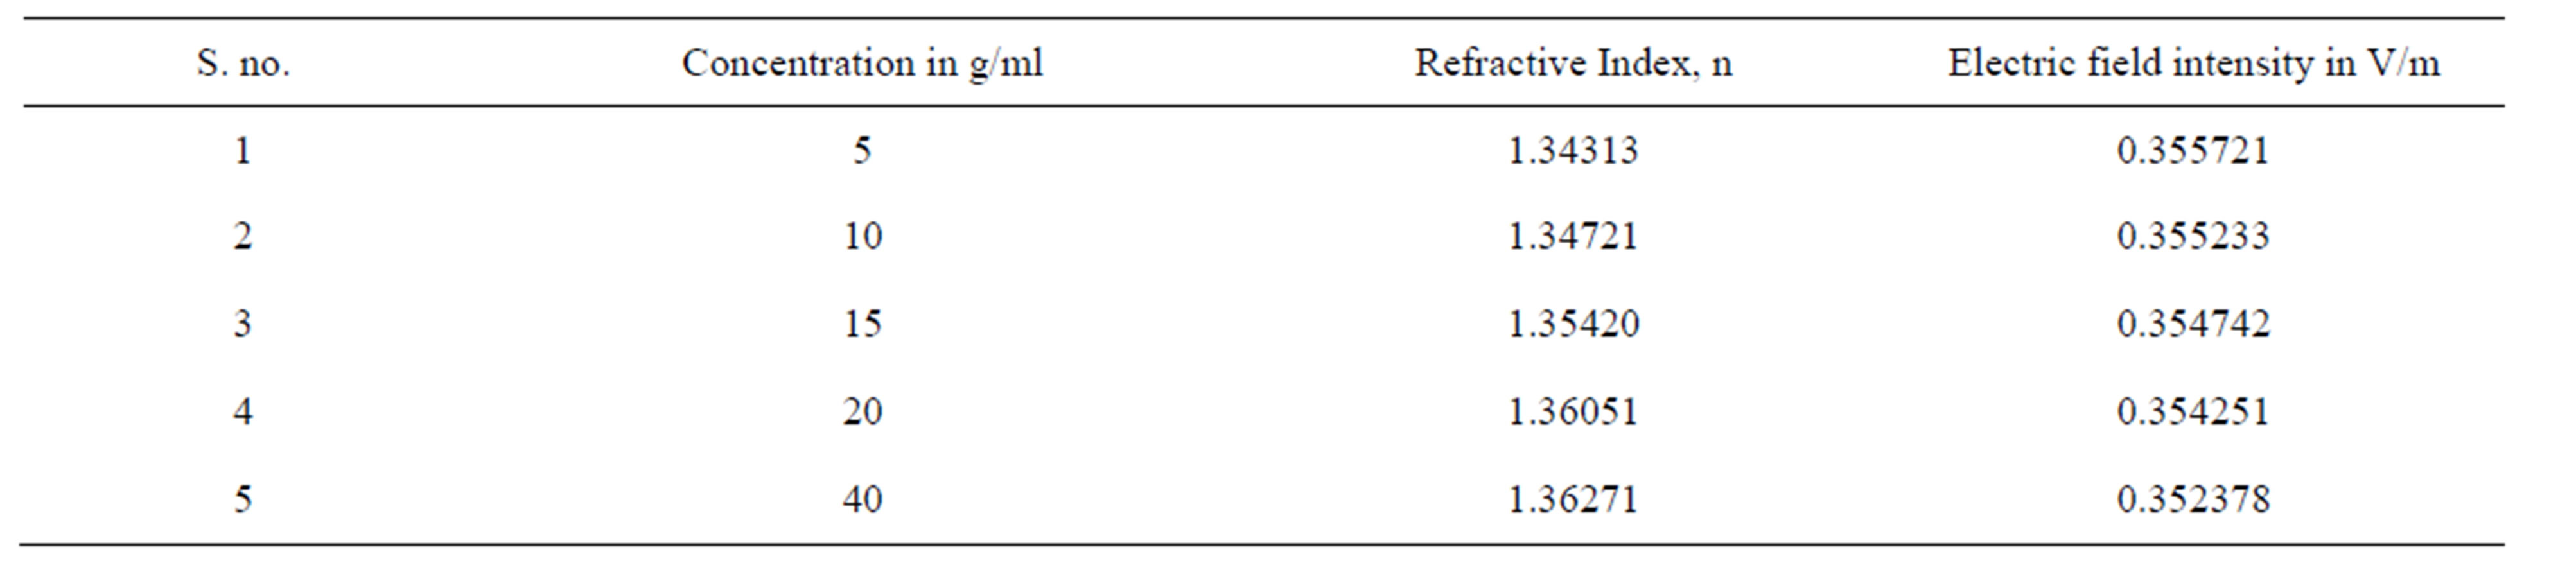
Table 1. Variation of electric field intensity with change in concentration of alcohol.
5. Conclusion
We demonstrate the use of short length PCF placed between two SMF for measuring concentration using FDTD method. It is found that a combination of SMFPCF-SMF system really can be used as a better sensing device owing to its perfect linear variation of electric field with concentration.
NOTES