Growth and Competitiveness of Non-Traditional Agricultural Exports in Zambia ()
1. Introduction
Like many African countries’ economies, Zambia’s economy has continued to be predominantly agriculture based. According to the country’s Central Statistical Office [1], of the 56 percent who live in the rural areas [2], 97.4 percent are directly engaged in agriculture for their livelihood1. With unemployment at about 50 percent, agriculture is the only potential source of income within the informal sector employing about 85 percent of the 3.4 million people in the labour force [3]. The sector mainly consists of smallholder farmers who make up about 52 percent of the country’s farmers and contribute about 80 percent of the nation’s staple food, maize [4-6].
However, despite their aggregate contribution to the nation’s staple food supply and gross domestic product (GDP), smallholder farmers still account for over a third of the nation’s hungry and poor [7]. Several factors have been cited for the low welfare levels among smallholder farmers including concentration on low-market value staples, low education levels, low productivity, poor health conditions, lack of market access and credit facilities, poor infrastructure and lack of productive assets [5,8,9]. Nevertheless, evidence has shown that those who produce high-value export commodities earn relatively higher incomes than their counterparts who mainly produce cereals [10,11]. For instance, although Zambia’s total agricultural production largely consists of cereals, high value agricultural exports make a significant contribution of 40 percent annually to total agricultural output [12]. In addition, [13] reveal that despite the overconcentration on cereal production, high-value fresh produce accounts for about 39 percent of total household income among producing households. The sub-sector has also been characterized by a steady growth over the past two decades, mainly in response to the government’s significant support and private investment. In 2006, non-traditional agricultural exports increased by about 25 percent over the previous year, recording earnings of more than USD 650 million [10].
Zambia’s non-traditional exports have included sugar, cotton lint, horticulture, soya beans and other primary agricultural produce with textile, engineering products, cement and handcrafts being the other products [14]. Other significant export products are fertilizers, hydrated lime, coal, tea, maize, skin leather, asbestos pipes/sheets, groundnuts, mushrooms, fresh eggs and day old chicks, paper, aluminium wires and cables, sorghum, clothing and blankets [11,15]. Of the agricultural commodities, export horticulture, consisting mainly of cut flowers and fresh vegetables, earned the highest foreign exchange over the period 1990-2010 [13]. However, unlike other agricultural exports, export horticulture has declined sharply after reaching the peak in 2006, exhibiting high volatility in both production and export volumes [11,16]. [16] reveal that the share of export horticulture to total non-traditional exports has declined from 11.1 percent in 2003 to about 1.2 percent in 2009 representing a 64 percent (USD 29 million) reduction in the industry’s income. This identifies the need to understand the major determinants of the industry’s growth and contribution to the nation’s export earnings.
A number of studies have considered the impact of export horticulture on poverty in Africa. A national survey by [7] in Zambia has shown that smallholders who produce fresh produce are more likely to move out of poverty compared to their counterparts who mostly produce cereals. The study found farmers who sold horticultural products earning annual mean per capita incomes of USD 183 compared to USD 139 for non-sellers. Similarly, [17] in Kenya found that households involved in export horticulture were better off, particularly in rural areas. They further contend that enabling more households to participate in the sector could reduce poverty substantially. A similar result was found by [18] in Senegal, who also argued that the sub-sector could cut regional poverty by 12 percent and extreme poverty by half. Furthermore, since the industry is highly labour intensive, horticulture production has been proposed as a pro-poor development strategy in many African countries [19]. In Zambia, the sub-sector is believed to be among the government’s poverty reduction programs in agriculture that can substantially reduce poverty [10].
According to Medina-Smith [20], countries that have relied on outward oriented development strategies have done better over the medium and long term than inward-looking ones. For agriculture-based economies like Zambia’s, such an outward oriented development strategy implies development of traditional agricultural exports and diversification into non-traditional exports of different price elasticities [21]. However, there is a dearth of empirical evidence on the drivers of export horticulture and producers’ responsiveness to changes in price and non-price incentives. A better understanding of the factors affecting horticultural export performance is central in crafting informed decisions and interventions. Most studies have focused on characterizing domestic horticulture supply and value chains, and have not provided information on the important determinants of export horticulture in Zambia [see for example, 11,13,16]. According to [22], deficiencies in information and analysis have led to policy and market failures in developing countries.
The study reported in this paper uses annual time series data from 1990 to 2010 and error correction models to identify determinants of Zambia’s flower exports. Overall, the results suggest that in addition to the determinants of production, flower exports are equally determined by policies that affect a country’s trade position. Particularly, the results imply that programs, policies and practices that promote trade are clearly required and important ingredient for both farmer export decisions and the competitiveness of the industry.
In the rest of the paper, we first review export horticultural production and export trends in Section 2, followed by a discussion of the determinants of agricultural exports in Section 3. Empirical methods and data sources are presented in Section 4, followed by results and conclusions in Sections 5 and 6.
2. Production and Export Trends of Horticulture in Zambia
Zambia has been exporting horticultural products since the early 1980s. The industry was launched by comercial farmers, who needed foreign currency to import equipment for their main activities, beef, dairy and cereal production [16]. However, the industry only expanded rapidly in the 1990s and early 2000s due largely to an increase in the number of producers, raising export volumes of vegetables and flowers from USD 6 million in 1994 to over USD 33 million in 2001 when the sector employed about 10,000 people [23]. This rapid growth was mainly due to the support of the European Investment Bank (EIB) through the Export Development Project (EDP) which provided long-term credit to some investors and cold storage facilities at airports that allowed producers to import the necessary but locally unavailable inputs, often under subsidized air freight charges [16,24]. At its peak in 2006, the horticulture industry employed over 12,000 people of whom more than 50 percent were women widely engaged in growing and packaging stages of the value chain [13]. At that point the industry was generating annual earnings in excess of USD 50 million [23]. During the same time, about 95 percent of the domestically produced fresh produce was exported to the EU, with the UK, the Netherlands and Germany, among others, as the main destinations [3,16]. Small quantities were exported to South Africa, Australia and the Far East [10].
Most of these gains have, however, been lost during the past seven years mainly due to the collapse in 2004 of the largest horticultural export company, Agriflora [11]. The bankruptcy of Agriflora not only deprived smallholder farmers who participated under contract with the horticultural firm of reliable income, transport logistics, and technical support but also caused most of them to stop production [13]. This development led to a reduction in the number of people that were employed at every stage in the chain from 16,000 to about 5000, causing output and exports to reduce [10] (Table 1 and Figure 1). In addition, the industry has continued to face other challenges such as exchange rate fluctuations [11], high air freight costs due to high cost of aviation fuel in the country [25] and high operating costs that exceed levels observed in most other countries in the region [4]. The reducing investments in the horticulture industry together with the challenges affecting the industry have continued

Table 1. Production and export trends of horticulture in Zambia, 1990-2010.
Source: Based on data obtained from Zambia Export Growers Association (ZEGA).
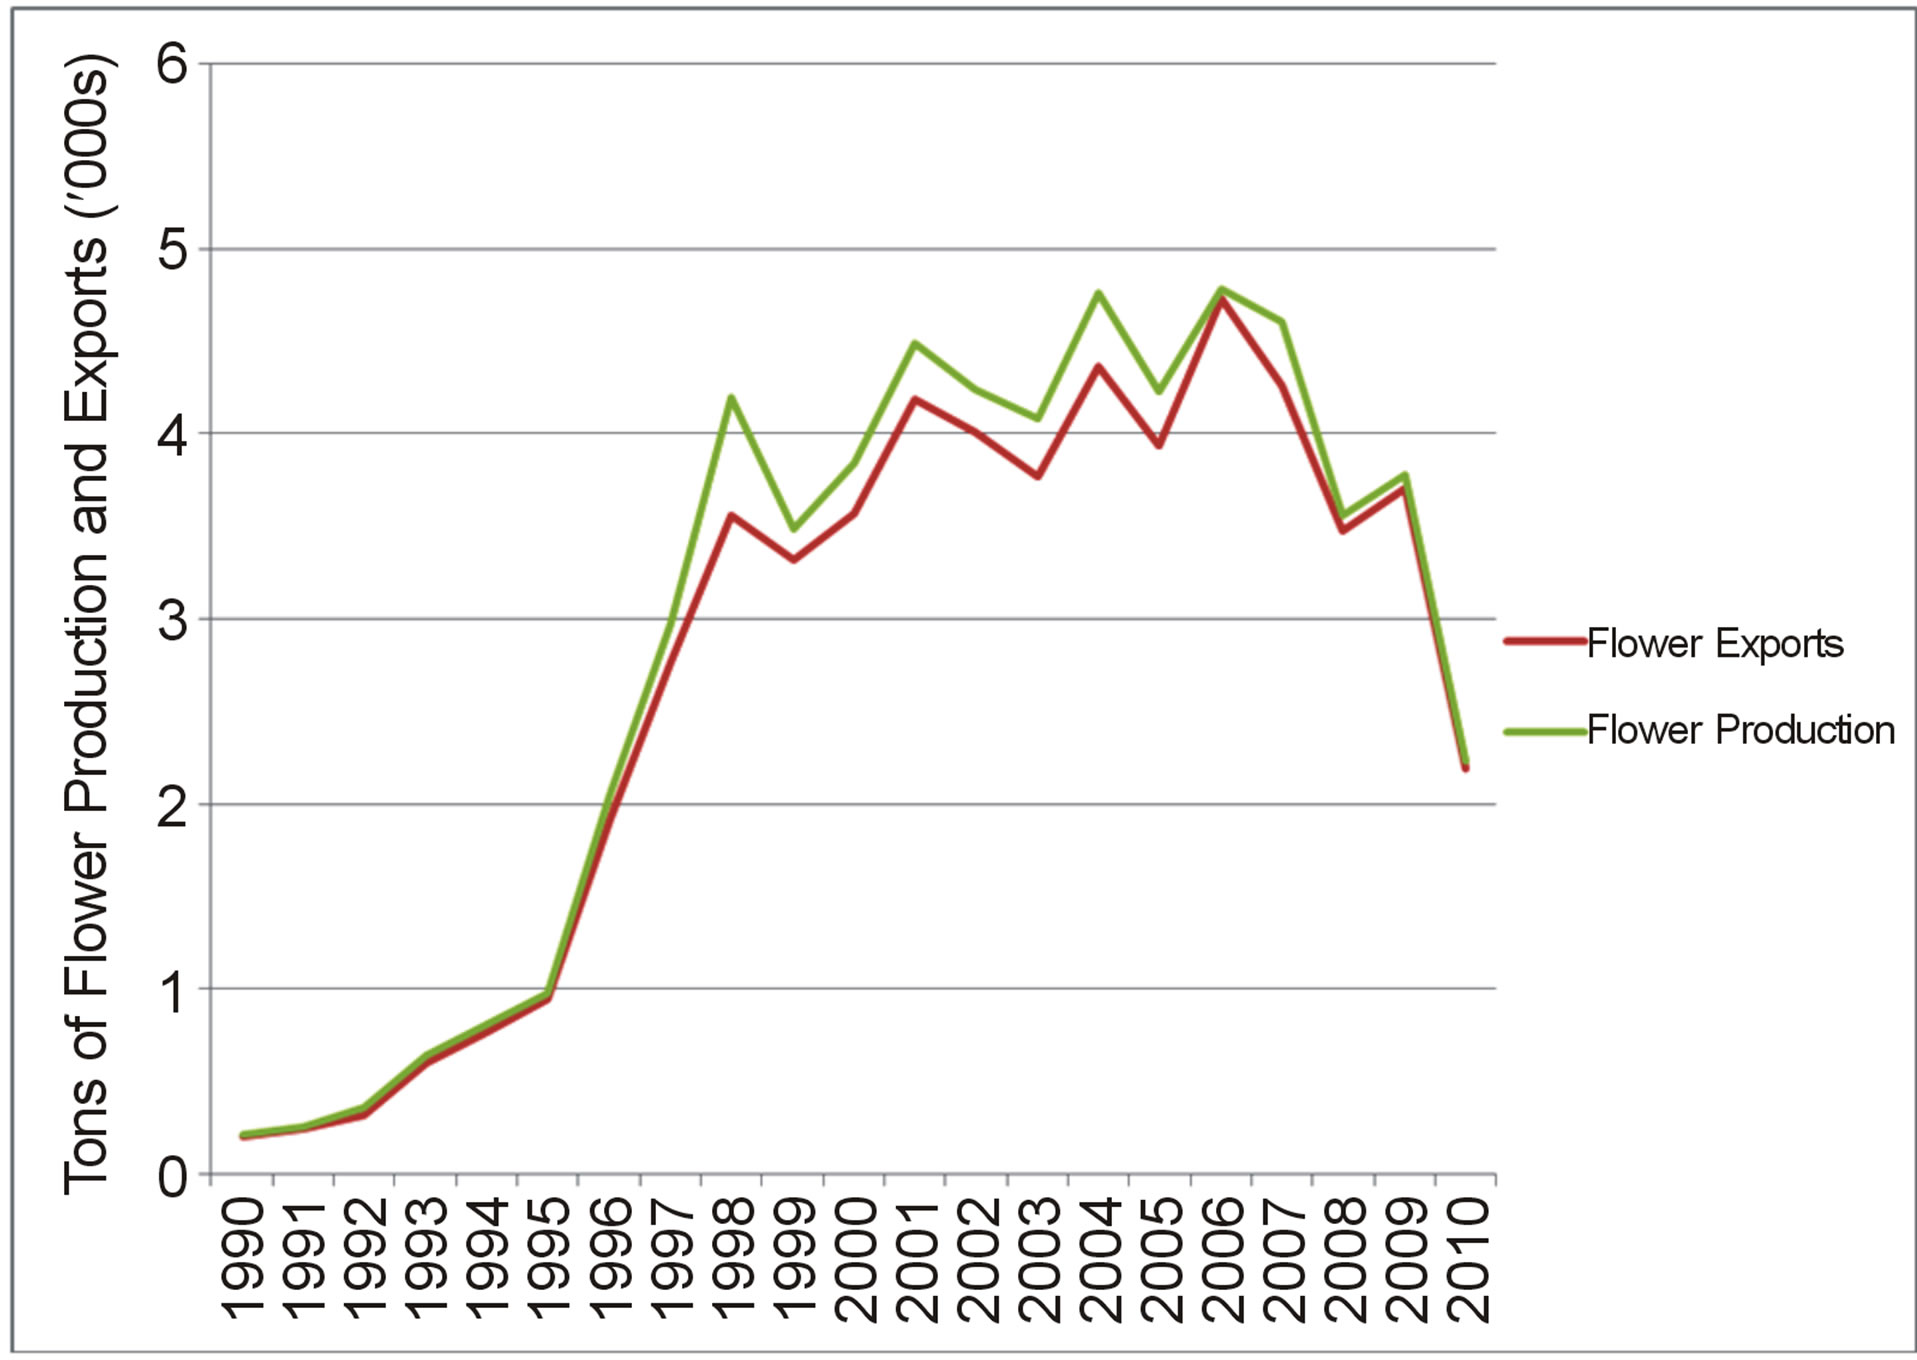
Figure 1. Production and export trends of fresh flowers in Zambia, 1990-2010. (Source: Own estimates using data from Zambia Development Agency, ZDA, and Zambia Export Growers Association, ZEGA).
to adversely affect horticultural production and export constraining its growth and contribution to the economy. According to [25], the area devoted to cut flowers and fresh vegetables in Zambia has stagnated at 140 hectares, compared to Kenya’s over a million hectares, because of high lending rates that prohibit most people from venturing into horticulture production. Furthermore, because the industry is largely export oriented, significant financial losses continue to be incurred by exporters each time the currency fluctuates upwards [11,24]. According to [11], financial losses of about 30 percent of export value were incurred because of the appreciation of the Zambian Kwacha against the US Dollar and other major world currencies in 2005.
Furthermore, tightening standards in the EU export destinations in recent years, mainly to control quantity of imports, have also served a major blow to the Zambian horticultural sector, especially among smallholder producers. For instance, it is argued that the cost of compliance to the European retailers’ private standards for Good Agricultural Practices (EurepGAP) cut farmers’ incomes in half between 2002 and 2006 [26]. As a result, less than 3 percent of the smallholder and commercial farmers involved in supplying foreign markets in 2000 were still doing so in 2006 [23]. [23] reveals that a total of 22 horticultural farms that were involved in production in 2000 had ceased production by 2004 resulting in the loss of about 1440 and 82 hectares of vegetables and flowers, respectively.
3. Determinants of Flower Exports
Empirical studies have identified two main sets of factors that explain the performance of agricultural exports in international trade. One set comprises factors that are external to the individual country, such as volume of growth of world primary commodity markets and producer prices or commodity terms of trade. The other emphasizes variables that are internal to the country, including macroeconomic, production and demographic variables, and policies.
3.1. Impact of Domestic Factors on Flower Exports and Competitiveness
Many researchers have studied the impact of domestic factors on agricultural exports. Most identify production, demographic, macroeconomic variables, and public investments in infrastructure as important factors. For instance, [27], using error correction models, found Nigeria’s agricultural exports to be positively influenced by domestic producer prices and negatively by population growth. These findings were consistent with [21] and [28]. [21] also identified relative rainfall amounts, export credit, and improvement in road network as being directly correlated with agricultural exports.
In a study in Egypt to determine factors that influence agricultural exports, [29], using the gravity model approach, found that agricultural exports increase with GDP. These findings are consistent with those by [28] who also found GDP to have a significant positive impact on volume and competitiveness of South Africa’s agricultural exports.
While it has been argued that high interest rates attract domestic savings, studies have found high rates to discourage local investments by increasing the cost of capital [30,31]. As a result, [30] argues that monetary policies should ensure appropriate interest rates that break the double-edge effect of interest rate on savers and local investors by both attracting savings mobilization and encouraging domestic investment.
Other studies have assessed the impact of domestic exchange rates on export performance of the agricultural sector. These studies have however produced mixed results. Some show that performance of a country’s exports is highly dependent on its exchange rate regime, specifically the real exchange rate, while others do not. The majority of the studies that have observed the dependence of agricultural exports on domestic exchange rate show that the demand for a country’s exports increases when its export prices fall in relation to the world prices, that is, when the domestic currency depreciates against major world currencies [29,32]. In contrast, an investigation of the impact of trade liberalization on export volumes by [33] in Uganda found no significant relationship between real exchange rate and volumes of exports.
3.2. Impact of External Factors on Flower Export Growth and Competitiveness
The impact of external factors such as growth in the importing country and quantity of exports from competing countries has been investigated by many. Most studies have found growth in importing countries, world export price, and quantity of exports from competing countries as important in explaining growth and competiveness of agricultural exports [27,28,34]. For instance, [34] found trading partners’ income or GDP to be the most important driver of Fiji’s exports. Similarly, [28], using gravity models to determine the drivers of South Africa’s agricultural exports, found population (physical market size) and GDP (economic market size) of trading partners to positively influence agricultural export growth.
On the other hand, [27] found world export price, quantity supplied by competing countries and population growth of importing countries to significantly affect Nigeria’s agricultural exports. Their findings show that quantity exported by competing countries negatively influences a country’s agricultural exports. However, the increase in population of an importing country produced mixed results.
4. Methods and Procedures
4.1. Data and Data Sources
This study uses annual time series data from the Ministry of Agriculture and Cooperatives (MACO), Zambia’s Central Statistical Office (CSO), Zambia Development Agency (ZDA), Zambia Export Growers Association (ZEGA), the World Bank (WB), eurostat, faostat, Food and Agriculture Organization of the United Nations (FAO), Zambia National Farmers Union (ZNFU), Indaba Agricultural Policy Research Institute (IAPRI), Bank of Zambia (BoZ) and selected farmers. The quantitative secondary data collected were complemented by key informative interviews with selected farmers, ZDA and ZEGA.
Data on flower production, domestic producer prices, costs, export quantities and revenues, and destinations of Zambia’s flowers exports were collected from ZEGA, EBZ, MACO, ZDA and ZNFU. Data on Zambia’s interest and exchange rates, GDP, inflation, population and national staple food (cereal) production were sourced from BoZ, CSO and IAPRI. In addition, data on world producer prices, GDP of importing countries and flower exports from competing countries were collected from the World Bank, FAO and eurostat.
The quality of export statistics in Zambia was however, at best, variable. Therefore, in an effort to ensure data quality, averages of the data collected from the different sources were used. In addition, with the exception of data on flower exports, and domestic real exchange and interest rates, and real exchange rate, all the data on the afore-mentioned production, macroeconomic and demographic variables were used as obtained from the different sources, without processing. Given that Zambia’s annual flower exports constitute about 95 percent of domestic flower production [3,16], the quantities of flower exports over the period under study, 1990-2010, were estimated from the annual data of flower production obtained from ZEGA and ZDA. On the other hand, real interest series were estimated from the annual nominal interest rates obtained from BoZ, CSO and IAPRI using the Fishers’s equation approach. Likewise, real exchange rate series were estimated from annual nominal exchange rates.
4.2. Determining Factors Influencing Supply of Zambia’s Flower Exports
To investigate the factors that influence supply of Zambia’s flower exports to the three main export destinations—the UK, the Netherlands and Germany an error correction model (ECM) of flower exports, which incorporates both demand and supply factors, was used.
Many authors have noted the increased importance of ECM and co-integration methods in analyses that attempt to describe long and short-run equilibrium relationships simultaneously [see for example, 27,35-37]. According to [36] and [38], an equilibrium relationship exists when variables in the model are co-integrated (a long-run relationship exists between variables). A pre-condition for integration, however, is that the data for each variable involved exhibit similar statistical properties, that is, are integrated to the same order with evidence of some linear combination of the integrated series [27,39-41].
The starting point in the ECM modeling is to assess the order of integration of the variables [27]. The order of integration ascertains the number of times a variable will be differenced to arrive at stationarity [39]. A stationary series has a mean, variance, and auto-correlation that are constant over time [40-43]. The inspection of the order of integration of variables allows the ECM estimation procedure to thoroughly examine the characteristic of time series, helping overcome the problem of spurious or meaningless regression results often associated with nonstationary historical data [31,44]. According to [37] and [39], treating nonstationary series as if they were stationary produces biased OLS results, resulting in misleading economic analysis.
Engel and Granger (1987) [45] present appropriate tests for the stationarity of individual series such as the Dickey-Fuller (DF) and Augmented Dickey-Fuller (ADF) statistics [46]. These tests are based on t-statistics obtained from the estimates of static (long-run) OLS regressions applied to each of the series [41]. This study used the ADF test because of its ability to capture additional dynamics left out by the DF test and ensures that the error term is white noise through the inclusion of additional lag length [27]. Following Engel and Granger (1987) [45], we define the ADF test procedure as:
 , (1)
, (1)
where  is the differenced
  series,
  is first lag of
  series,
  is the first lag of the differenced
  series;
  is the constant coefficient and
  is the error term with mean zero and finite variance. According to the ADF test, the null hypothesis of nonstationarity is rejected if the t-statistic on
 , which is expected to be negative, is significantly different from the critical values for a given sample size [41].
After the order of integration of the variables has been ascertained, through differencing, the next step is to test for cointegration [27,37]2. Cointegration is a test of stationarity of the residuals generated from a long-run regression [41]. The main purpose of cointegration analysis is to establish whether the series in the model trend together over time [39]. The analysis therefore helps to discover existence of a tendency for some linear relationships to hold among a set of variables over long periods of time. Several methods of investigating cointegrating relationships exist including Engle and Granger’s (1987) [45] residual-based, and Johansen and Juselius’ (1990) maximum likelihood tests [47]. Rejection of the null hypothesis that the residuals are nonstationary indicates existence of some cointegrating relationships [37].
The existence of at least two cointegrating vectors among the variables in long-run models implies that an ECM could be estimated to investigate the relationships in the short-run [37]. Therefore, the ECM is estimated when the residuals from the long-run linear combination of nonstationary I(1) series are themselves stationary [27]. The information in the error term from the long-run relationship is used to create a dynamic ECM [39]. The ECM is estimated by capturing all variables in their differenced stationary form, with the exception of the error correction term, which is lagged and given by the residuals from the long-run cointegration equation [39]. The resulting ECM is then used to analyze the impulse response of the dependent variable, annual flower exports in our case, to a stimulus in the explanatory variables in a dynamic setting [27]. A significant error correction term coefficient shows the speed at which the dependent variable adjusts to any deviations from the equilibrium position between itself and each explanatory variable in the previous period confirming the existence of relationships in the short-run between variables.
In addition, a series of estimations are carried out with varying number of lags on explanatory variables in order to achieve parsimonious models [27,37,39]. [48] find that accuracy of forecasts from vector auto-regression (VAR) models, including ECMs, varies substantially for alternative lag lengths. As a result, the estimates of a VAR model are inconsistent as are the impulse response functions and variance decompositions derived from the estimated VAR if the lag length used differs from the true lag length [49]. The optimal lag lengths used in the tests in this study were selected by the Akaike Information Criterion (AIC) because it selects true lag lengths more frequently than any other criteria [50]. Following Sargan (1984) [51], and Engle and Granger (1987) [45], the ECM is specified as:
 , (2)
, (2)
where the term  is the equilibrium relationship between
  and
and ;
;  is the error correction term which accounts for deviations of
  and
and  from the equilibrium position;
  measures the short-term effect
  has on
 ;
;  measures the long-term (equilibrium) effect
  has on
 ;
;  measures the error term correction rate i.e. the speed at which
  adjusts to any deviation from the equilibrium position between
  and
and  in the previous period.
Drawing on the findings of past empirical studies, it was hypothesized that supply of Zambia’s flower exports is influenced by domestic flower production [27,52], flower exports from competing countries [27], GDP of an exporting country [28,29] and GDP of an importing country [28,34,53]. It was also postulated that fresh flower exports in Zambia are conditioned by domestic interest rates [30,31], domestic population growth [27], population growth in an importing country [27,28], and domestic and world producer prices [27,28]. Furthermore, Zambia’s annual flower exports were assumed to be explained by national staple food production [54], export credit [21] and real exchange rate [32,53,55]. Flower exports were selected in terms of growth in export quantity rather than export value because the latter is influenced by fluctuations in exchange rates resulting from dynamics often outside the agricultural sector [28]. Therefore, the dependent variable in the error correction models was supply of flower exports in metric tons to each of the three importing countries. Following [27] and [39], the estimated ECM was specified as:
 , (3)
, (3)
The definitions and sources of explanatory variables used in Equation (3) are contained in Table 2.


Table 2. Definitions and sources of variables in models of flower exports.
The operational definitions of variables used in the model of flower exports (Equation 3) and their hypotheses are described in this section as follows:
Dependent variable
The dependent variable was annual quantity in metric tons (mt) of Zambia’s flower exports to each of the three main export destinations, . Three separate error correction models were run with the aim of capturing key variables that affects the supply of flower exports to each of the three trading partners, the UK, the Netherlands and Germany.
Independent variables
It was hypothesized that higher domestic agricultural production increases a country’s agricultural exports since surplus production can only be exhausted in the international markets [56]. As a result, both current and lagged flower production,  and
and , were hypothesized to have positive impacts on flower exports.
National cereal production,  , was hypothesized to have negative effects on quantity of flower exports. While more recent studies have noted positive impact of horticultural production on smallholder farmers’ income [17,19], other studies, particularly earlier works, have raised concerns about the microeconomic performance of non-traditional agricultural exports [see for example, 54,57]. Most of such concerns are related to the trade-offs between food and export or cash crops due to the possibility of competition for resources between one another. In the case of Zambia, much of the increase in cereal production in the recent years is largely attributed to significant production and marketing subsidies, averaging 62 percent of total annual agricultural budgets, mostly directed at the nation’s staple food crop, maize [58].
Flower exports from competing countries,  , was expected to negatively influence Zambia’s flower exports to the three countries because of the likelihood to have the absorptive capacity of foreign markets reduced by imports from Zambia’s competitors. In a study to establish the key determinants of Nigeria’s main agricultural crops, [27] found exports from competing countries to have negative effects on Nigeria’s agricultural exports.
Real GDP of an importing country,  , was hypothesized to positively impact flower exports. Many studies have found export performance of developing countries, especially the growth rate of world trade in primary products, to depend on the growth rate of industrial production in developed countries [24,27,29,53]. Similarly, Zambia’s real gross domestic product, zam GDPt, was hypothesized to have positive impact on export supply of Zambia’s flower exports, since increased output often results from and leads to a general growth in the economy’s productive and consumption sectors, including agriculture [59].
Domestic interest rate,  , which indicates the cost of capital [37,60], was expected to negatively influence flower exports because of its negative impact on local investment. Many studies have found high interest rates to discourage local investments into even productive sectors by increasing the cost of capital [30,31,61].
Domestic population,  , was hypothesized to negatively influence supply of flower exports since increase in population is expected to require corresponding increase in production of staples, something that could necessitate shifting of resources from exportables. [27] found domestic population to have negative effects on Nigeria’s agricultural exports. In contrast, population increase in importing countries,
  , was assumed to be ambiguous as the increase in population in export destinations might lead to increased consumption of imports, including primary products from developing countries, or reduced importation due to reduced per capita disposable income among households.
Domestic and world producer prices,  and
and , were both hypothesized to have positive effects on flower exports since farm gate prices largely determine how households allocate their resources to competing farm enterprises in context of various factors [62]. Many authors have found agricultural exports to be positively influenced by domestic and world producer prices [21,27,28].
The effect of domestic real exchange rate,  , on quantity of flower exports was hypothesized to be in two folds. Firstly, depreciation of the local currency was expected to result in high prices of imported inputs such as fertilizers, chemicals, seeds and pesticides [31,37]. This would then mean reduced utilization of purchased inputs among farmers that would invariably lead to low agricultural output, and hence exports [37]. On the other hand, the depreciation of the Zambian Kwacha was also expected to stimulate net exports of agricultural commodities since depreciation of domestic currency make exports cheaper and competitive in international markets [29,37,60]. Therefore, like population of importing countries, the sign for real exchange rate too was considered to be indeterminate, positive or negative.
Export credit,  , which was partly taken as subsidy given that recipient farmers pay less than loaned in many respects [16], was expected to positively affect flower exports. It has been argued by many that lack of credit is an important constraint to adoption of yield enhancing technologies [5,8]. Therefore, given the widespread lack of sufficient savings by most smallholder farmers for investments, availability and increase of credit to the sector was expected to positively impact flower exports. Many other studies have found agricultural credit to have positive effects on exports [21,31,63].
Lastly, lagged error correction term,  , which shows the speed at which the model returns to equilibrium from disequilibrium, was expected to be negative and less than unitary in absolute terms, since instantaneous or 100 percent adjustment was not expected [27,37, 39]. According to [37], a negative sign for the coefficient of the correction term indicates that if flower exports were above the long-run relationship with each explanatory variable, they would decrease and return to equilibrium eventually.
4.3. Determining Factors Influencing Flower Competitiveness
To determine the impact of macroeconomic and production variables on the competitiveness of Zambia’s flower exports, an ECM of competitiveness was run using the estimated annual domestic resource cost (DRC) series of flower exports. The domestic resource cost was used to indicate competitiveness of Zambia’s flower exports because of limited data on importing countries and its ability to overcome problems of trade distortions, data quality and volatility that often characterizes international agricultural trade [64,65]. The ECM of the factors influencing competitiveness of Zambia’s flower exports was specified as:
 , (4)
, (4)
The sources of explanatory variables in used in Equation (4) are as defined in Section 4.2 (Table 2).
The operational definitions of variables used in the model of flower exports (Equation 4) and their hypotheses are described in this section as follows:
Dependent Variable
The dependent variable used in the competitiveness error correction model was the estimated annual domestic resource cost  of flower exports. The domestic resource cost of flower exports,
  , was estimated using annual historical cost, revenue and macroeconomic data collected from Zambia Export Growers Association (ZEGA), Zambia National Farmers Union (ZNFU), Zambia Development Agency (ZDA), Central Statistical Office (CSO) and selected farmers. Following Monke and Pearson (1989) [66], a reduction in the DRC or a negative effect from an explanatory variable indicated an improvement in competitiveness of Zambia’s flower exports.
Independent Variables
Increased flower production was hypothesized to have positive influence on competitiveness of flower exports since fixed costs per unit output decrease as output increases due to the economies of scale [67]. As a result, both current and lagged domestic flower production,  and
and , were expected to both positively influence competitiveness.
Zambia’s real GDP,  , was expected to positively influence flower competitiveness. [59] have asserted that increased national output or GDP often results from and leads to a general growth in the economy’s productive and consumption sectors, including agriculture through forward and backward linkages. In addition, [28] and [29] found the GDP of an exporting country to have significant positive impacts on both volume and competitiveness of agricultural exports in Egypt and South Africa.
Domestic real interest rates,  , were expected to negatively influence competiveness of Zambia’s flower exports because of the negative effects they have on both agricultural production and competitiveness. Following [66], this assumption implied a positive effect of real interest rates on the domestic resource cost (DRC) of flower exports.
We considered the effect of the domestic population,  , on flower competitiveness indeterminate, positive or negative. While the increase in domestic population might lead to increased demand for fresh flowers supplied locally, it has potential to reduce horticultural production if the increase in population requires that resources be shifted from exportables to staples to meet increased staple food requirements as a result of high population growth.
Although past studies have produced mixed results, domestic and world producer prices,  and
and , were hypothesized to have positive effects on flower competitiveness since increase in output prices was expected to lead to increased revenues and savings [62]. Higher savings were in turn expected to lead to increased investments and adoption of innovative technologies which ultimately should increase competitiveness of agricultural exports.
National staple food production,  , was expected to be negatively related to flower competitiveness because of the likelihood of competition for resources between staples and exportables [57], and the orientation of the Zambian agricultural policy, which mainly favors cereal production [58,68]. The agricultural policy regimes in Zambia have focused mainly on fertilizer subsidies and targeted credit programs to largely stimulate smallholders’ productivity in cereal production, mostly maize [58,68].
It was assumed that Export Development Project’s (EDP) credit to the horticulture industry,  , would influence competitiveness in two folds. Firstly, export credit to the industry was expected to make it possible even for inefficient producers to continue producing given that, in many respects, recipient farmers pay less than loaned. This would invariably reduce competitiveness in the sub-sector. According to [16], farmers under the EDP, in addition to getting free cold storage facilities at major exit points, are allowed in certain instances to import the necessary but unavailable inputs at subsidized freight charges. Many studies have found such government and donor support, with some subsidy elements, to negatively influence competitiveness and efficiency [69-72]. On the other hand, a positive influence of export credit on flower competitiveness was also expected since credit makes it possible even for resource poor famers to adopt yield enhancing technologies [10,12].
The effect of real exchange rate,  , on competitiveness of export flowers too was hypothesized to be in two folds. Firstly, depreciation of the local currency was expected to result in high prices of key imported inputs such as fertilizers, chemicals, seeds and pesticides which might lead to high costs of production, and hence reduced competitiveness [37]. However, the high input prices resulting from the depreciation of the Zambian Kwacha might reduce utilization of purchased inputs among farmers, reducing agricultural output and exports in the process [37]. In contrast, depreciation of the Zambian Kwacha was also expected to stimulate net exports of agricultural commodities since depreciation of domestic currency make exports relatively cheaper than before and hence more competitive in international markets [37, 60].
The lagged error correction term,  , was expected to be negative and less than unitary in absolute terms, since instantaneous or 100 percent adjustment by the model was not expected [37,39]. In addition, a negative sign for the coefficient of the correction term was assumed since it indicated that if flower competitiveness was above the long-run relationship with each explanatory variable, it would decrease and return to equilibrium eventually [37].
5. Results
5.1. Stationarity Tests
The results of the ADF unit root tests are presented in Table 3. The results show that of the 23 variables tested for integration (nonstationarity), only flower exports to the Netherlands, flower exports to the UK, flower exports to Germany, population of the Netherlands and Germany, flower production, lagged flower production, export credit, interest and exchange rates, and the DRC of flower exports were stationary in their original levels at 5 percent significance level. The test results therefore strongly support the hypothesis at 5 percent that most time series variables were nonstationary in their original levels. The nonstationary variables were, thus, differenced once or more to arrive at stationarity before using them. As a result, all the series, with the exception of those that were found stationary in their original level form, have two ADF test statistics, one when in nonstationary original form , and the other after attaining stationarity following differencing
 .
.
5.2. Cointegration Tests
The results of cointegration tests are reported in Tables 4 and 5 for competitiveness and export models, respectively. In all the models, Johansen’s maximum likelihood

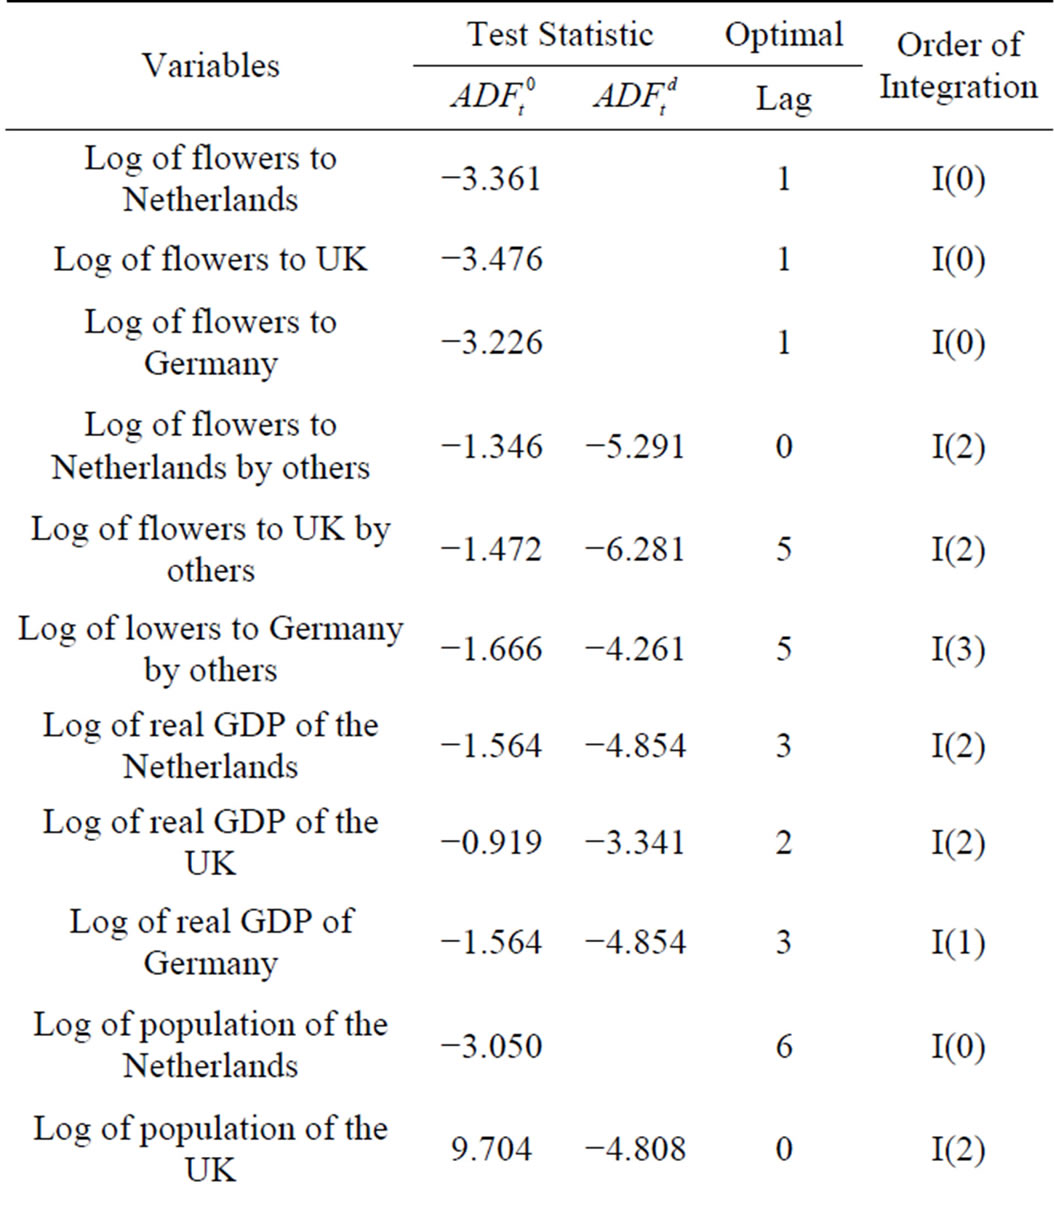
Table 3. Augmented dickey-fuller unit root test for variables used in the horticultural export models of flower supply and competitiveness.
Notes: ADF critical values at 1% and 5% levels were −3.750 and −3.000 respectively.
(trace) test results show the presence of at least two cointegrated vectors since the null hypothesis of no cointegrated relationships (r = 0) is rejected at both 1 and 5 percent levels, respectively. Similarly, the ADF test statistics of residuals at 5 percent significance level show that the predicted residuals were stationary in their original levels. Therefore, the null hypothesis of no cointegration among variables was firmly rejected on the basis of

Table 4. Cointegration test results for flower competitiveness model.
Notes: ADF critical values at 1% and 5% levels were −3.750 and −3.000 respectively. [ ] is number of lags. r is number of cointegrating relationships given by the maximum rank column of the Johansen tests for cointegration.

Table 5. Cointegration test results for flower export models.
Notes: ADF critical values at 1% and 5% levels were −3.750 and −3.000 respectively. [ ] is the number of lags. r is the number of cointegrating relationships given by the maximum rank column of the Johansen tests for cointegration.
both tests. The existence of cointegrating vectors (longrun relationships among variables) implied that dynamic error correction models could be estimated to explain the performance of Zambia’s flower exports in the short-run.
5.3. Error Correction Models for Factors Affecting Supply and Competitiveness of Flower Exports
Given that fluctuations in flower exports are largely expected to be more evident in the short-run than in the long-run, analysis focused on estimating dynamic short-run parsimonious export and competitiveness determinant models. Table 6 presents the results for the models that simulated short-term changes in the quantity of flower exports to the three main export destinations - the UK, the Netherlands and Germany—in terms of changes in the other variables, and the adjustment towards the long-run equilibrium in each time period. The p-values for the LM test statistic of 0.869, 0.629 and 0.813 suggest that the null hypothesis of no autocorrelation could not be rejected at 1 percent in all the three models. The condition of no autocorrelation between residuals in the three models was strongly supported by


Table 6. Short-run models for factors affecting flower exports to germany, the UK and the Netherlands.
Dependent variable is log of flower exports; Standard errors in parentheses; Significant level: * = 10%; ** = 5%; *** = 1%.
the Durbin-Watson (DW) test statistics which are within the acceptable bound, 1.5 - 2.5 [52]. The p-values (<0.0001 and <0.0037) for the F-statistic indicates that the models were significant at 1 and 5 percent levels, respectively. The models overall had very strong goodness-of-fit each with an R2 of above 0.90.
The results demonstrate that Zambia’s flower exports are positively influenced by domestic production, GDP and population of importing countries, producer prices, export credit and exchange rate depreciation. For instance, the positive coefficients for real exchange of 0.1413, 0.0267 and 0.1052 indicates that a 1 percent increase in exchange rate (decrease in value of the Zambian Kwacha relative to the US Dollar) increased flower exports to Germany, the UK and the Netherlands by about 0.14, 0.03 and 0.11 percent, respectively. The regression results also show that increases in exports from competing countries, domestic cereal production and interest rates negatively influenced flower exports. The percentage decrease in the quantity of the flower exports to the three main destination countries attributed to a percentage increase in each of the three variables is indicated by the negative coefficient for the respective covariates (Table 6). Lastly, the coefficients for the error correction term show that there was 98, 10, and 48 percent feedback in the estimated ECMs of flower exports to Germany, the UK and the Netherlands, respectively, from the previous year disequilibrium into the short-run dynamic process. The significant error correction terms in the models confirm the proposed relationship between flower exports to the three countries under study, and the variables considered in the models.
Table 7 present results for the ECM which evaluated the impact of the covariates on competitiveness. The R2 of 0.7406 indicates that the estimated relationship explained 74.06 percent of the total variation in the competitiveness of flower exports. In addition, all diagnostic tests (LM and DW) show that there was no autocorrelation, the chief source of biasedness in time series analyses. Overall, the findings indicate that flower production, prices and exchange rate depreciation positively impacted while cereal production, export credit and interest rates negatively impacted competitiveness of flower exports. Following Monke and Pearson (1989), [47] a reduction in domestic resource cost (DRC) indicates an improvement in competitiveness. Finally, the significant coefficient of −0.0366 for the correction term implies that there was 3.7% feedback in the competitiveness adjustment model from the previous year disequilibrium into the short-run dynamic process.
On the whole, our results in the two sets of models conform to both our prior expectations and findings by other empirical studies. The positive impact of domestic flower production on flower export supply and competi-


Table 7. Short-run model for factors affecting competetiveness of flower exports.
Dependent variable is log of domestic resource cost of flowers (DRCt); Standard errors in parentheses; Significant level: * = 10%; ** = 5%; *** = 1%.
tiveness is consistent with [52] suggesting, in part, that if interventions are to achieve increased flower exports; they should among other things, first increase domestic flower production. According to [67], increasing farm production improves competitiveness and efficiency of the farm sector since fixed costs per unit output decrease as output increase due to economies of scale. Therefore, the decline of flower exports from 2006 onwards did not just result in reduced export revenues but equally resulted in high overhead costs causing a reduction in competitiveness. The positive effect of real GDP and population of importing countries on Zambia’s flower exports too conform to other studies which also found economic growth and population increase in foreign markets critical in stimulating a country’s agricultural export supply and competitiveness. Explicitly, the result implies that economic and population growth in foreign markets increases demand for a country’s agricultural exports suggesting that the decline of the horticultural industry from 2006 onwards could be partly attributed to the poor performance of the global economy during the same period. Both [28] and [34] found GDP and population growth in importing countries to increase agricultural exports. In addition, conforming too to our findings, [21] found agricultural export credit to have significant positive influence on the volume of Cameroon’s agricultural exports while [27] and [28] found world producer prices to positively impact agricultural exports in Nigeria and South Africa, respectively. Drawing on this result, it could be equally deduced that the significant decline in investments to the industry following the bankruptcy of the largest horticultural firm, Agriflora, in 2004 largely contributed to the slump the industry continued to record thereafter. Besides, the result recognizes the fragility of the horticulture industry in the country suggesting the need for appropriate, broad-based policy support to ensure sustainability and growth of the industry. Conversely, most studies have consistently found a negative relationship between subsidized credit, like in our case, and agricultural competitiveness [69-72]. Particularly, the negative relationship between subsidized credit and flower competitiveness seem to suggest that while the subsidized credit managed to increase output in the shortrun, it failed to sustain the high production recorded in the earlier years of the EU’s Export Development Project (EDP) due to resource constraints that followed after the project concluded. Similarly, [27] also found exports from competing countries to reduce Nigeria’s major agricultural exports implying that in addition to increasing production, the replacement of Zambia’s flower exports to the three principal countries by those from other countries dictate that there must be a quality improvement so the country’s exports can compete favorably with those from other countries.
Furthermore, our results on interest and exchange rates in both export and competiveness models are comparable with those of [1,2,31]. The authors also found high domestic interest rates and appreciation of the local currencies to reduce both volume and competitiveness of agricultural exports. The results therefore suggest that the significant appreciation of the Zambian currency during the late 2000s contributed substantially to the decline of the horticultural industry during the same time period. The observed negative impact on supply and competitiveness of flower export due to the appreciation of the local currency could be attributed to the loss of export revenue among exporting producers arising from the increase in value of the domestic currency relative to the major world currencies such as the US Dollar and Euro [29,32,52]. The result could equally be attributed to the decline in competiveness in the international markets because of high export prices for commodities that arise following an increase in the relative value of a country’s currency [37]. On the other hand, the negative impact of interest rates on exports and competitiveness is particularly attributed to the resultant high cost of capital, mainly credit, which makes it difficult for smallholders, especially resource poor ones, to adopt modern and yield enhancing technologies for increased agricultural exports [39]. According to [25], the area devoted to cut flowers and fresh vegetables in Zambia has stagnated at 140 hectares, compared to Kenya’s over a million hectares, because of high lending rates (over 35 percent) that prohibit most people from venturing into horticulture production.
6. Conclusions and Policy Implications
Overall, the results suggest that in addition to the determinants of production, flower exports are equally determined by policies that affect a country’s trade position. The results in particular imply that relative depreciation of the Zambian currency stimulates agricultural exports. Hence macroeconomic policies that explicitly seek to over-value the Zambian currency are not desirable for the country’s agricultural exports. By reducing exporters’ revenues and making exportables relatively expensive in the international markets, such anti-trade policies are likely to lead to reductions in both output and competitiveness. In addition, the positive impacts of export credit on supply of flower exports but negative on competitiveness suggest that while subsidized agricultural grants may increase output by enhancing farmers’ access to productive inputs, they may also reduce competitiveness by allowing inefficient producers to continue producing. Furthermore, the negative effect of cereal production on both supply and competitiveness of flower exports indicates that food and export crops are not complimentary but competitive with one another for resources, including policy incentives.
These findings seem to identify a strong need for programs, policies and practices that are aimed at enhancing and fostering an environment favorable for both flower production and exporting. First, investments in infrastructure and other broad-based interventions that improve producers’ access to crucial but locally unavailable inputs and storage facilities, without distorting markets, are especially needed to help exporting farmers reduce the cost of production and handling. Such market-based interventions have potential to increase production without reducing competitiveness. Second, market determined exchange rate regimes that promote trade are clearly required and important ingredient for both farmer export decisions and the competitiveness of the industry. Third, the results indicate that supports to the agricultural sector in the country need to be appropriately balanced between food and cash crops if both sub-sectors in the sector (agriculture) are to grow. Furthermore, the discernible positive effects of foreign countries’ GDP and population on flower exports call for policies that take into consideration the growth in industrial production in the major importing countries—the UK, the Netherlands and Germany.
7. Acknowledgements
This paper is based on earlier work done by the authors with support from the African Economic Research Consortium (AERC) through the Collaborative Masters in Agricultural and Applied Economics (CMAAE) programme. However, the views expressed herein do not necessarily represent the position of any of these organizations. All errors in interpretation are the authors’ own.
NOTES
2In order to avoid the spurious regression problem, with its related nonstationary pattern of the variables, differencing has become the common method of bringing nonstationary series to Stationarity [55].