1. Introduction
Breast cancer is the second leading cause of cancer deaths in women. The breast cancer mortality rate has dropped since the early 1990s, but additional efforts are necessary to ensure that this trend continues. Detecting cancer early is critically important because, if effective treatment is provided, the burden of both illness and death can be reduced. To understand how a disease develops and to provide appropriate prevention and care services, it is essential to be able to distinguish those in a population who have the disease among healthy people. To face this social problem, a number of scientific and national organizations have published guidelines supporting and promoting periodic breast screening examinations. Recent studies have caused debates with focus on a number of issues, particularly the age at which screening should begin, the optimal frequency of screening and the real impact on mortality. These debates have underlined the importance to assess screening unit performances in clinical practice and to clarify its potential for contributing to breast cancer survival rates. To enhance the understanding of breast cancer screening practices and their relation to health outcomes, Screening Programmes have been established in many nations. Breast Screening Programmes provide free breast screening for all women in the country aged 50 and over. The Screening Programme nationally coordinates the screening units that participate to the screening program.
Screening units invite the population in their catchment area, sending women to a specialized unit, which can either be mobile, hospital based, or permanently based in another convenient location.
They also support the development and implementation of effective interventions, and monitor and explain cancer trends in all segments of the population, helping low-income, uninsured, and under-served women to gain access to lifesaving breast screening programs. Since the funding for screening services is decreasing, it is important to strengthen the effectiveness of this significant social programme through national standards which should be monitored and controlled. These challenges exacerbate the need to have information on the performance of individual screening units and, in particular, whether resources are currently being used efficiently.
In this paper, we will explore the screening performance assessment using the stochastic DEA framework. This framework can be considered very satisfactory, in that it allows for the possibility of stochastic variations in input-output data that often exist in the health care sector, which is, then, an ideal field of application.
The main contribution of this paper is the assessment of the efficiency of screening units based on stochastic DEA models.
The structure of this paper is as follows. The next Section is devoted to the discussion of the stochastic DEA models used in this paper. Section 3 illustrates the application of the model developed within the context of the screening unit evaluation. Finally, Section 3 presents the overall conclusions of this study and discusses the ongoing work toward this direction.
2. Stochastic D.E.A. Models
Data Envelopment Analysys (DEA) is a well known nonparametric technique for estimating production frontiers and evaluating the relative efficiency of decision making units (DMUs) with multiple outputs and multiple inputs. In general, functional relationship among data as well as the results of production process are stochastic in nature. In order to handle the presence of uncertainty in DEA, various models have been presented in the literature.
Land et al. [1] incorporated uncertainty by means of the chance constrained format. They developed a probabilstically constrained model in which inputs are considered deterministic and outputs are jointly normal: the difference between the best practice output and the observed output is assumed to be normally distributed. In this setting, the efficient frontier is a soft margin which may be crossed by a few DMUs. In particular the chance constrained model allows to set the threshold probability the constraints are required to hold with. Extending the concept of efficiency in a chance constrained setting the authors stated the equivalence between chance constrained efficiency and Pareto-Koopmans efficiency. The classical study of Charnes et al. [2] was re-examined and used as illustrative application.
Following the notation used in [1], we define:
 the collection of DMU indexed by j
 the outputs set indexed by i
 the inputs set indexed by r
 deterministic input vector for each DMU
 random output vector for each DMU
The following chance constrained version of the stochastic DEA model presented in [1], is reported below.
(LLT) 
 (1)
(1)
 (2)
(2)
 (3)
(3)
where Pr stand for probability, θ is the radial input contraction factor and α is the probability of satisfying the constraints. The model seeks the minimum contraction factor for DMU k, requiring that the best practice outperforms the observed output in α% of the cases and that best practice must not employ more inputs than those employed by DMU k. In other words the inequality (2) is to hold with a priory given probability. This has the advantage of making the estimated frontier less sensitive to extreme observations, but on the other hand introduces in the model an external information. Assuming that the outputs are jointly normal, an equivalent deterministic reformulation can be obtained leading to a nonlinear convex problem. The claim underneath the model is that the assumption of normality is justified by the GaussMarkov theorem. Although this assumption is quite common, it is very often a rough approximation of the distribution function of the random vectors involved in the model.
In order to obtain the deterministic equivalent, we suppose that the best practice output minus the observed output is normally distributed with mathematical expectation and standard deviation as follows:
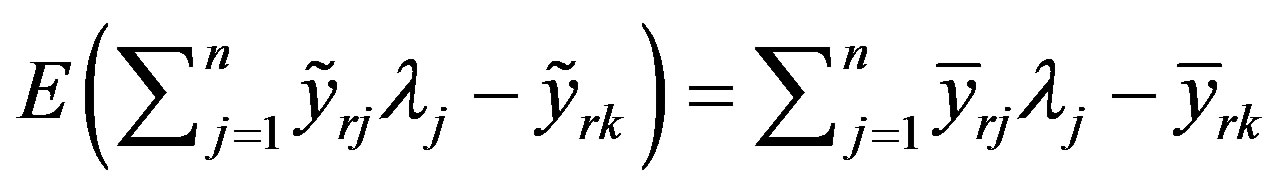

Certainty equivalent of the constraint (2) for each  can be rewritten as

As we can note, the probabilistic constraints are individually imposed on each input. This model enables to handle dependencies among different DMUs but ignores the correlation among inputs, outputs, and inputs-outputs.
Additional stochastic DEA approaches can be found in [3-8].
Recognizing the validity of the model presented in [1] Bruni et al. [9] extend the model in the scenario setting, imposing probabilistic constraints jointly on all the input-output data.
Very often, especially in real case studies, the information about the joint probability of the random variables are not known and in practice they are inferred from the raw data and the distributions of the stochastic parameters have to be approximated by discrete distributions with a limited number of outcomes called scenarios.
Denoting by (Ω, Ξ, Pr) the probability space in which the random output vector  is defined, and assuming that Ω follows a discrete distribution with finite support
 , the problem (JOINTDEA) can be formulated as:


A deterministic equivalent reformulation may be obtained by introducing a binary knapsack constraint, as reported in [10], obtaining the following mixed integer problem.


2. Assessment of Screening Units Activity
This section illustrates the use of stochastic DEA models discussed in this paper through the analysis of screening units activity. The results reported are drawn from the analysis of screening units from two Italian regions.
The Italian government has undergone substantial investments in breast cancer screening, following the “European Guidelines 2000” for Quality Assurance in mammography. They include recommendations on assessment, surgical treatment of breast lesions and the collection of related data, suggesting also to monitor outcome measures and encourage the use of the QT Audit System, developed within the “Europe against Cancer” programme.
According to the consensus statement on breast cancer formulated within the first Joint Breast Cancer Conference in Florence, “quality assurance programmes should become mandatory for breast cancer services to qualify for funding from healthcare providers”. The necessity for building transparent performance evaluation of individual screening units is shared by different sides.
However, there is a general agreement that in order to address such complex problem, the most crucial issue is the identification of appropriate inputs and outputs as well as the performance to be evaluated.
Additionally, the stochastic nature of the inputs and outputs involved in this important health care sector should be acknowledged.
In [11], the authors investigate the impact of screening unit size on efficiency using an input oriented model, where three outputs (number of invitations, screens, and cancer detected) and six inputs (number of radiologists, radiographers, administration staff, medical staff, dedicated mammography machines and assessments performed) were used.
As acknowledged by the authors, the ideal output would be the number of true negative and true positive, considering that a critical issue for screening units is determining how good the tests performed are at separating those with and without the disease in question.
Given its impact on the costs of the screening programme, we will focus on the performance measure true positive. False positive screening outcome, although very important from a psychological point of view, suffers from the lack of information in the screening data bases.
Admitting the stochastic nature of the test, we have considered the output true positives (TP) as a random variable involved in our stochastic DEA model. In particular, the random variable TP can be approximated with a Binomial distribution with success probability p, where p is the probability of one true positive in n screenings.
If the number of women screened n is sufficiently high np ≥ 5 and n(1 − p) ≥ 5, the Binomial distribution can be approximated by a Normal distribution with mean and standard deviation as follows:
 .
.
We recall that thanks to this assumption the OP model and LLT model can be formulated as nonlinear programming problems.
Data were taken from public reports regarding the activity of screening units in Tuscany. Because cancer detection rate may vary geographically, it seemed appropriate to consider screening units in the same area or region.
This is also motivated by the technological disparity across the nation, which can lead to a distortion in the interpretation of results.
In Tuscany, 12 screening units (SU) participate to the screening program.
Unfortunately, only data concerning 8 DMU were available for the period 2000-2003. The input-output set used for this case study is reported in Table 1.
The stochastic output ỹ3j was analyzed in detail prior to the efficiency assessment. In particular, the plausibility of the normality assumption was tested using SPSS v.10. In the Table 2 we report the results obtained by using the two most used normality tests for small samples.
As we can see, the results of the Shapiro-Wilk test for the SUs 2, 3, 4, 6, 7, 8 are very low and only acceptable for SU 1,5.
The first stochastic DEA model we run is the adaptation of the LLT model presented in the previous section. Assuming no correlation among different DMUs (i.e.
 for p ≠ q) the nonlinear deterministic equivalent solved is the following:
This will provide us with information regarding how the probability level α influences the stochastic efficiency scores of the screening units. As we expected, the stochastic efficiency of the DMUs becomes larger as the probability level increases. This behaviour can be explained recalling that larger is α higher is the probability of the DMU to belong to the efficient frontier.
We observe, however, that this claim is not true for DMU 5 at least for probability levels less or equal to 0.85.
In this case, we can term this units structurally inefficient, in that its efficiency score is not affected by variation of α.
Analyzing the average performance against individual performances of the screening units, we can observe that, on average, if production processes in all DMUs had followed the best practice of the most efficient units identified, than the mean outputs could have been produced with only 91.52% of inputs in the deterministic case (α = 0.5).
As we can see, the reference set for DMU 3 is composed by 3 DMUs (1,6,7), but the DMU 7 has the greatest influence.
Besides this, could be interesting to know, for each DMU, the best practice in order to make a comparison between the actual level of inputs with the target level estimated from the efficient peers.
This information will allow the decision maker to find the way of improving performance, using the results of DEA.
For example for DMU 3, in Figure 2 we report the relative influence of the units in the reference set on the DMU under study.
For all the inefficient DMUs, we report the contraction of the input assessment and the target level for the DMU to be efficient in Figure 3.
As we can note the input contraction decreases when α raises since we allow for increasingly important random variation in the process.
Further experiments were carried out whit the aim of examining the influence of the correlation among DMUs in the performance evaluation process.
To this extent, we have modified the stochastic constraints by considering is the covariance matrix of the output true positive (reported in the Appendix) defined as follows:
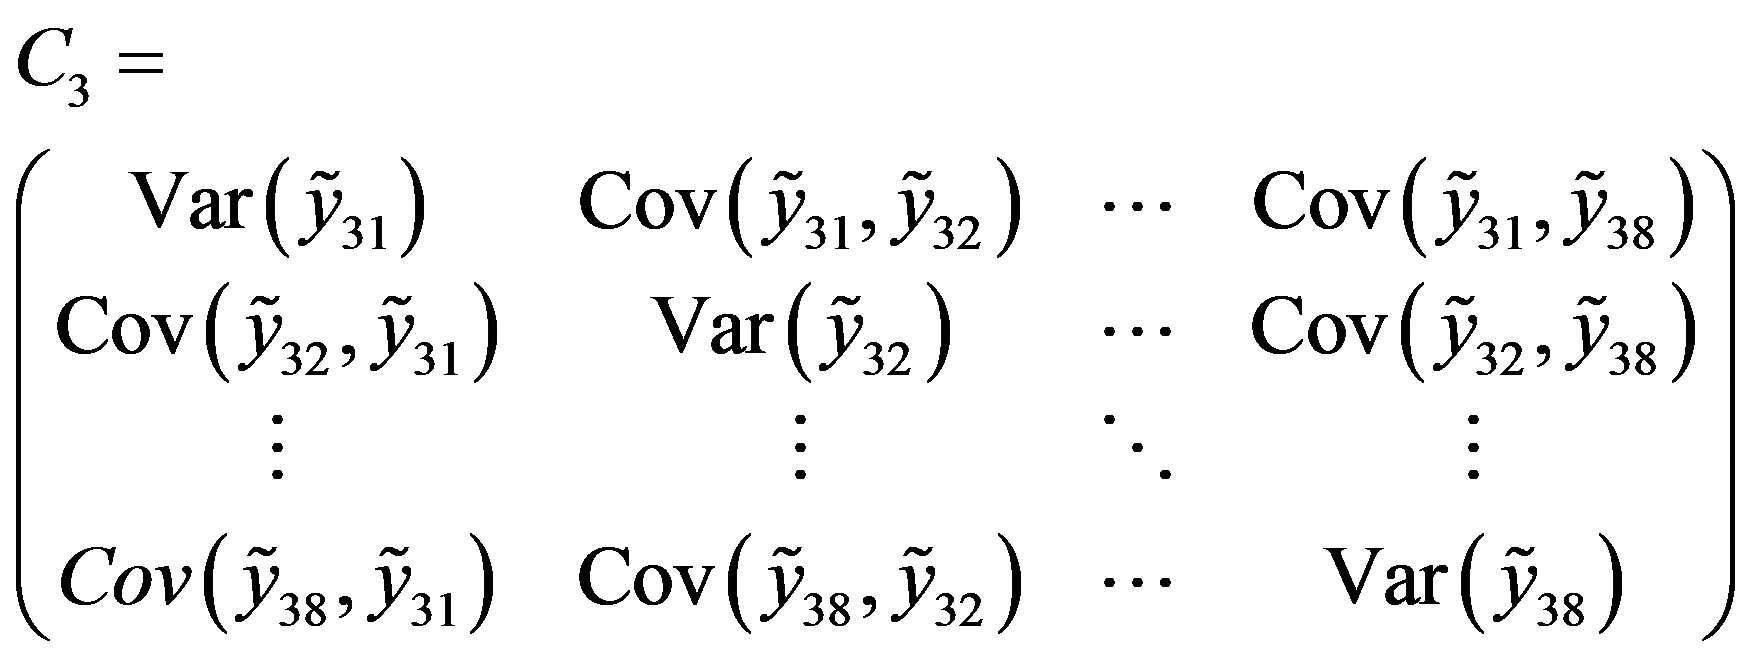
The model becomes:

Figure 2. The reference set of the DMU 3.
The DMUs termed efficient in the previous model remain efficient, whereas the inefficient DMUs experiment a slight variation in the efficiency score.
In Figure 4, we report for DMU 2 the comparison between the scores with and without the hypothesis of correlation inter DMU. Similar results were observed for the others DMUs. We notice that the differences are not relevant and thus, we can suppose that DMU are not correlated or that the correlation is not high. This results matches with the actual situation, in which each DMU is coordinated at regional level only to a little extent.
Finally, using data obtained from “Agenzia di Sanità Pubblica” of an other italian region, we have compared the LLT and the JOINTDEA models, over five Screening Units (RM A, RM H, RM E, RI, FR). In the Table 3, we report the different combination of inputs and outputs utilized to construct the instances of the model.
Running the experiments was clear that some of the instances where not very informative.
For this reason we restricted our attention to models S3 and S5. We would like to recall here that unlike LLT model, the JOINTDEA model does not make any assumption about the probability distribution of the random variables.
Figures 5 and 6 show the stochastic efficiency scores obtained using the variables in S3 and S5 respectively. Both JOINTDEA and LLT models have been estimated for five probability levels.
Analyzing the results for all DMUs, we can observe that the efficiency scores obtained by JOINTDEA model are always lower then those produced using LLT model with normal distribution assumption on stochastic variables. This is an interesting result and we can conclude that the efficiency evaluation by JOINTDEA model seems to be more reliable than that made by LLT model with a higher deiscrimenting power. As we expected, high variations in results is reported for random variables for which the normality hypothesis is not acceptable.
For example Figure 7 displays, for Screening Unit FR, efficiencies scores for increasing probability level α obtained by the JOINTDEA model (configuration S3) and the LLT model.
It can be seen that the two models produce different efficiency scores. In particular, the scores produced by JOINTDEA model are the lowest.
Since the models give different efficiency scores, they calculate different target (efficient) levels for utilized resources. We finally note that both JOINTDEA and

Figure 4. Comparative results with and without the hypothesis of correlation inter DMU for DMU.

Table 3. Combination of inputs and outputs used for the instances.
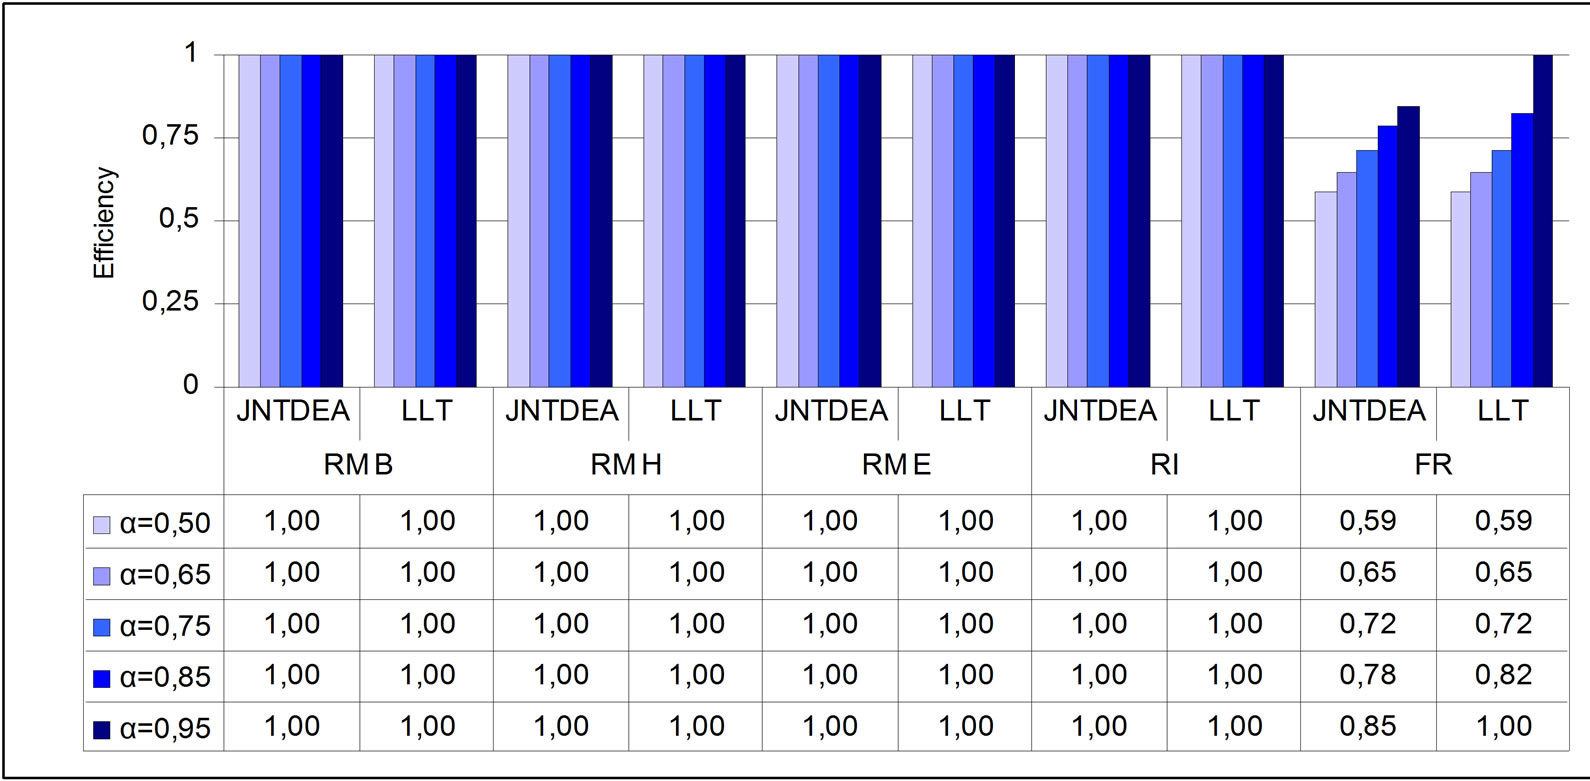
Figure 5. Comparative results for the S3 model.
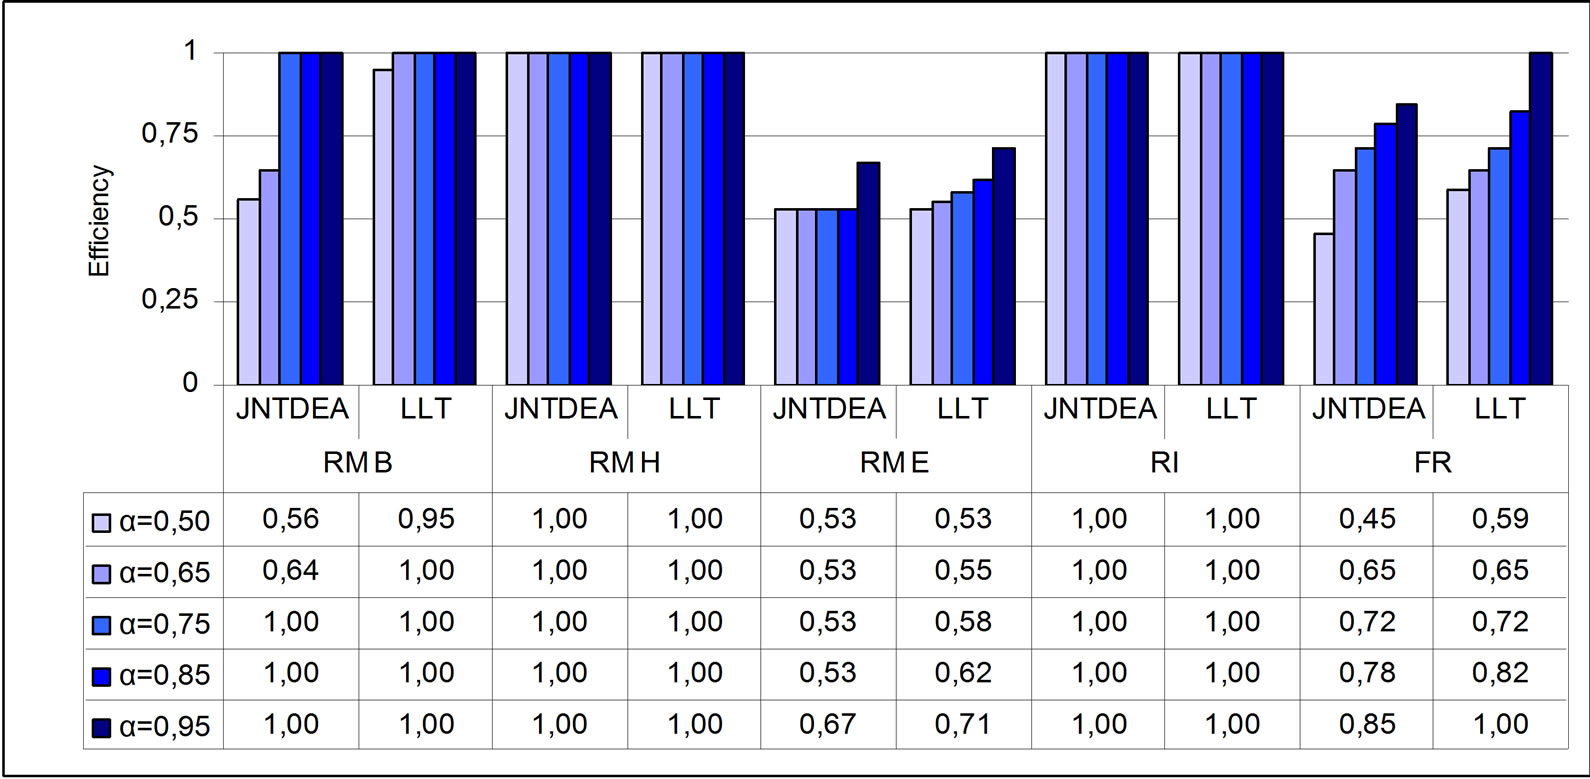
Figure 6. Comparative results for the S5 model.

Figure 7. Results obtained considering the input/output combination S3.
LLT models produce the same efficiency indexes for DMUs for which the normality hypothesis is reasonable (for instance see Screening Unit RM H).
3. Conlcusions
The research described in this paper enabled us to address a number of emerging issues concerning the evaluation processes of breast cancer screening. This research has allowed for in-depth examination of screening outcomes and identification of targets for improving care management.
The aforementioned analysis has shown that the use of nonparametric stochastic efficiency evaluation tool may suffer from the normality assumption made on the random variables. To achieve this aim, the main contribution of this paper can be stated in terms of the novel development of DEA techniques and, as far as the health care perspective is concerned, in the use of outcome measures as final outputs.
The applicability of the model was illustrated in the context of the analysis of screening units’ activity.