Adsorption Enthalpy Calculations of Hydrogen Adsorption at Ambient Temperature and Pressures Exceeding 300 bar ()
1. Introduction
One major challenge hindering the use of hydrogen in on-board vehicular applications is overcoming the low volumetric energy density of hydrogen at ambient conditions (0.0107 MJ/L) [1]. In order to match the energy density of gasoline (31.1 MJ/L) [1], hydrogen at ambient temperature must be compressed to a pressure greater than 5 kbar. While this pressure is extremely impractical for vehicular applications, prototype fuel cell vehicles do operate at pressures up to 700 bar. The use of high-pressure compressed hydrogen requires relatively expensive and large, cylindrical tanks that occupy a significant amount of cargo space [2,3]. An alternative approach to achieve a high-energy density is to use high specific surface area materials in which hydrogen is reversibly adsorbed on the surface without any chemical change or bonding [4]. Research into these materials has focused on increasing the specific surface area, optimizing pore geometry, and increasing the adsorption energy. In particular, the adsorption energy for most materials is between 4 and 7 kJ/mol [5]. Numerical estimations have shown that an adsorption energy between 12 and 20 kJ/mol will be necessary for ambient temperature operating conditions [5,6].
There are several pathways to increase the adsorption energy in microporous materials. One is by changing the width of the pore to create an overlapping adsorption potential. This is achieved by adjusting the activation parameters in activated carbons [7] or by adjusting the length of the linker in metal-organic frameworks (MOFs) [8]. The adsorption energy can also be increased by creating inhomogeneous charge distributions in the adsorbent surface. In metal-organic frameworks (MOFs), focus has been given on producing partially coordinated secondary building units (SBU) [5,9,10] while work in carbonaceous materials has focused on the use of heavy or light metal doping [6,11,12].
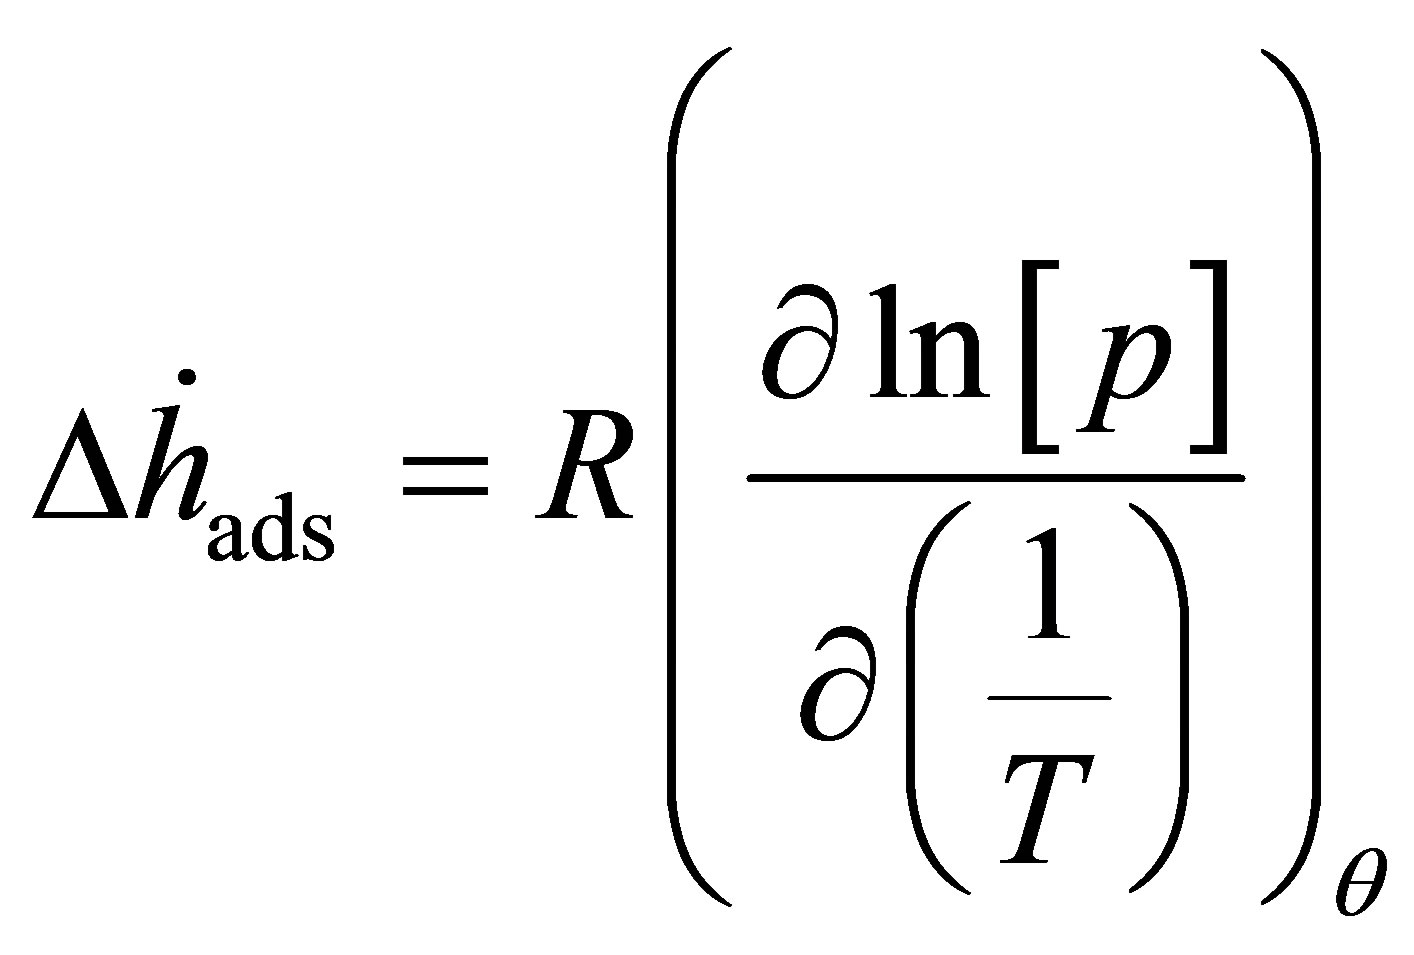
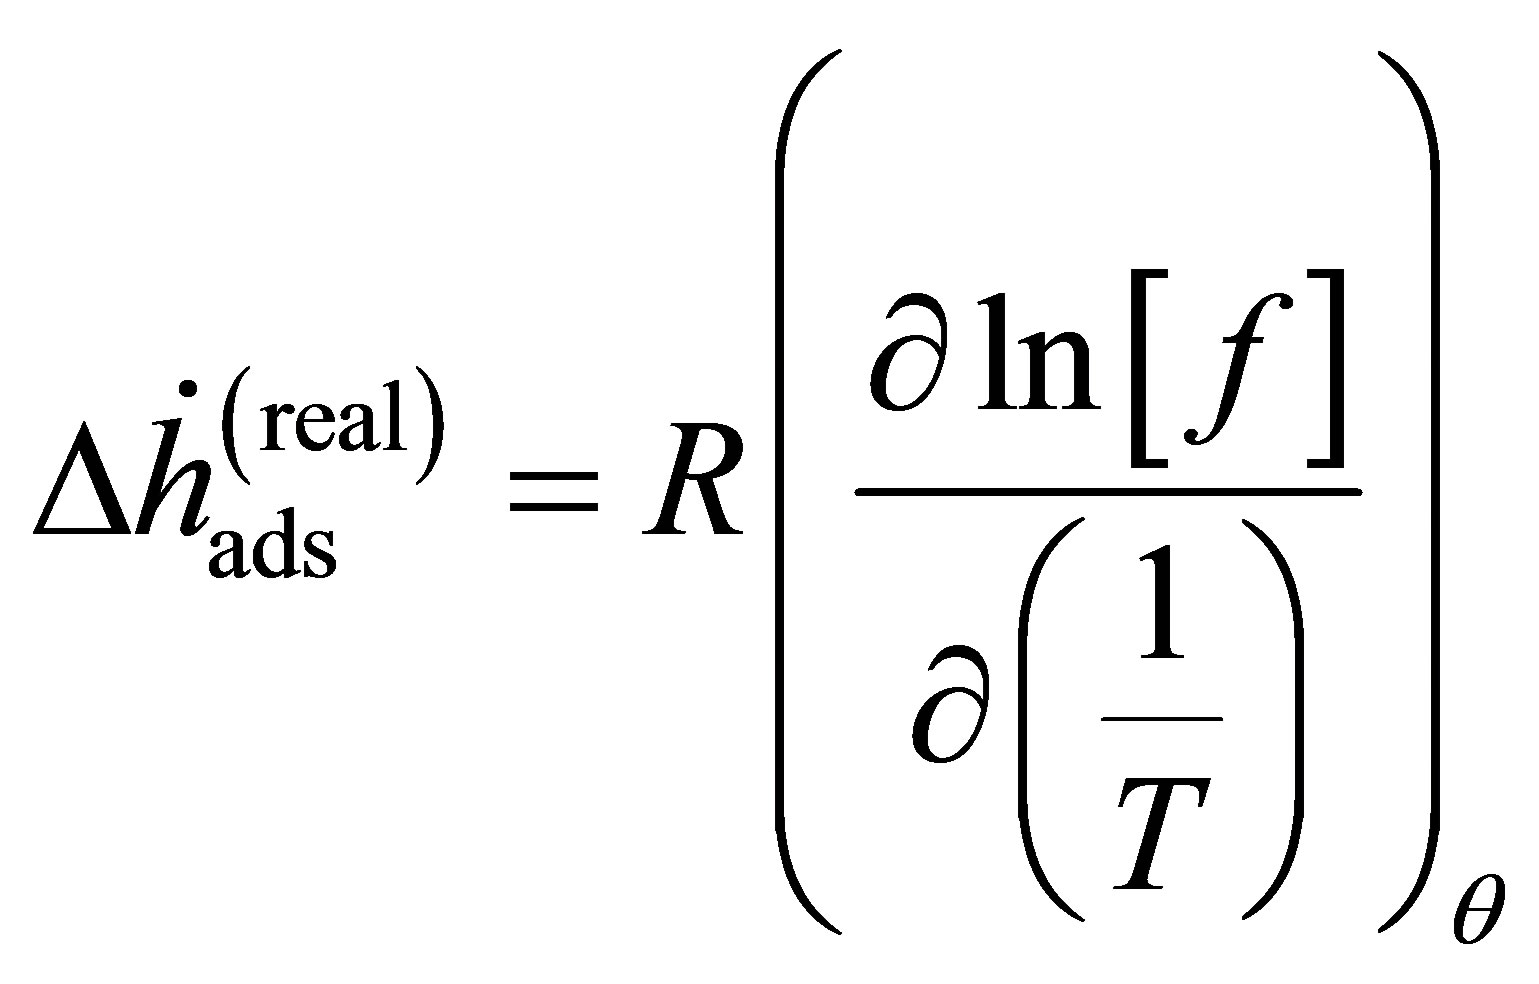
Regardless of the method used to make materials with higher adsorption energies, it is necessary to experimentally verify the adsorption energy. The adsorption energy may be measured directly using calorimetry, but the most common method is the so-called isosteric method. The isosteric method employs a form of the van’t Hoff equation [13,14]
 (1)
(1)
to measure the adsorption enthalpy  and involves measuring several adsorption isotherms at different temperatures. Lines of constant surface coverage θ (isosteres) are graphed as
  vs.
vs. .
.
In this paper, we use experimental data at ambient temperature and high-pressure for three benchmark materials to calculate the adsorption enthalpy. We show that careful consideration must be taken before applying Equation (1) to high-pressure data, and that a single isotherm can be used if an appropriate adsorption model is selected. Additionally, we show that volumetric storage for these benchmark materials is only a marginal improvement, at best, over compressed hydrogen and that excess adsorption must be increased to improve storage capacity.
2. Materials
Three benchmark adsorbent materials were used for this study. MSC-30 is an activated carbon produced from petroleum coke by Kansai Coke and Chemicals Co. Zn4O (1,3,5-benzenetribenzoate)2 (Zn4O(btb)2; MOF-177) is a MOF consisting of tetragonal [Zn4O]6+ SBUs connected by tricarboxylate ligands. This sample of Zn4O(btb)2 was synthesized at pilot scale by BASF as Basolite Z377. Cu3(1,3,5-benzenetricarboxylate)2 (Cu3(btc)2; HKUST-1) is a MOF with copper paddlewheel SBUs connected by btc ligands. In contrast to Zn4O(btb)2, Cu3(btc)2 has open metal sites. Cu3(btc)2 is commercialized by Sigma-Aldrich as Basolite C300. All MOFs were stored in an argon glove box. All samples were degassed at 120˚C for 12 hours prior to adsorption measurements.
3. Materials Porosity Characterization
Subcritical argon isotherms were measured using an Autosorb-1 (Quantachrome Instruments). BrunauerEmmett-Teller (BET) surface areas were measured using the pressure range of 0.03 - 0.1 P/P0. The measured surface areas of the MOF samples (Table 1) were similar to previously measured values [5], indicating that the material porosity was well activated and the remaining solvent was completely removed. The specific pore volume  was measured at 0.995 P/P0 by assuming liquid density within the pores. The specific pore volume includes only void volume within individual grains and does include any intergranular void space.
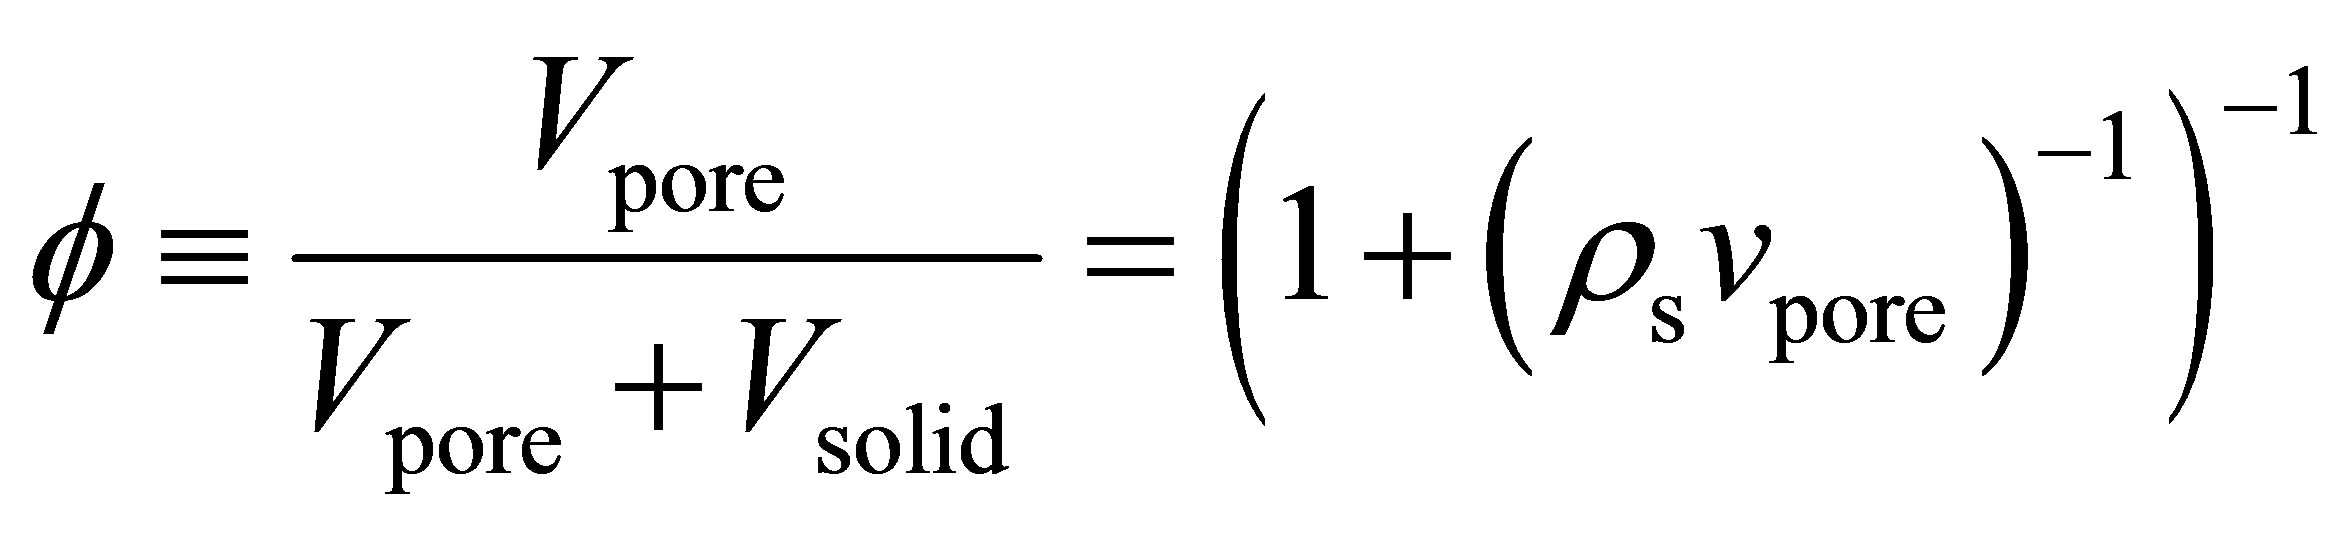
Using the specific pore volume and the measured skeletal density , the void fraction
  was calculated using the following equation [7]
 (2)
(2)
where  is the total volume of pores for a given volume of adsorbent
 . Micropore volumes were determined using the Dubinin–Radushkevich (DR) method. Pore size distributions (PSD) were calculated using the nonlocal density function method. For Zn4O(btb)2 and Cu3(btc)2, it was assumed that the samples contained both cylindrical and spherical pores. MSC-30 was assumed to have slit shaped pores. PSDs for the materials are shown in Figure 1. All of the pores in Cu3(btc)2 are less than 12 Å due to the short btc ligand. The larger btb ligand used in Zn4O(btb)2 resulted in wider pores.
The activated carbon, MSC-30, has a PSD that is indicative of chemical activation in which metallic potassium from KOH, the activating agent, intercalates between graphitic sheets, causing micropore formation [7,15]. The larger (>12 Å) pores are formed by dehydration of KOH to K2O which reacts with CO2 to form potassium carbonate. Washing of the carbon after activation removes the intercalated potassium, potassium carbonate, and other residual products to leave the observed pore structure.
4. Hydrogen Adsorption Data
Hydrogen isotherms were measured at room temperature up to 320 bar using a custom-built volumetric adsorption instrument described previously [16,17]. Helium deadspace measurements were completed to determine sample skeletal density  (Table 2). It was assumed that the effects of helium adsorption were negligible. All hydrogen densities
  used for isotherm calculations were determining using the NIST REFPROP database (version 8.0).
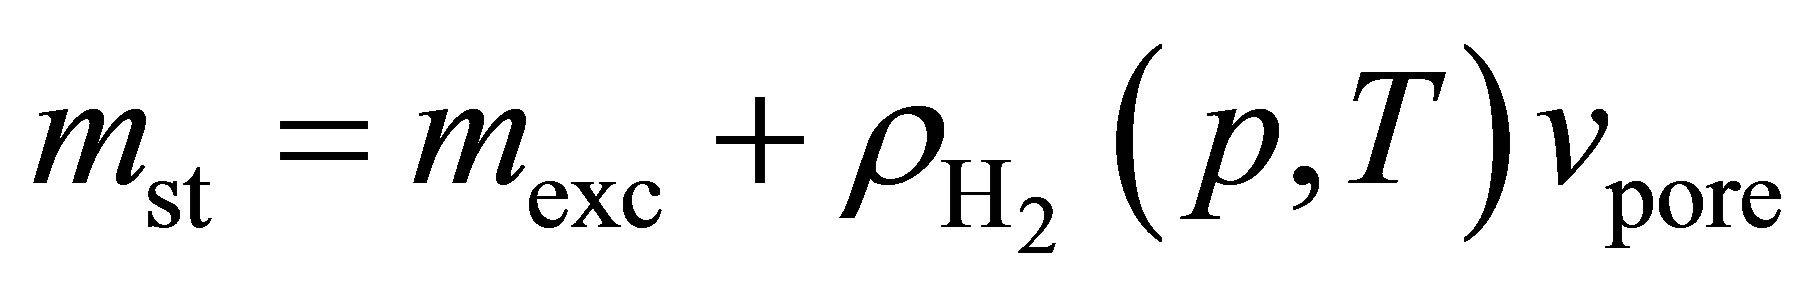
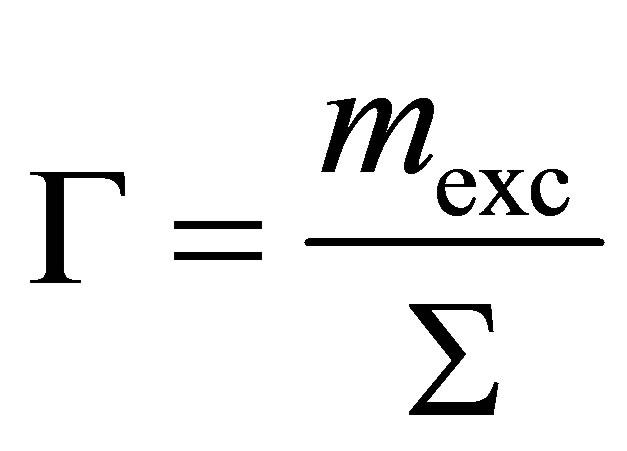
Hydrogen excess adsorption isotherms are shown in Figure 2 top. The gravimetric storage  [g H2/g Sample] and volumetric storage vst [g H2/L Sample] were calculated from the excess adsorption isotherms mexc [g H2/g Sample] assuming a granular packing fraction of
Table 1. Summary of sample characteristics calculated from argon isotherms.
Figure 1. Differential pore volumes and cumulative pore volumes (inset) calculated from subcritical argon adsorption isotherms using non-local density functional theory for MSC-30 (black squares), Zn4O(btb)2 (red circles), and Cu3(btc)2 (blue triangles).
unity (i.e. disregarding gas stored between individual adsorbent grains). The gravimetric storage was therefore calculated using
 (3)
(3)
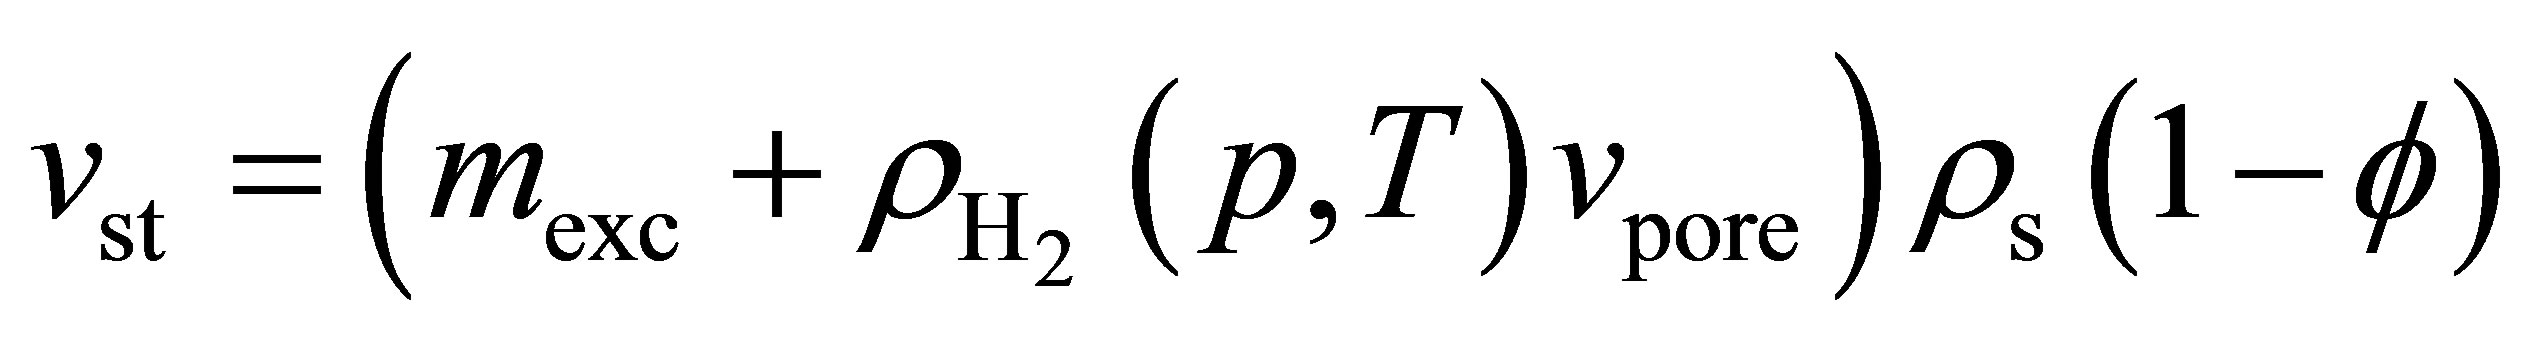
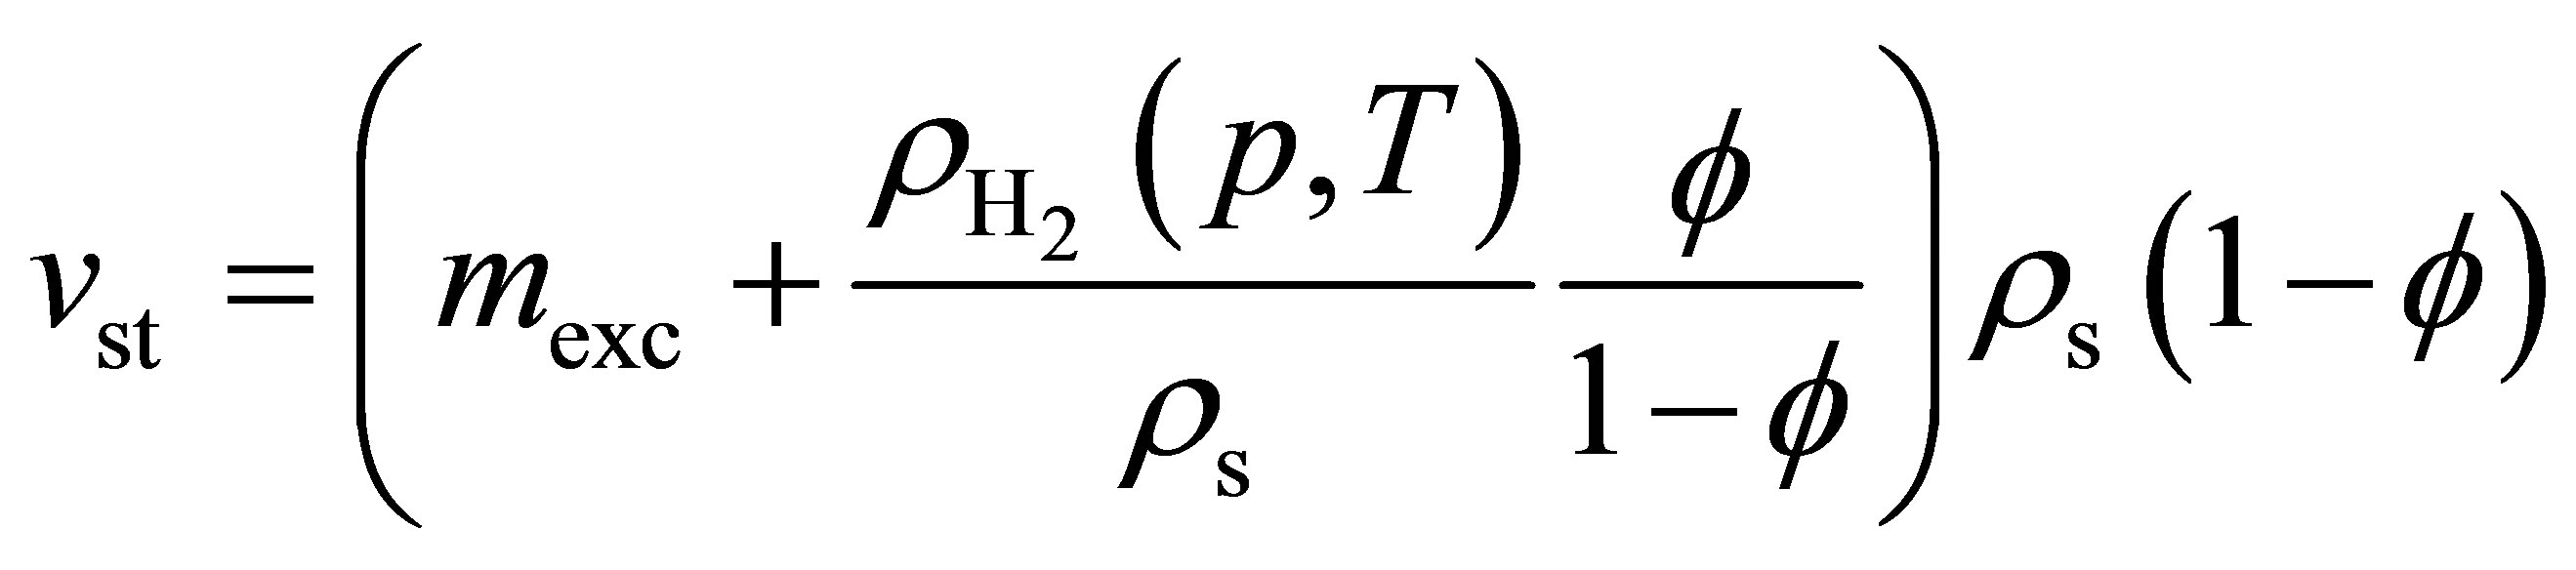
and the volumetric storage was calculated using
 (4)
(4)
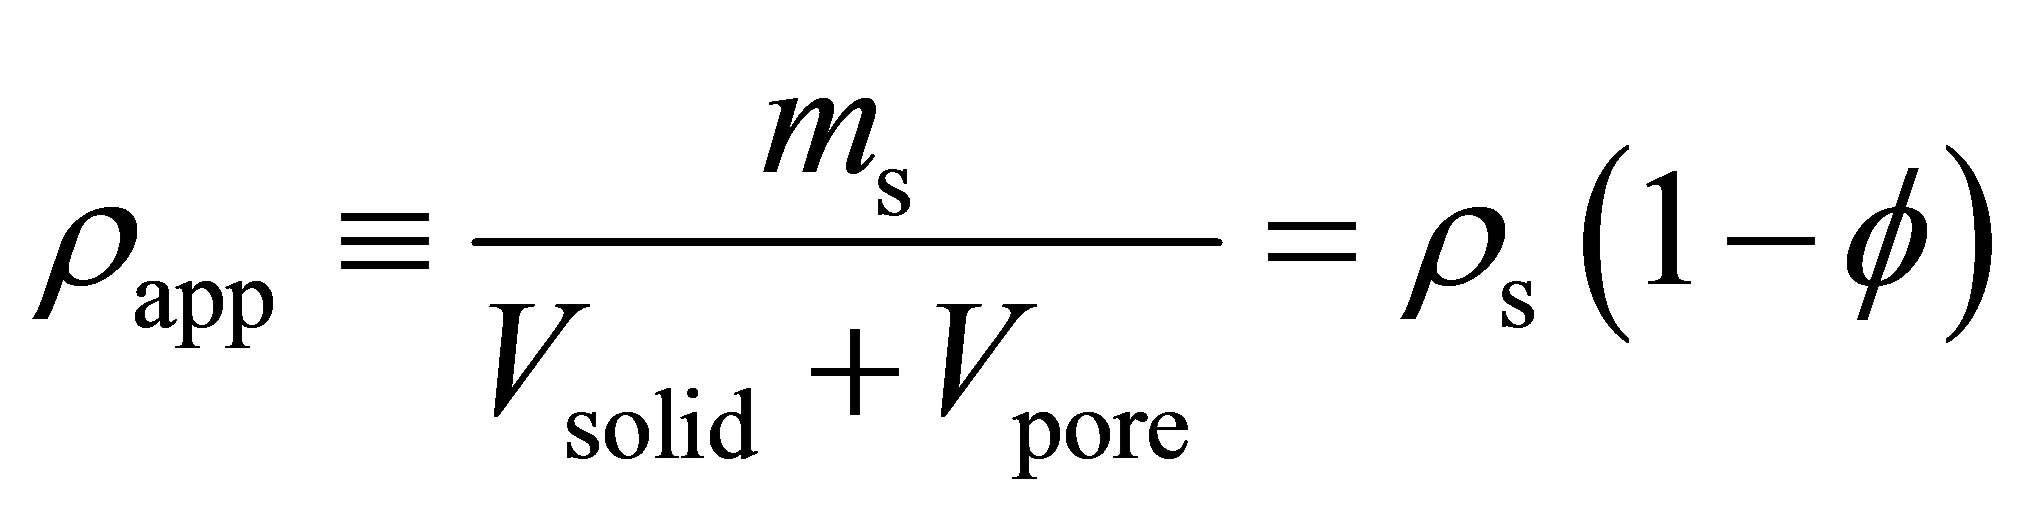
where  is the apparent density of the adsorbent. The apparent density is
 (5)
(5)
and
 (6)
(6)
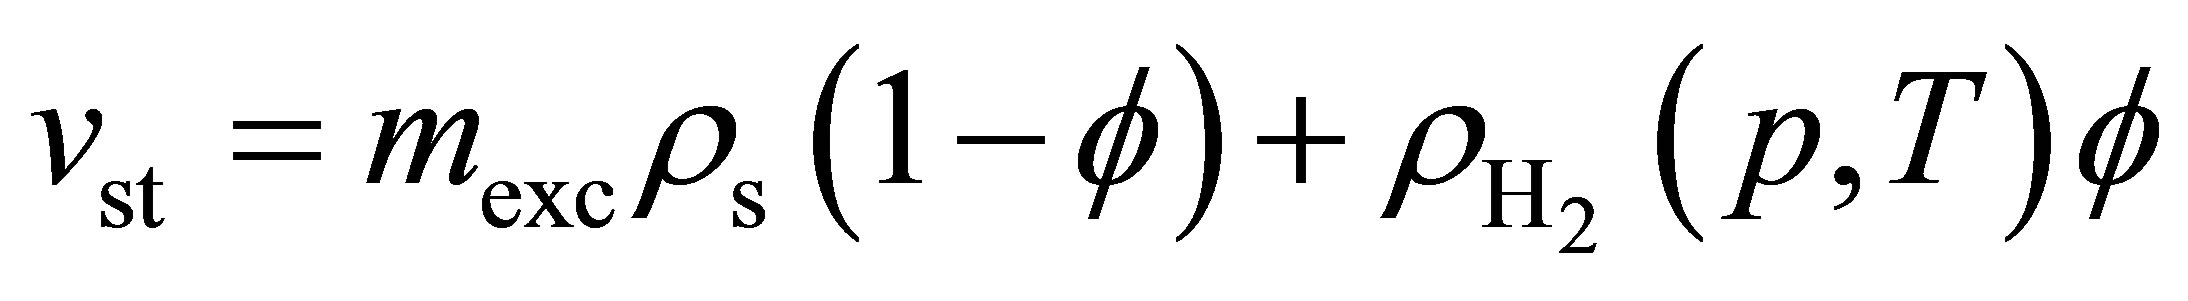
Alternatively, in terms of excess adsorption,
 (7)
(7)
 (8)
(8)
and
 (9)
(9)
Because Equation (3) does not include gas stored between powder grains, Equation (3) represents the theoretical minimum for the value of mst in a real tank.
In order for a material to store more hydrogen volumetrically than a compressed hydrogen tank, the excess adsorption must be greater than the amount of gas that would be present in the volume occupied by the adsorbent. In other words, it must be true that
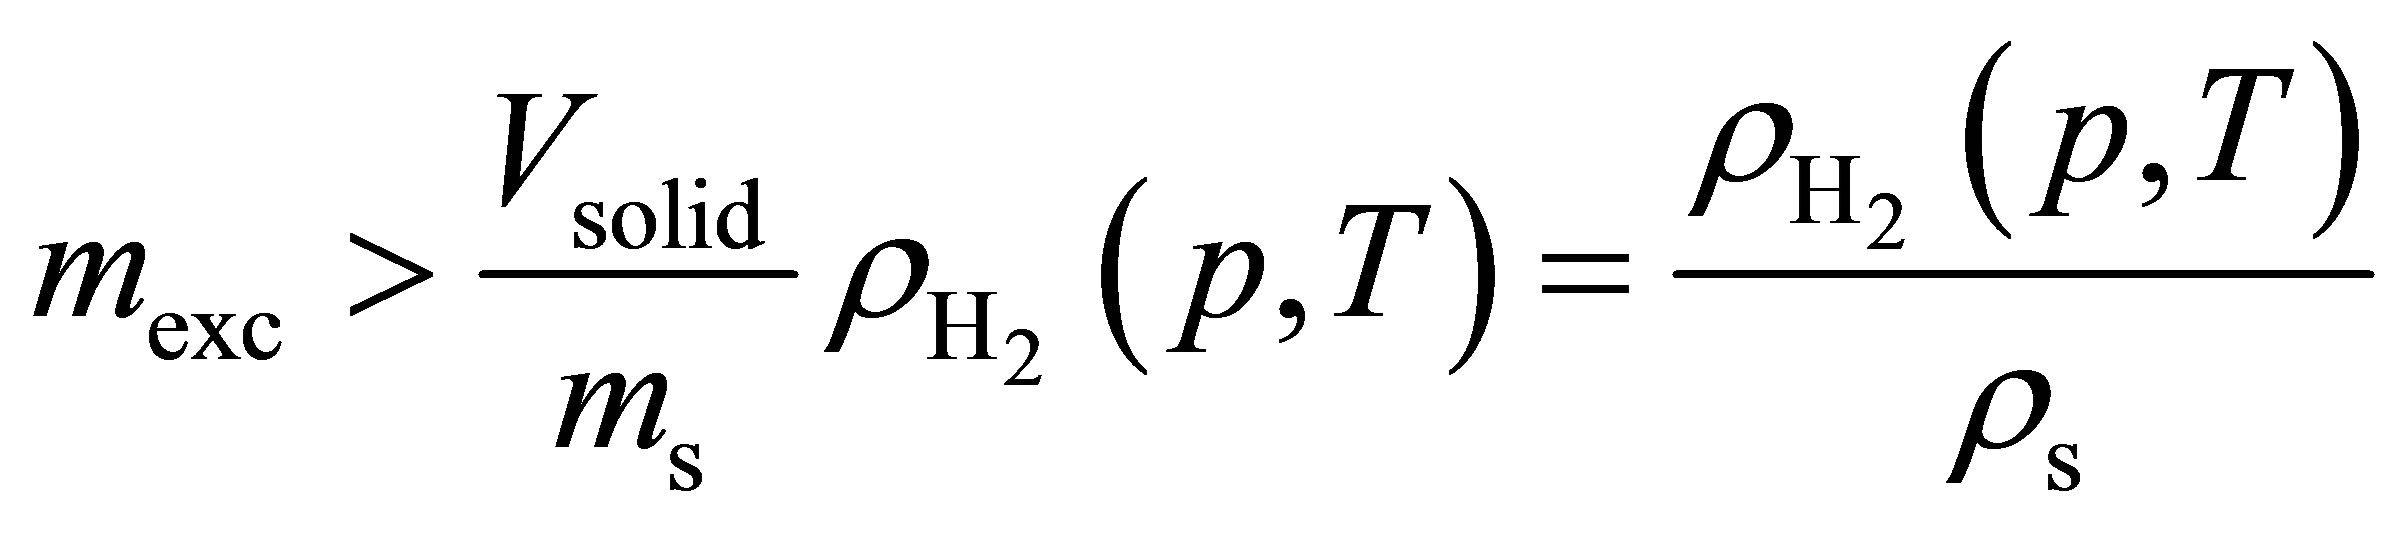 (10)
(10)
which is readily obtained from Equation (9). If the Inequality (10) is true, then including the intergranular space will decrease the volumetric storage capacity. However, if instead , then including the intergranular space will actually increase the volumetric storage capacity. In order to improve adsorbent systems over compressed hydrogen, it is paramount to increase the excess adsorption to as high a value as possible.
The volumetric storage capacities calculated from Equation (6) are shown in Figure 2(b). Only MSC-30 and Zn4O(btb)2 have volumetric storage capacities that exceed compressed hydrogen. At ambient temperature, hydrogen adsorption is relatively small effect. This is demonstrated in Figure 2(a) which shows that the difference between the excess adsorption and the right hand side of Inequality (10) is very small. For example, the ratio of the left-hand side of Inequality (10) to the righthand side for Zn4O(btb)2 at 75 bar is ~1.4. By sharp contrast, the same ratio for Zn4O(btb)2 measured at 77 K and 65 bar from [5] is ~5.2.
The large difference between 77 K and ambient temperature adsorption can be explained by examining the interactions in the adsorption system. In an adsorption system, the presence of an interaction between the surface and the gas creates a condensed gaseous film on the surface. The amount of compression at a given pressure will be balanced by the intermolecular repulsion of the gas so that the spacing of molecules on the surface is limited by the natural repulsion between gas molecules.
One way of quantifying this compressibility is by de fining a compressibility factor
Table 2. Summary of helium and hydrogen adsorption measurements.
 (11)
(11)
which is related to the virial coefficients  by
by
 (12)
(12)
By Equation (12), the compressibility factor is directly related to the repulsive and attractive interactions of the gas. The gas is non-interacting (ideal) for z = 1. If z < 1, then most interactions between gas molecules are attractive. If z > 1, then most interactions between gas molecules are repulsive. As shown in Figure 2(c), the compressibility factor is a smaller value at 77 K than at 297 K. This means that it is takes less energy to compress hydrogen into a denser state at low temperatures compared to room temperature. Therefore, the adsorption energy must be increased to overcome this extra repulsive energy.
5. Enthalpy Calculations
5.1. Surface Excess Concentration
One method of evaluating the strength of the adsorbent-gas interaction is by calculating the surface excess concentration  (SEC) from excess adsorption using
 (13)
(13)
where  is the BET surface area. The SEC is a measure of how closely spaced the adsorbed molecules are on the adsorbent’s surface and it is a good qualitative assessment of the adsorption energy. For microporous materials, the BET surface area can depend greatly upon the adsorbate used, because the measurable surface area is limited by the adsorbate’s molecular size.
When comparing SECs calculated for different adsorbents, the BET surface areas should be measured using the same adsorbate.
Calculated SECs for the three materials investigated are shown in Figure 3(a). Although Cu3(btc)2 has the lowest excess adsorption, it also has the highest SEC. For the Zn4O(btb)2, the adsorbed hydrogen molecules are not as closely spaced indicating that either it has a relatively low binding energy or that only some of the available surface area contributes to the hydrogen adsorption. Because the SEC is only a qualitative assessment of the adsorption energy, the actual adsorption enthalpy, Equation (1), must be calculated to quantify the behavior exhibited in the SEC.
5.2. Non-Ideality Corrections
Equation (1) is derived for an ideal gas. However, at higher pressure, deviations from ideal gas behavior can be significant. For instance, the difference in density between ideal gas hydrogen and real hydrogen at 300 bar and 296 K is nearly 20%. Noting that, for an ideal gas, the fugacity f is equivalent to the pressure, Equation (1) may be applied to a real gas by substituting the fugacity in place of the ideal gas pressure [18,19]
 (14)
(14)
or in terms of the fugacity coefficient  and the real gas pressure
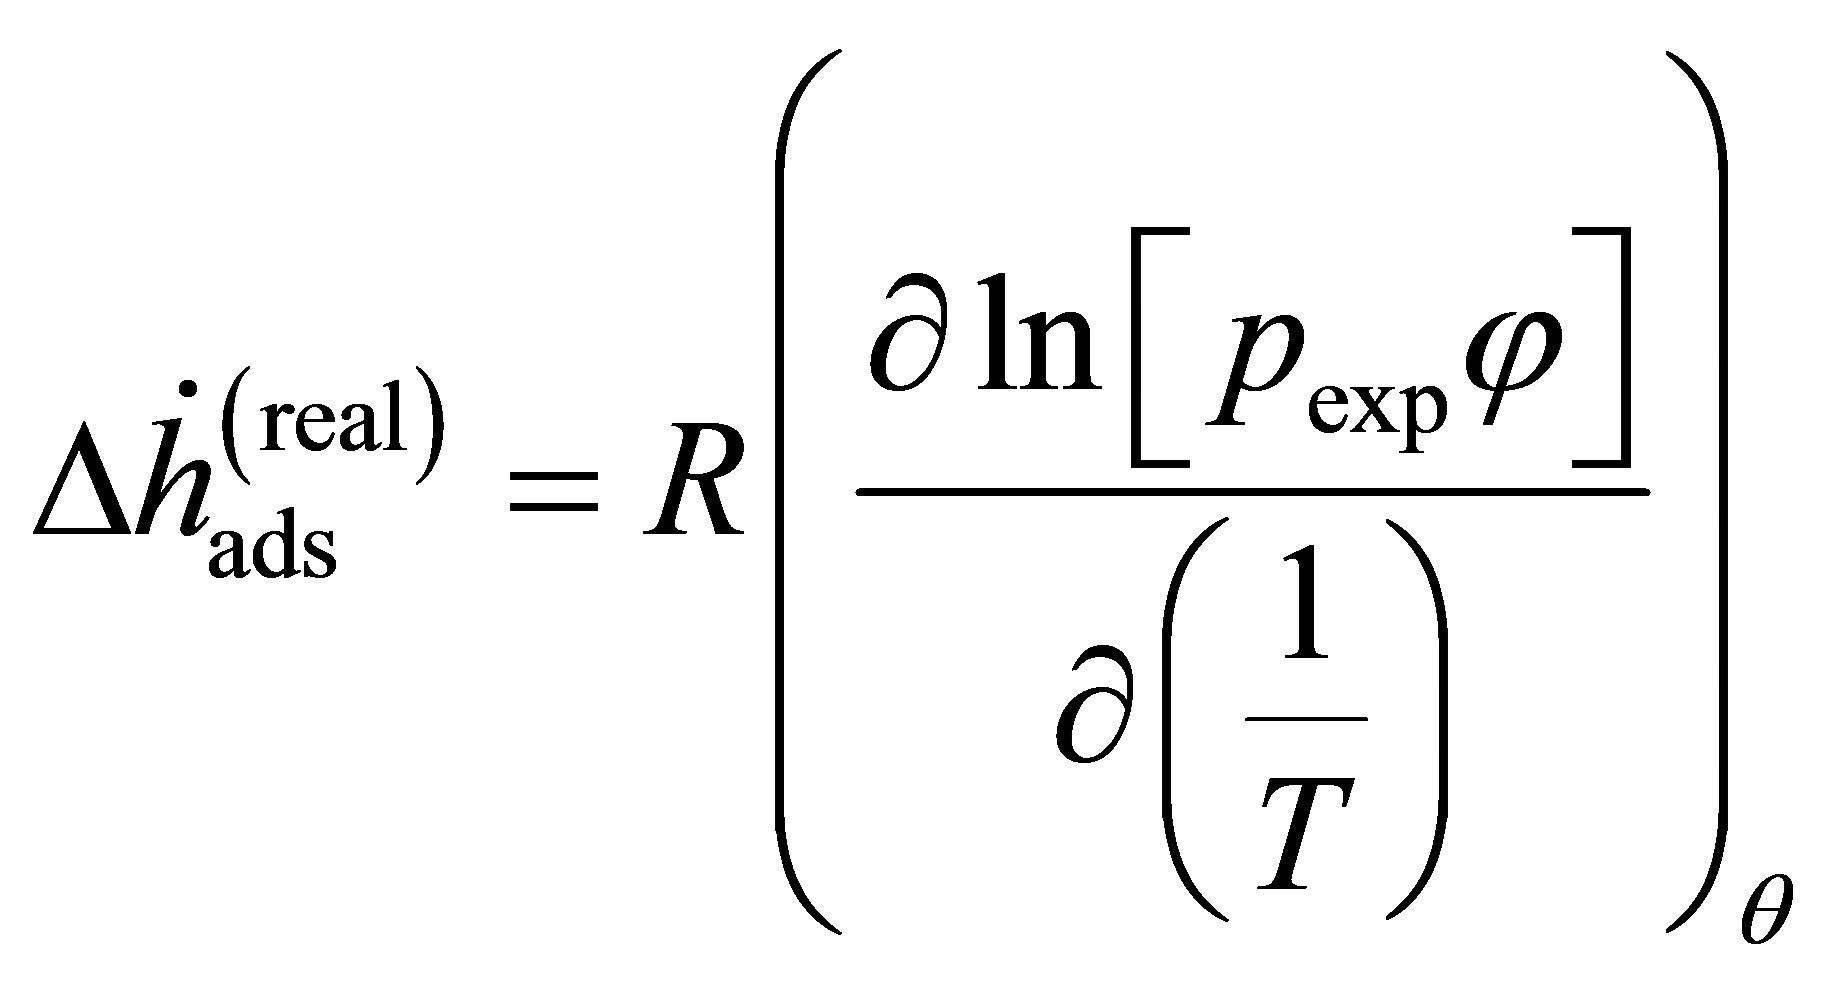 (15)
(15)
It follows that the natural logarithm may be split into two parts
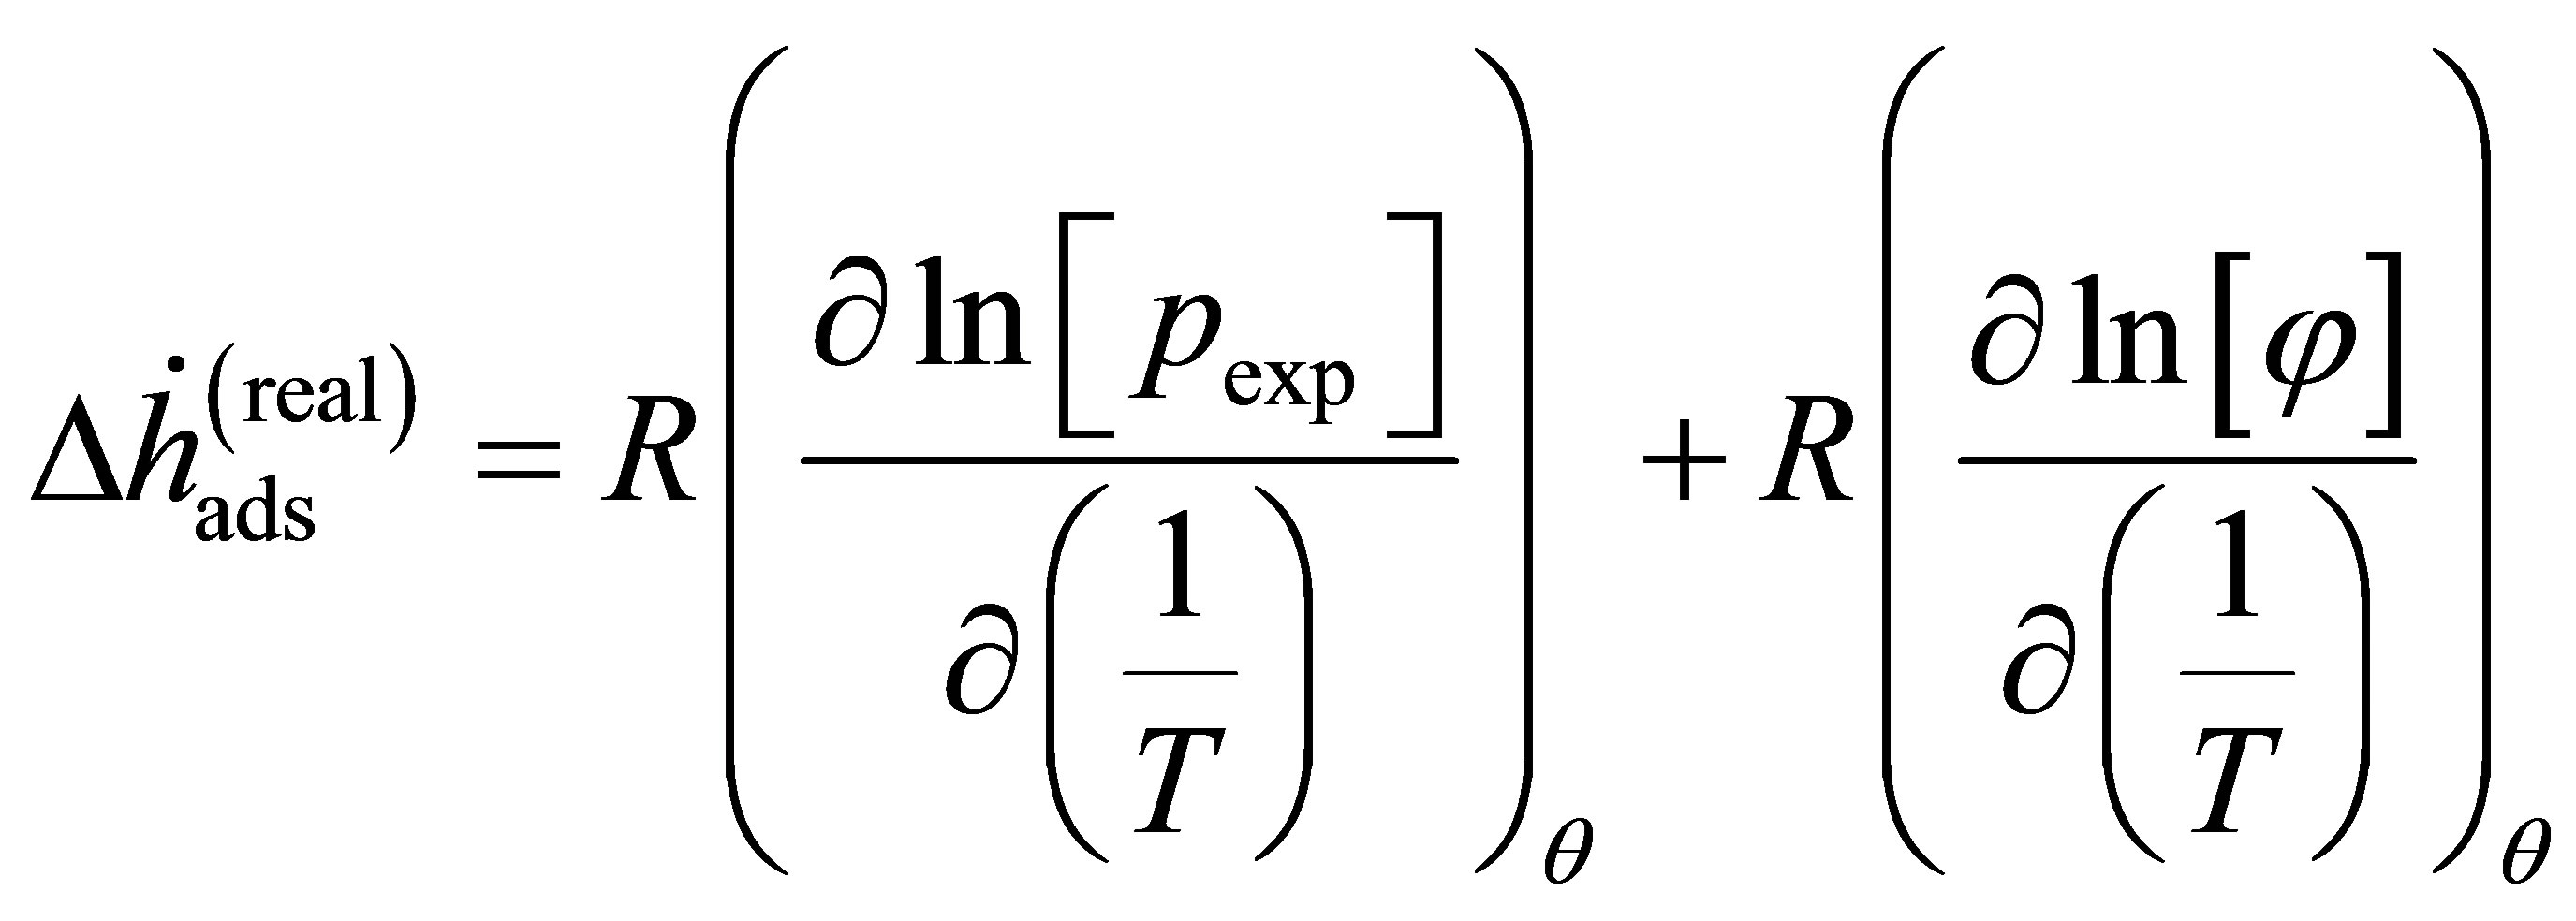 (16)
(16)
 (17)
(17)
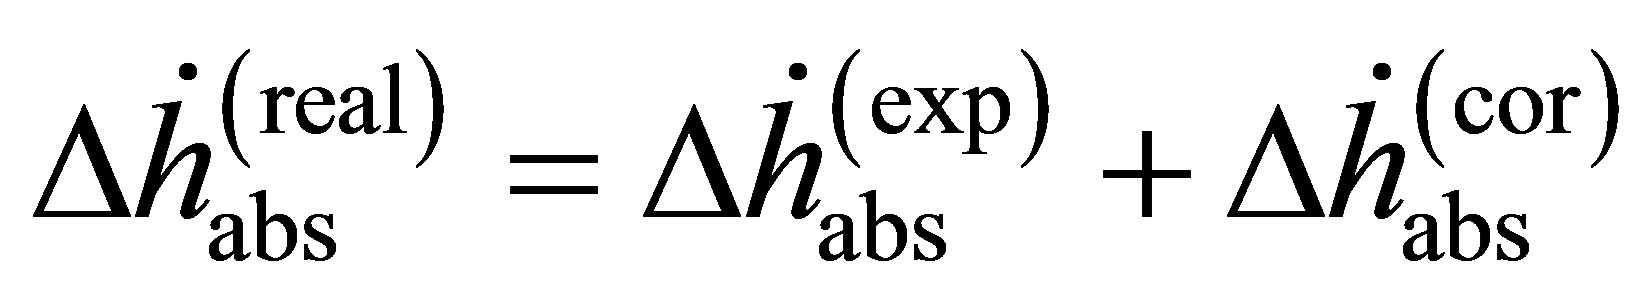
where the enthalpy  is Equation (14) assuming that the real gas is an ideal gas and the correction enthalpy
  is an additional term that is a function of the fugacity coefficient and temperature. The correction enthalpy is the difference between using the experimental data as a function of the fugacity and using it as a function of the pressure.
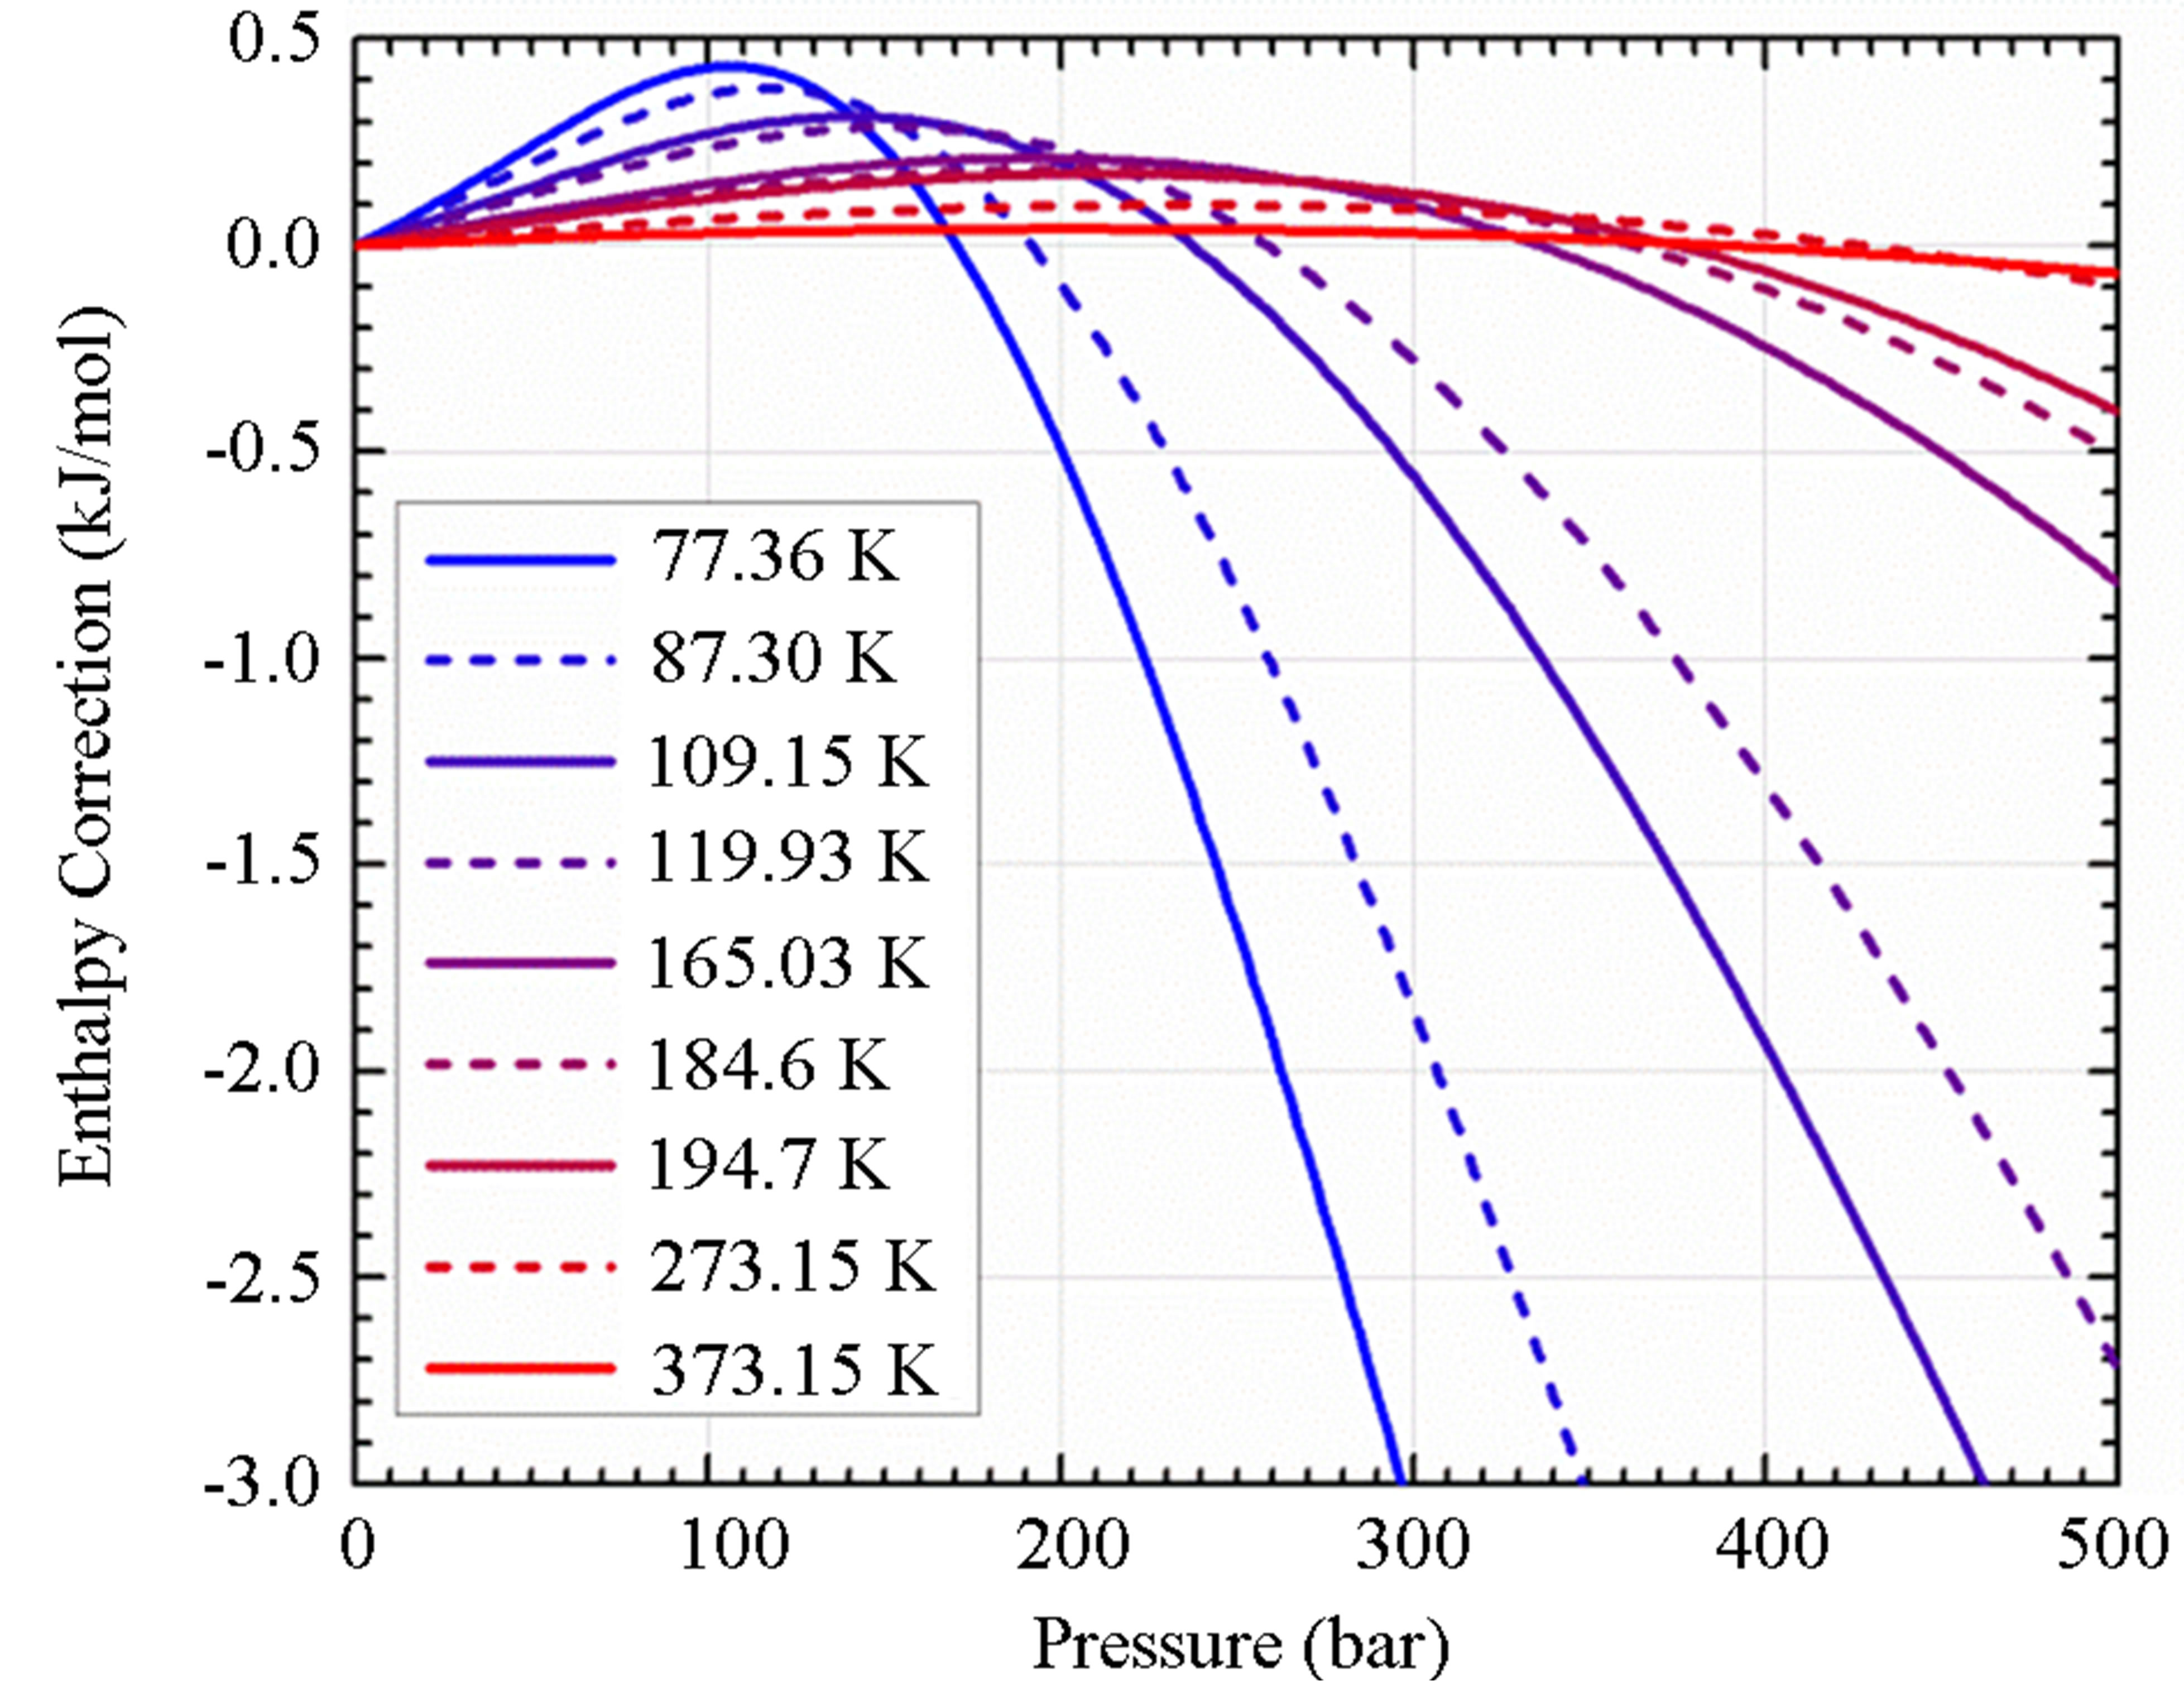
The correction enthalpy may be calculated using fugacity coefficients determined using an appropriate equation of state (EOS) [20]. The fugacity coefficients as a function of temperature and pressure were calculated using an empirically derived EOS for hydrogen given by [21]. As shown in Figure 3(b), near ambient temperature, the correction to the ideal gas equation is small (<0.1 kJ/mol). It is not until low temperature and high pressure that the correction becomes significant. This is extremely important because if the real pressure is used without
 (a)
(a)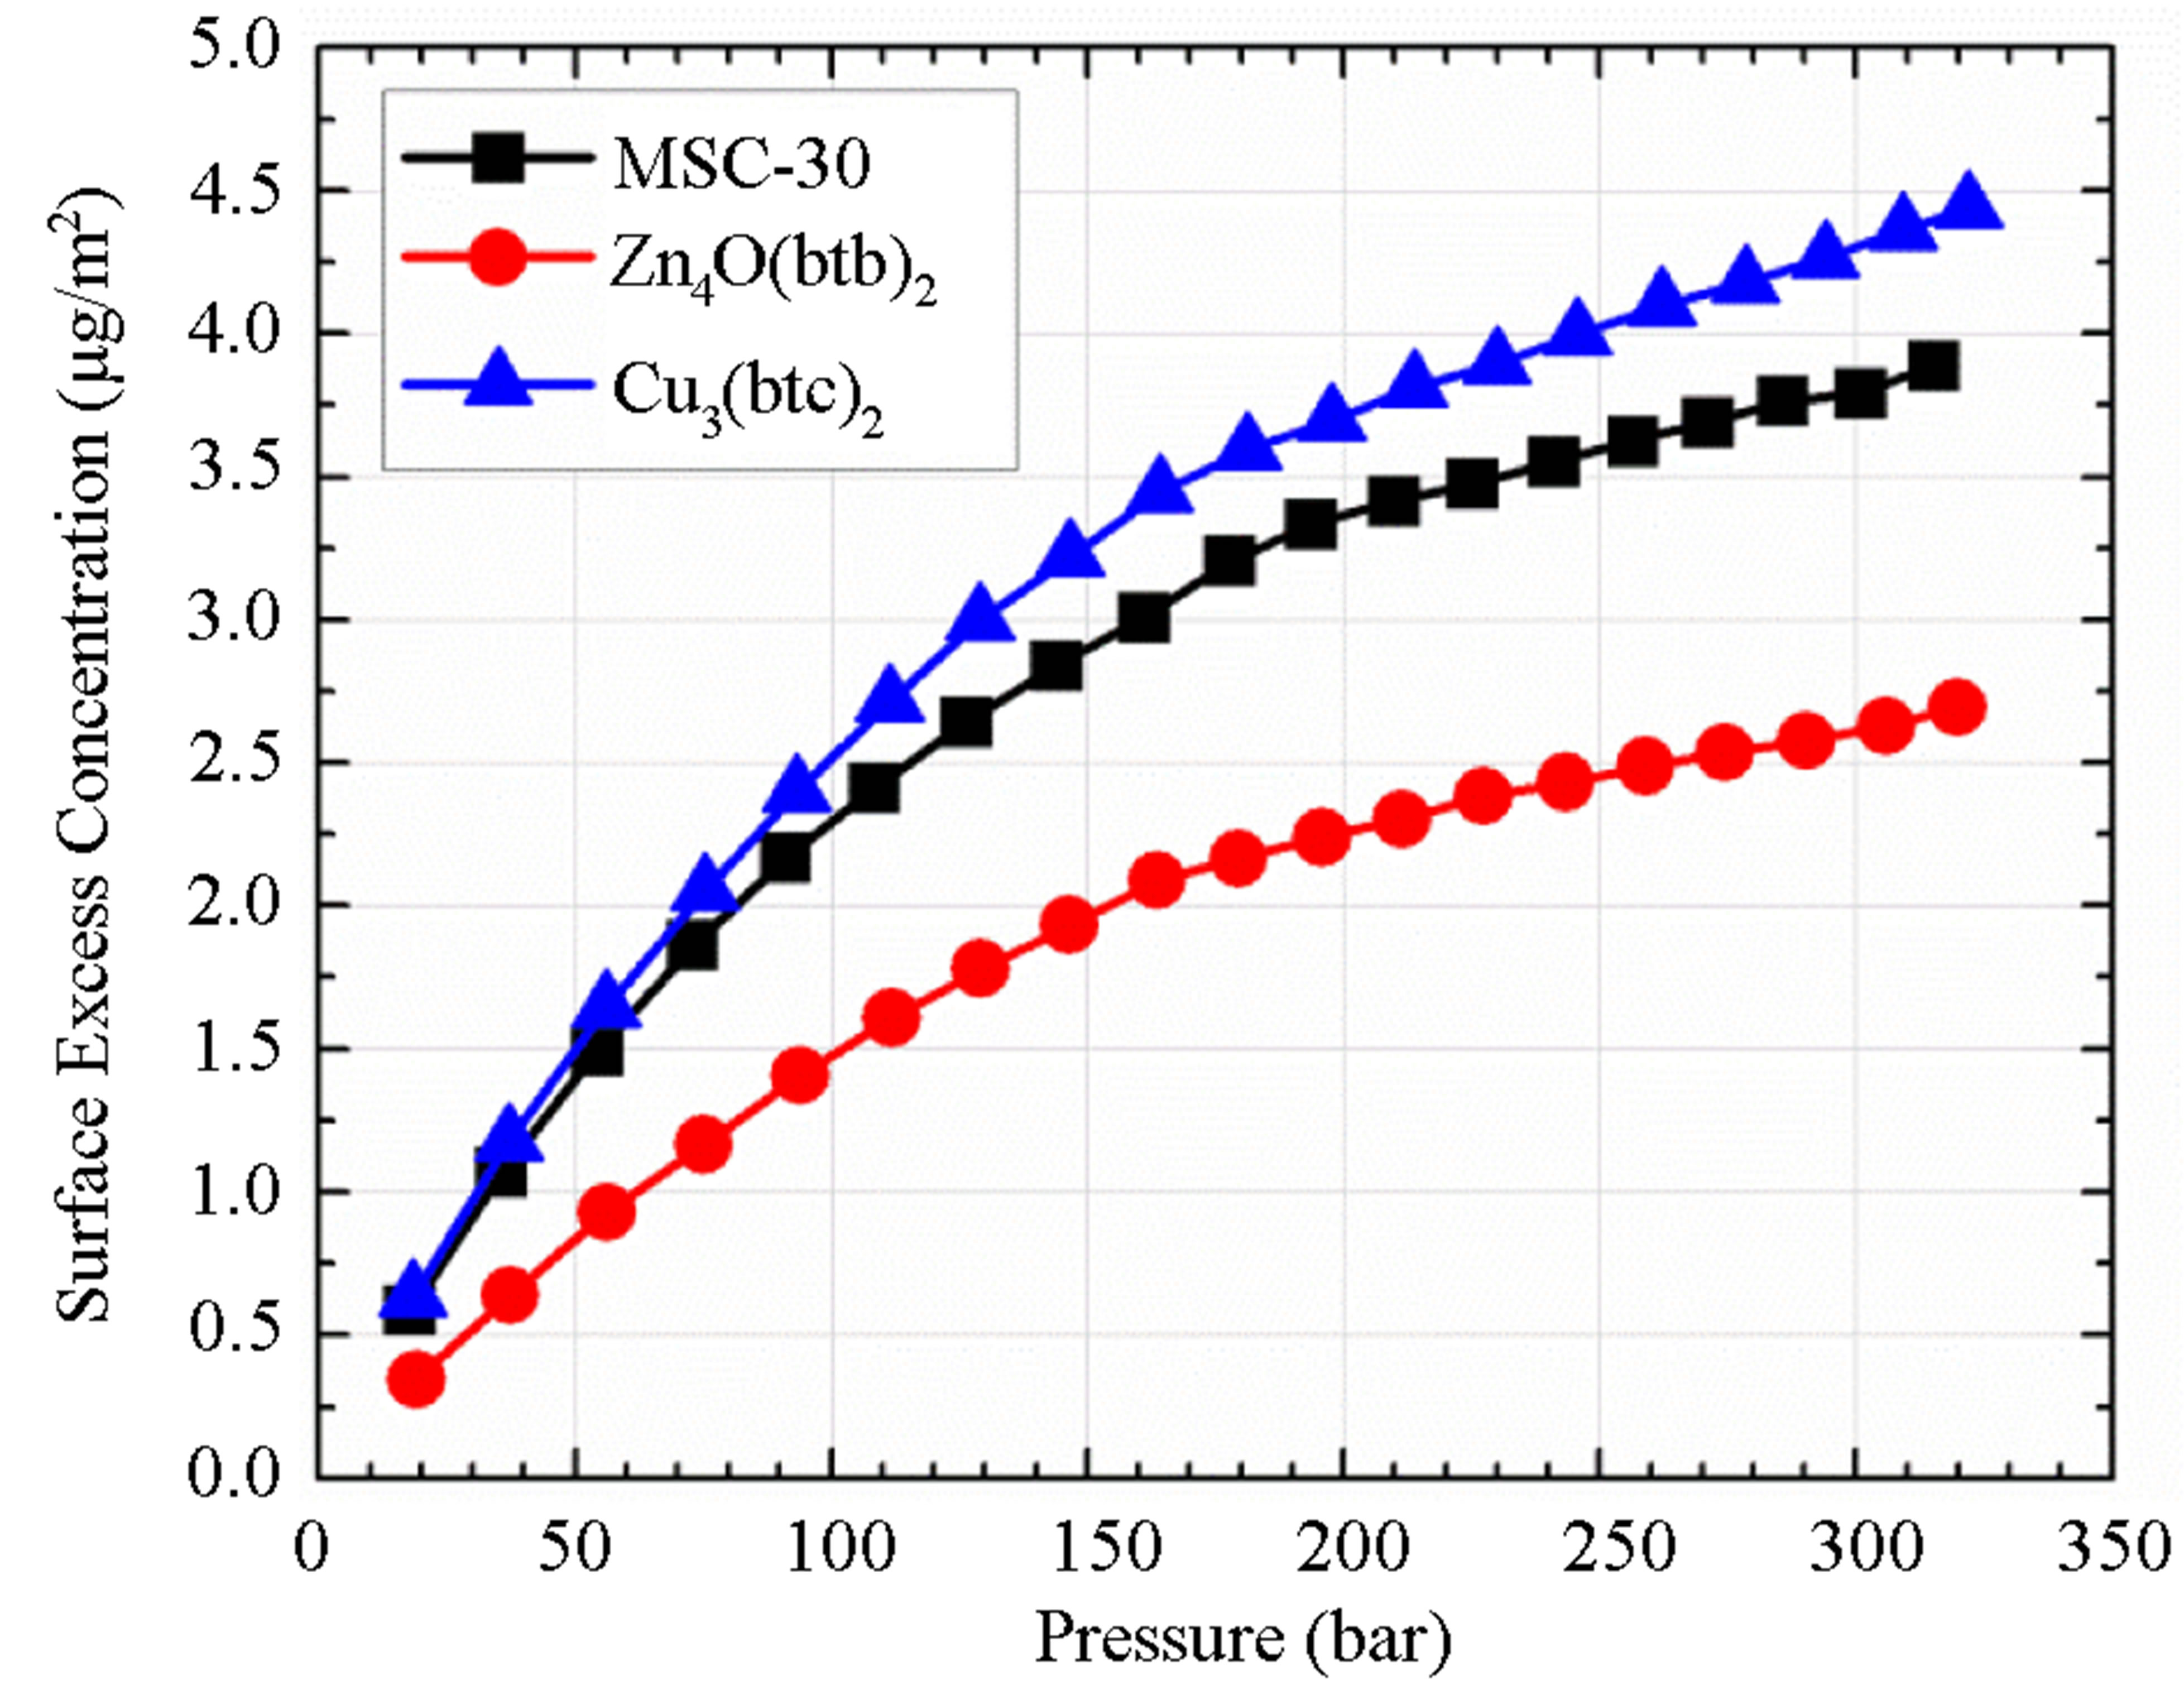 (b)
(b)
Figure 3. (a) surface excess concentration for all materials measured indicating the packing density of adsorbed molecules on the surface and (b) the correction to the adsorption enthalpy  required to account for non-ideality of hydrogen. The temperatures shown here are the normal boiling points of several gases (from lowest to highest temperature): N2, Ar, CH4, Kr, Xe, C2H6, CO2 (sublimation), H2O (melting point), and H2O (boiling point).
correcting for the gas’s non-ideality, any calculated enthalpy will be overestimated at high pressure.
It is an important distinction that Equation (14) can apply to either excess adsorption or absolute adsorption, but the two are not thermodynamically equivalent. At low temperature and pressure, where excess and absolute adsorptions are approximately equal, the two enthalpies are also approximately equal. However, as Mertens described [22], at high pressure or temperature the difference can lead to huge discrepancies. Adsorption enthalpies calculated from excess adsorption should be referred to as “isoexcess” enthalpies to avoid confusion [23]. Since measured adsorption isotherms are given in terms of excess adsorption, absolute adsorption must be calculated before using Equation (14).
5.3. Absolute Adsorption
Excess adsorption is defined in terms of the total mass of hydrogen in the system per mass of adsorbent m, the hydrogen density, the volume available to the hydrogen per mass of adsorbent v0
 (18)
(18)
If one excludes all molecules that are at the density , then Equation (18) is instead
 (19)
(19)
and
 (20)
(20)
Here,  is the volume occupied by the adsorbed film per mass of adsorbent (
 )
)
Numerous ways of determining  have been suggested [24-27]. We have chosen here to use the specific pore volume
  as measured by subcritical argon isotherms. Assuming that the volume accessible to argon is equal to the volume accessible to hydrogen, then
  represents the largest possible value of
  and it gives the upper limit to the possible values of the absolute adsorption. When calculated in this way, the absolute adsorption is equivalent to the gravimetric storage.
5.4. The Dubinin-Astakhov Model
Before Equation (14) may be applied to the calculated absolute adsorption, the data must be fit with a temperature dependent adsorption model. Here we use the Dubinin-Astakhov (DA) model of micropore filling. The model has been described previously [13,14,28], but we summarize it here. The DA model for absolute adsorption is given by
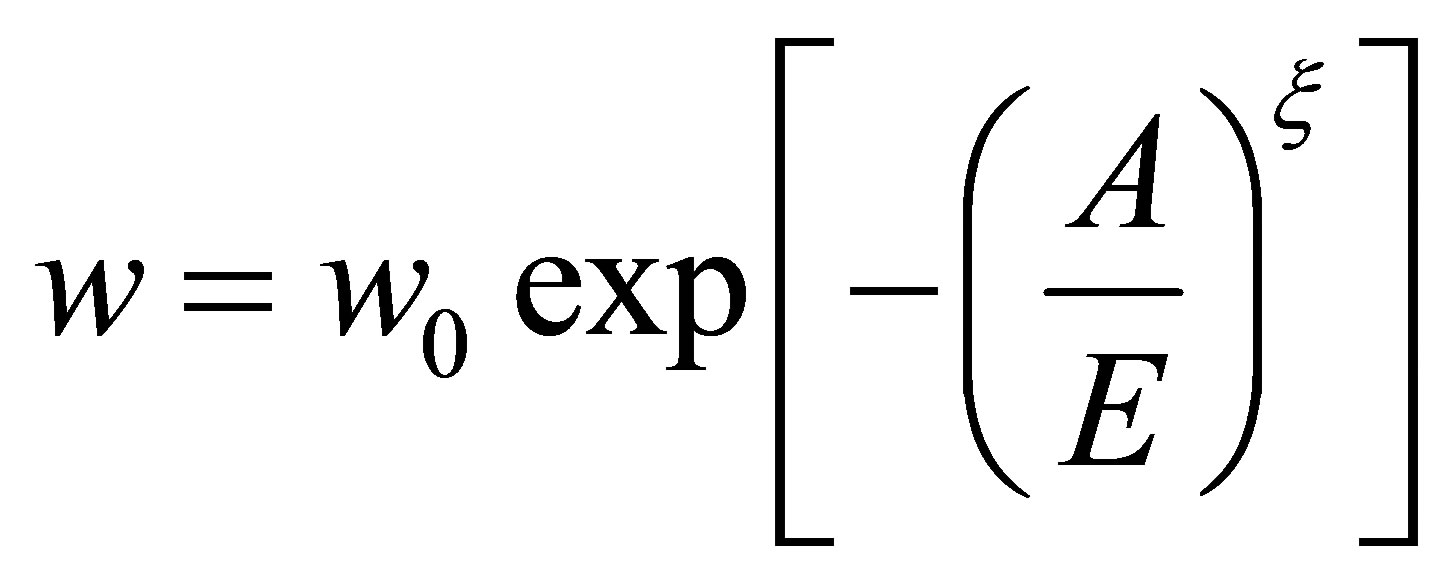 (21)
(21)
where w is the volume of hydrogen adsorbed, w0 is the micropore volume, E is a temperature and pressure independent characteristic energy of the gas-adsorbent system, A is the adsorption potential, and  is a structural heterogeneity factor [28]. The adsorption potential A is given by [14,28]
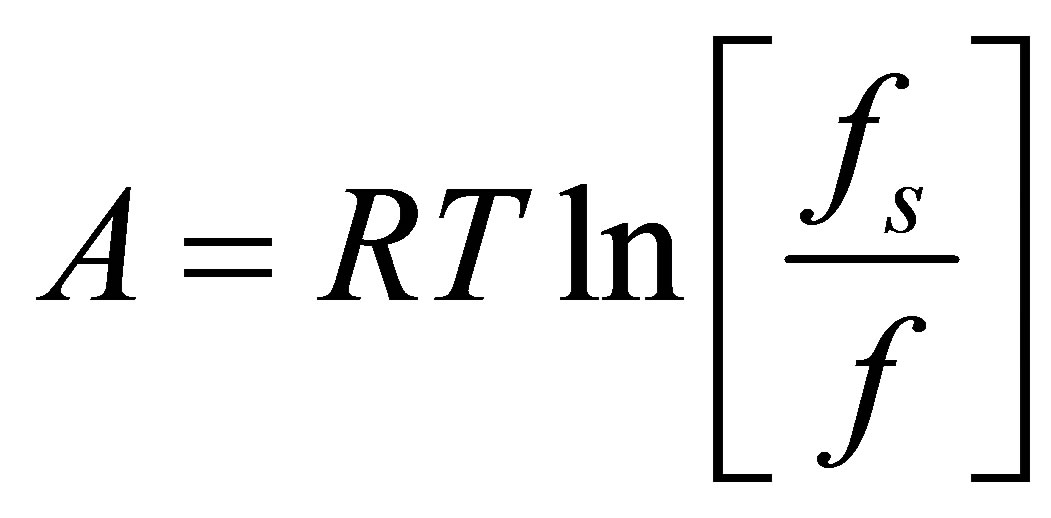 (22)
(22)
where fs is the fugacity at saturation. For supercritical adsorption, such as hydrogen at ambient temperature, the saturation fugacity is ill-defined. A pseudo-saturation fugacity must be defined, such as was suggested by Amankwah and Schwarz [28],
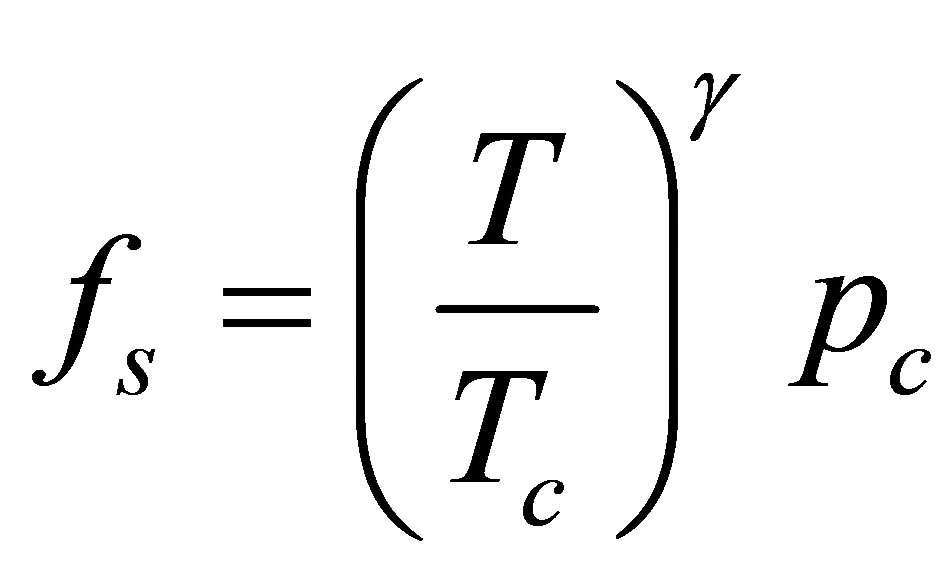 (23)
(23)
where Tc and pc are the critical temperature and pressure respectively and the parameter γ is an empirical constant particular to the adsorbate-adsorbent system. The final form of the DA model is
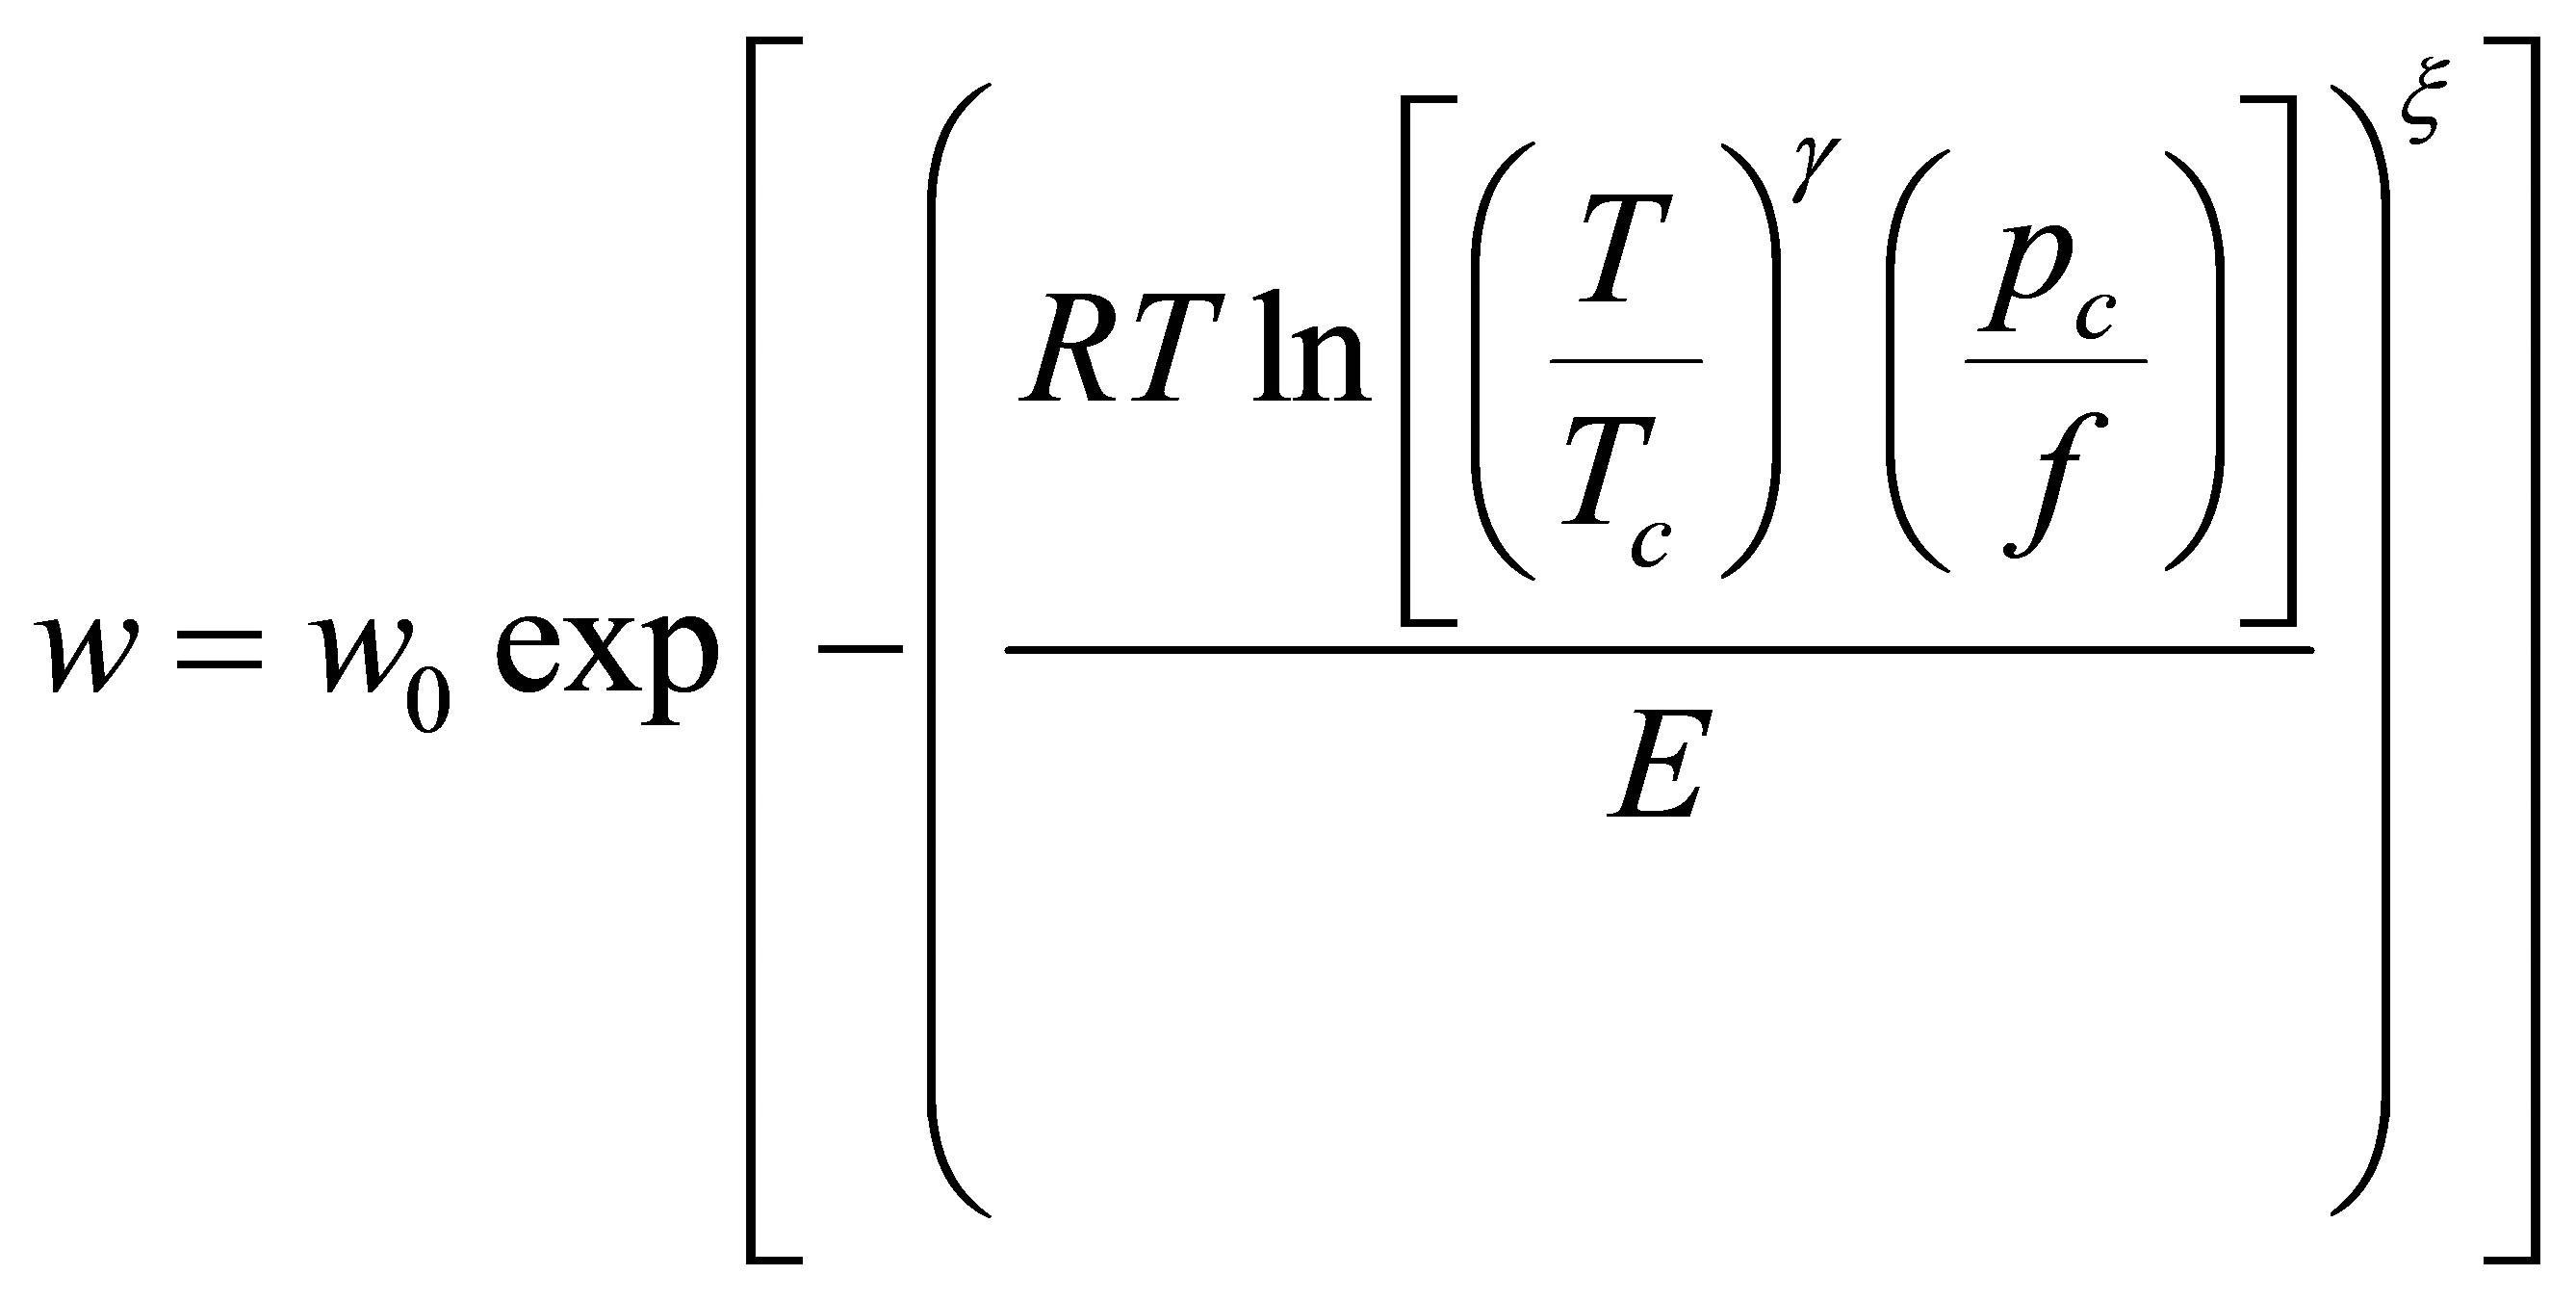 (24)
(24)
 a unitless quantity representing the fraction of pore volume filled. Because it is a unitless quantity, it is equivalent to represent the micropore filling as ratio of the mass adsorbed mabs to the mass adsorbed at complete saturation m0 so that Equation (24) is
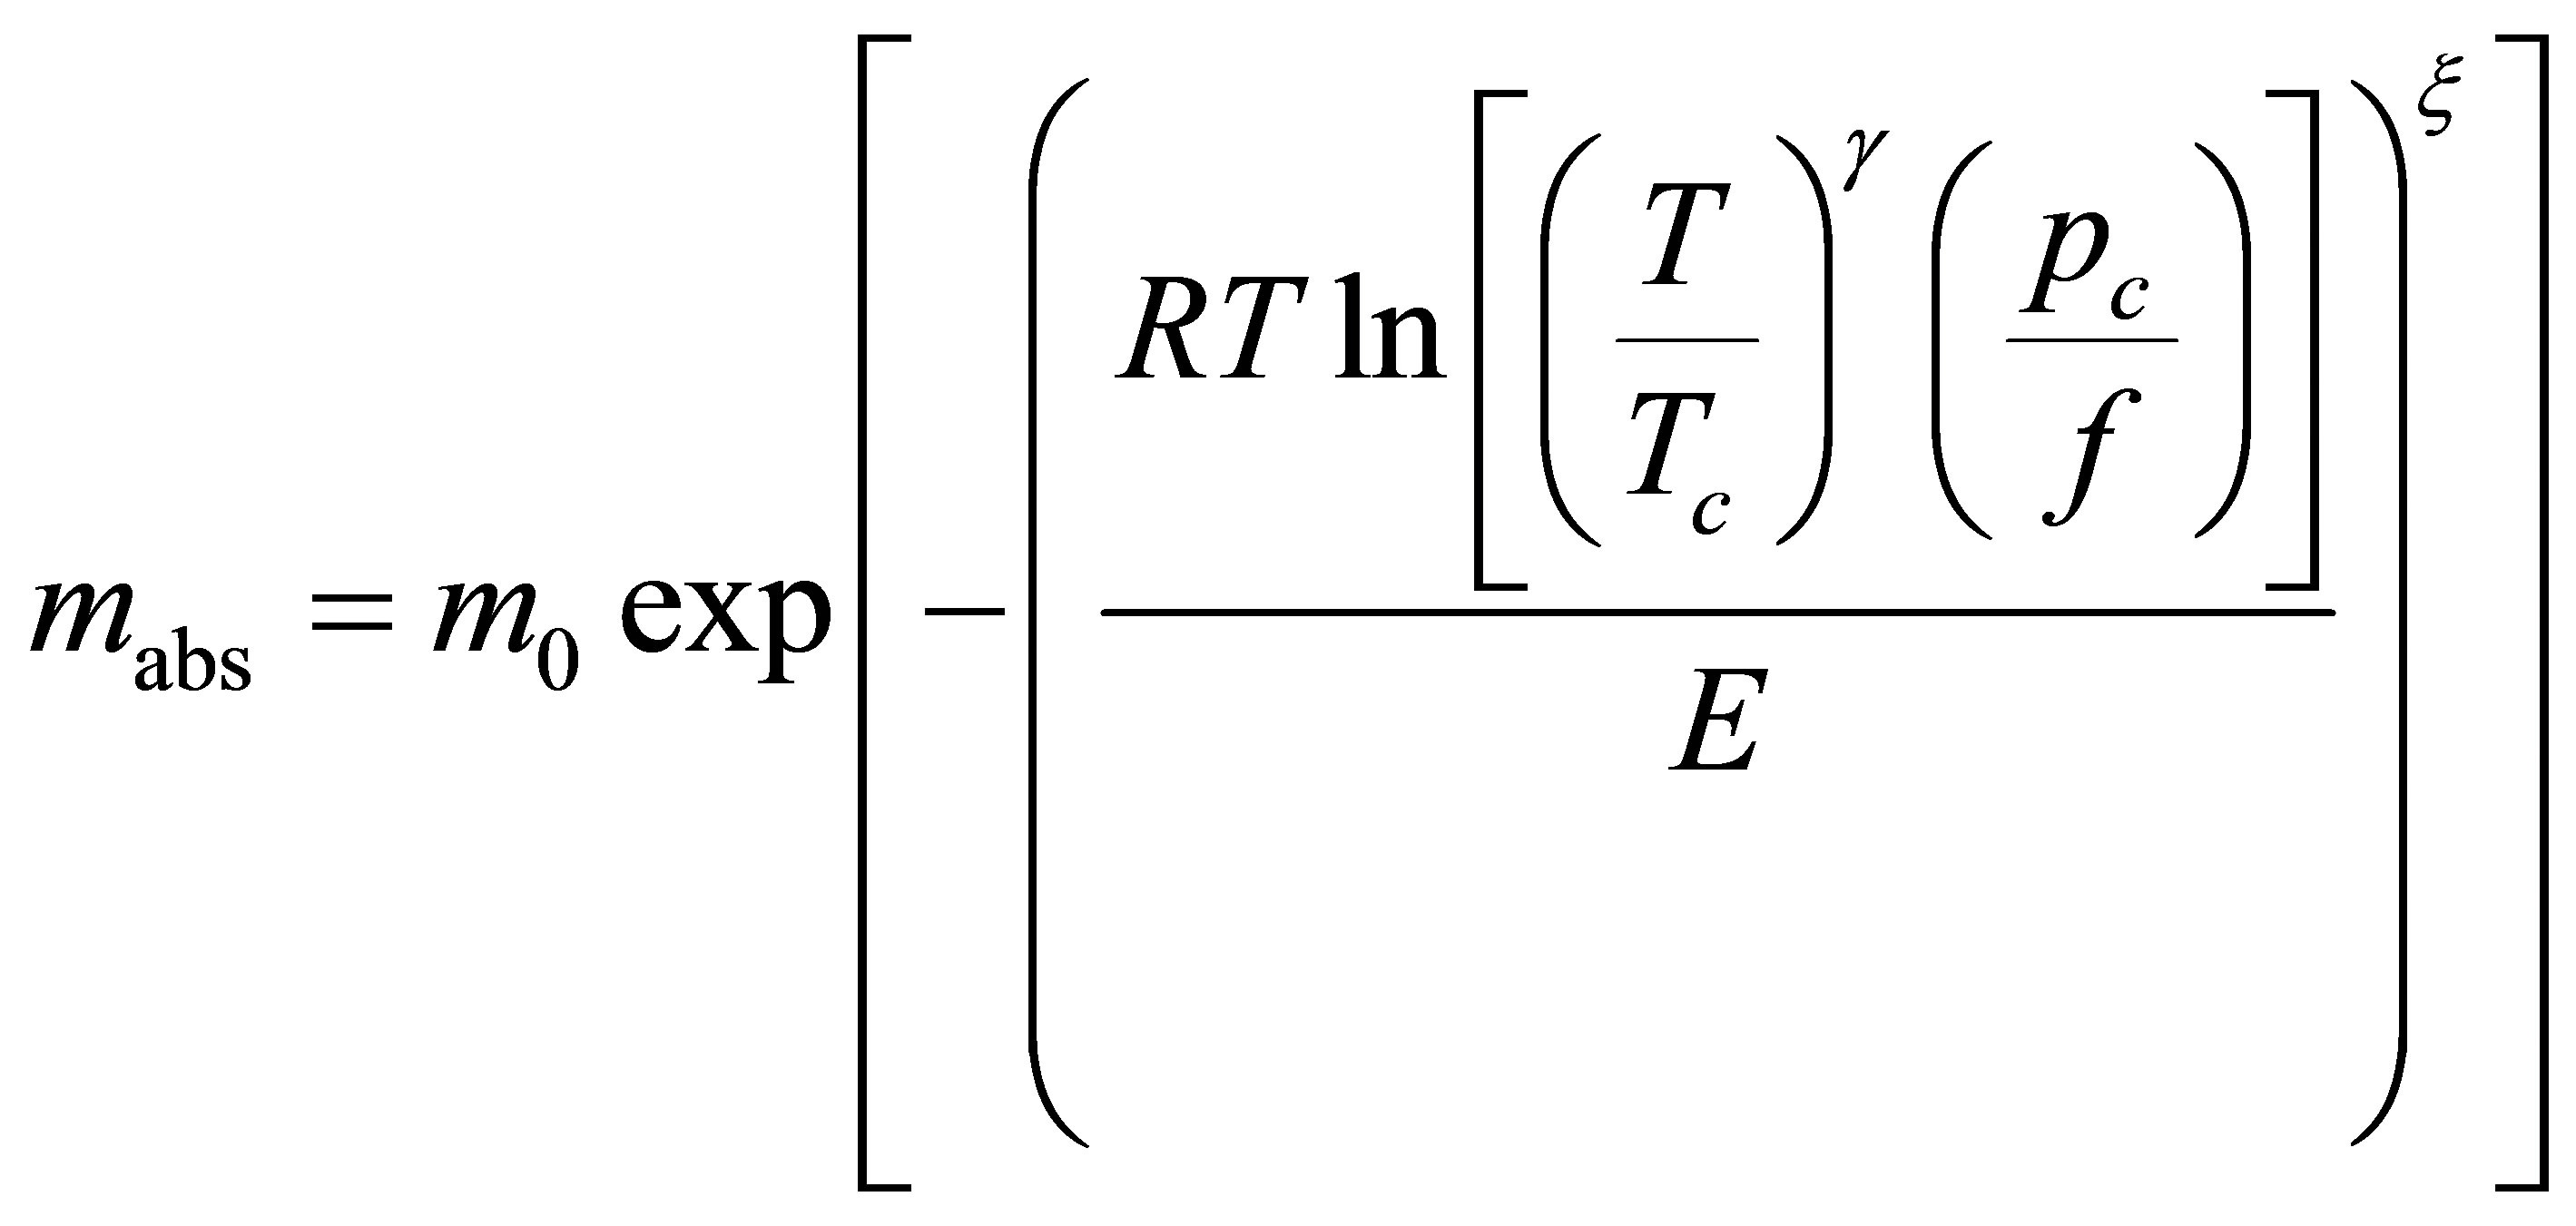 (25)
(25)
By solving Equation (25) for the fugacity and applying Equation (14), the adsorption enthalpy is given by
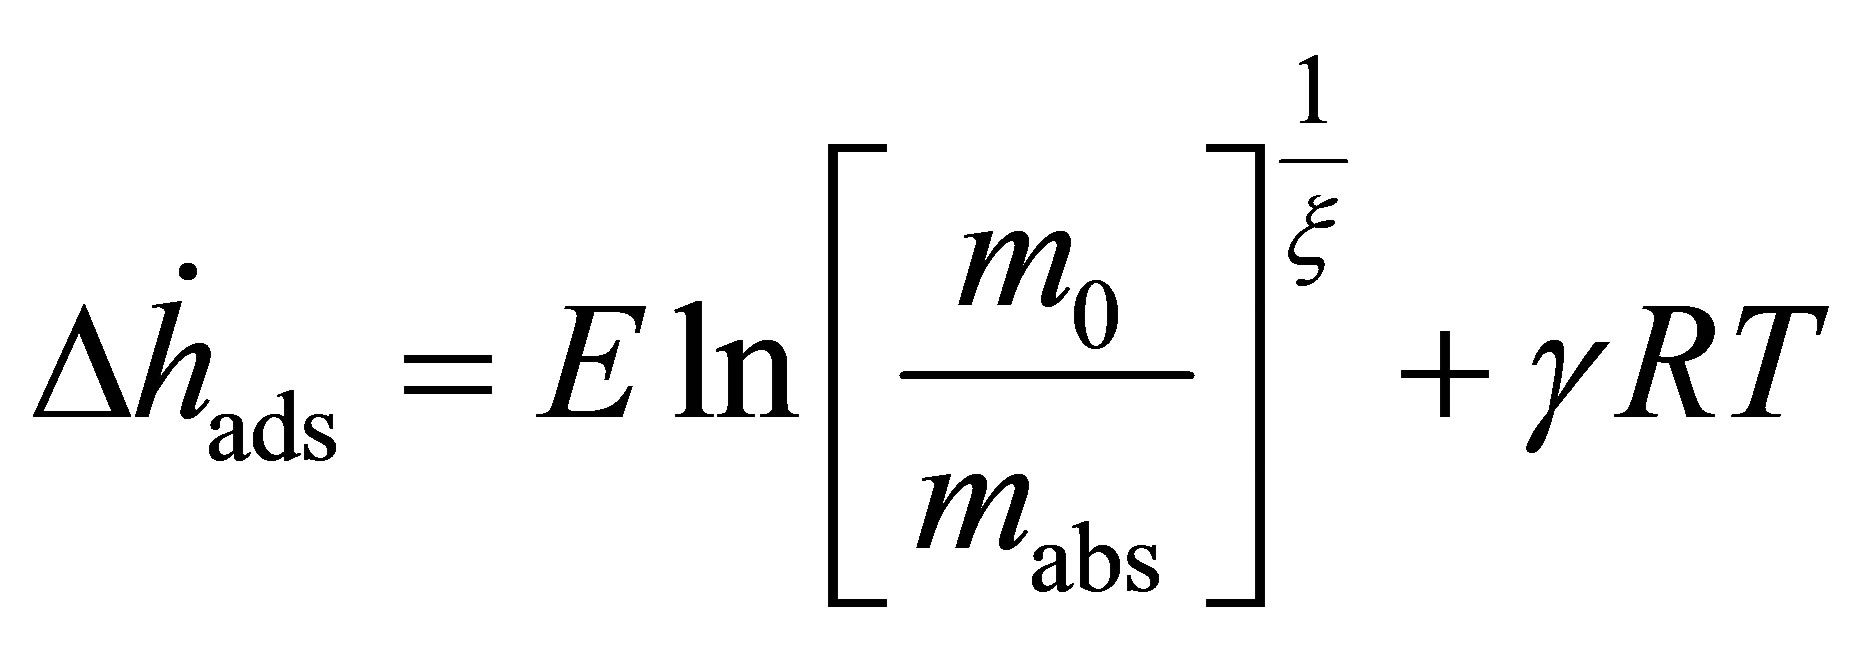 (26)
(26)
Equation (24) depends upon the temperature of the isotherm measured. The zero temperature enthalpy  is a useful quantity, because it represents the change in energy of the gas upon adsorption.
One note about the DA model is that, at low pressure, it does not satisfy Henry’s law. This is further exemplified in Equation (26). For small values of , the calculated enthalpy goes toward infinity, meaning that the model loses physical meaning at low coverage. This method is only accurate for application to high pressure adsorption of supercritical gases or to multilayer subcritical adsorption.
For the samples studied, the order from highest to lowest enthalpy (Figure 4(a)) does not match the order of the SEC from highest to lowest. From Figure 3(a), it is clear that the adsorbed molecules as not spaced as closely in Zn4O(btb)2 as the other samples, but the adsorption enthalpy is comparable to MSC-30. The best conclusion to make from this is that not all of the available surface area is contributing to adsorption at this temperature, but the portion that does contribute has an interaction that is comparable to activated carbon. The adsorption enthalpy for Cu3(btc)2 is larger than Zn4O(btb)2 which is consistent with the idea that MOFs with open (exposed) metal sites will have a higher adsorption energy. The zero temperature enthalpy (Figure 4(b)) and the characteristic energy (Table 3) show values that are expected of the materials investigated. The activated carbon, MSC-30, has a  at low coverage of about 5 kJ/mol. Although the adsorption enthalpy for Cu3(btc)2 does exceed 12 kJ/mol at low coverage, almost half of this enthalpy is due to temperature effects. Additionally, the enthalpy quickly decreases with increasing pressure. A storage material that will be potentially useful for vehicular applications at ambient temperature operating conditions will require an enthalpy that is above 12 kJ/mol for the entire pressure range.
6. Conclusions
For the three benchmark materials measured, volumetric storage at ambient temperature is only a marginal improvement, at best, over compressed hydrogen. This is because hydrogen adsorption at ambient temperature is a relatively small effect and the difference between excess adsorption and gas that could be stored in the volume that the material displaces is small. Excess adsorption must therefore be increased to improve storage capacity.
The fugacity must be used in place of the real gas pressure when calculating adsorption enthalpies. Use of the experimental pressure can result in large errors in the calculated enthalpy at high pressure. The DA model may be used for high-pressure, ambient temperature adsorption data to calculate the adsorption enthalpy from a single adsorption isotherm. Finally, the surface excess concentration has been shown to be a good qualitative measurement for the adsorption enthalpy because high enthalpy materials tend to have more closely spaced adsorbed molecules. However, it is not a perfect metric, as
 (a)
(a) (b)
(b)
Figure 4. The adsorption enthalpy (solid symbols) and zero temperature adsorption enthalpy (open symbols) calculated from the DA equation as a function of absolute adsorption (a) and pressure (b).
Table 3. Fitting parameters obtained for the DA model.
shown for Zn4O(btb)2, if a portion of the surface area is not contributing to the adsorption process.
7. Acknowledgments
This work is supported in part by the United States Department of Energy, Energy Efficiency and Renewable Energy under Award No. LP0025051.