Coherency Evaluation of Spatiotemporal Neural Activities in the Molluscan Olfactory Center Applying Extracellular Recording with Wavelet Analysis ()
1. Introduction
The procerebrum (PC) of the land slug Limax is the olfactory center involved in olfactory discrimination and learning [1,2]. In the PC, an oscillation of local field potential (LFP) with 0.5 - 1 Hz is observed by electrophysiological extracellular recording [3]. The oscillatory activity is supposed to arise from synaptic interactions of two types of interneurons [4-6]. Additionally, previous studies using optical recordings revealed spatiotemporal activity patterns in the PC [4,7,8]. The oscillation has a phase delay along the distal-proximal axis, while the neural activities along the anterior-posterior axis are synchronized, resulting in the propagation of waves from distal to proximal regions.
Optical recordings provide direct measurement for spatiotemporal neural activities. Optical recordings, however, have some defects. For example, in the fluorescent voltage imaging, voltage sensitive dyes generally exhibit a relatively small change in the fluorescence intensities, resulting in a low S/N ratio, and often exhibit photobleaching and phototoxity. Therefore, there are not many reports on long time stable measurement by the fluorescent voltage imaging. Additionally, high speed measurement is difficult for imaging. Recently, we have developed an imaging system which enables us to measure spatiotemporal neural activities for a long time with a high speed and a high S/N ratio [9]. However, extracellular recording is still preferable for long time and high speed measurement, while it is not abundant in spatial information. It is therefore important to elicit spatial information from extracellular recording.
In this study, we first measured the LFP oscillations in the PC of Limax valentianus by the conventional extracellular recording. We next evaluated spatial information included in the present LFP compared with the spatiotemporal neural activities measured by the fluorescent voltage imaging. Finally, we analyzed the LFP oscillations by the wavelet analysis to evaluate the coherency of the spatiotemporal neural activities in the PC. The wavelet analysis is a frequency analysis, which is more suitable for physiological data than Fourier-based analyses.
2. Materials and Methods
2.1. Preparations
The land slug Limax valentianus was anesthetized by injection of 35 mM Mg2+ solution into the body cavity, and the central nervous system (CNS) was isolated with tentacles from the body in the dissection solution (composition in mM: NaCl 35, KCl 2, MgCl2 28, CaCl2 4.9, D-glucose 5, HEPES-NaOH 5 (pH 7.6)). The PC is located at the distal part of each cerebral ganglion.
2.2. Extracellular Recording
The recording chamber was consisted of two compartments with a slit between them. The isolated CNS was placed into one of the compartments filled with the slug saline (composition in mM: NaCl 70, KCl 2, MgCl2 4.7, CaCl2 4.9, D-glucose 5, HEPES-NaOH 5 (pH 7.6)), and tentacles were placed to pass through the slit to the other compartment exposed air. The slit was sealed with silicon grease, and the odor stimulus was applied to the tentacles by a continuous flow from the odor source. The LFP was measured through a glass suction electrode (tip diameter = 80 mm) filled with the slug saline. The reference electrode was placed into the slug saline in the former compartment. The signals were amplified with an extracellular recording amplifier (ER-1, Cygnus, USA) and transferred through an AD converter (PowerLab, ADInstruments, Australia) into a personal computer (Dell Precision T5600, Dell, USA) with 1 kHz sampling frequency. The sampled signals are expressed as V(t) = {V1, V2,  , VM}.
2.3. Fluorescent Voltage Imaging
For the fluorescence measurement, a voltage sensitive dye Di-4-ANEPPS (Wako, Japan) was used. The isolated CNS was loaded for 30 min at room temperature with 86 mM Di-4-ANEPPS in the presence of 0.06% cremophor EL and 0.6% ethanol in the slug saline. After the dye loading, the preparation was washed with the slug saline.
The stained preparation was placed on the recording chamber mentioned above. The chamber was then mounted on the stage of a microscope (E-FN1, Nikon, Japan) with a 10 ´ objective lens (Plan Apo, 0.45 NA, Nikon, Japan). The dye was excited by a LED of 530 nm with a half width of 25 nm (LEX2-G, Brain Vision, Japan) through an excitation filter (EX510-560). The emitted fluorescence of 705 nm was detected through a dichroic mirror (DM575) and a barrier filter (BA590). The fluorescence images (1024 pixel ´ 1024 pixel) were acquired at a rate of 10 ms/flame by a sCMOS camera (Zyla, Andor, Ireland). The image sequences were stored into a personal computer (Dell Precision T5600, Dell, USA).
2.4. Wavelet Analysis
The wavelet analysis is a frequency analysis, which is different from Fourier-based analyses in which time stationarity is assumed for the signals. Physiological signals are non-stationary, for example, the present LFP oscillation pattern is transiently changed by odor stimuli. Because an assumption on time stationarity is not needed for the wavelet analysis, it has been applied to physiological signal analyses [10-13]. In the present study, we also used a similar method to the previous studies as briefly described below.
The wavelet analysis is based on the introduction of an appropriate orthogonal basis, which is an orthonormal basis when normalized, and the signals are characterized based on the distribution of amplitude within basis. The orthonormal basis is called mother wavelet. We employed the “Daubechies” function as mother wavelet y [14]. The wavelet expansion is expressed as

Here, C(j, k) are wavelet coefficients. j is a resolution level and k is a time index. N is the number of the resolution levels, which was set to 12 in this study. The resolution level j determines one frequency band. The concept of energy is linked with that in the Fourier theory. The mean wavelet energy at frequency band j in time window i is expressed as

The corresponding squared coefficients,  , are summed over time index k¢ within the time window i. Nj is the number of the wavelet coefficients. The relative wavelet energy in the time window i is expressed as
 (1)
(1)
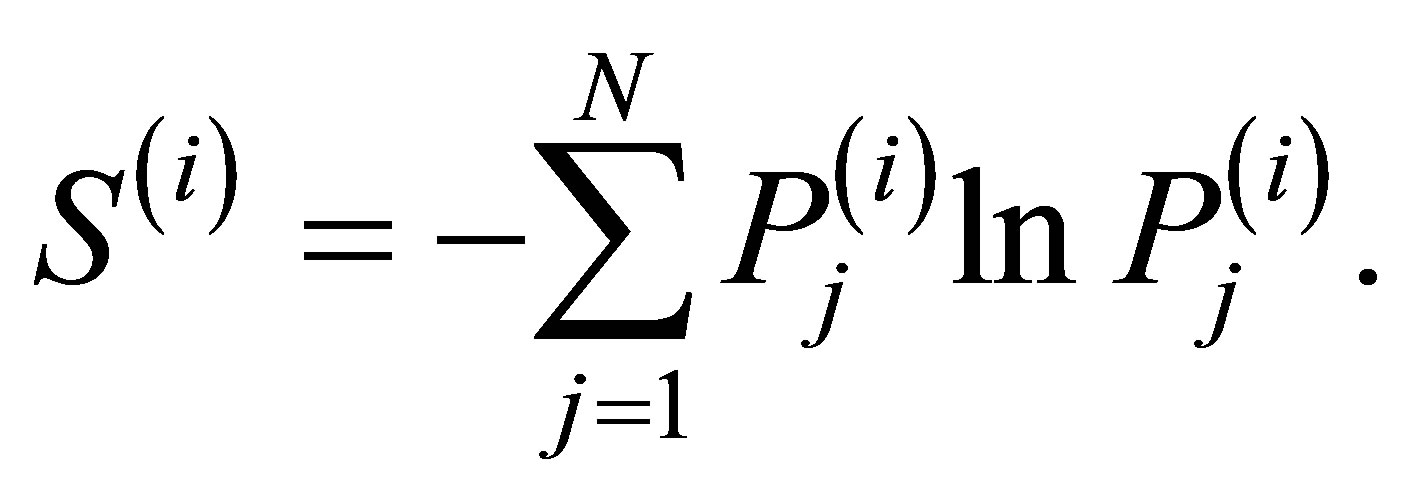
Pj(i) represents the probability distribution of the energy, where . The wavelet entropy in the time window i is expressed as
 (2)
(2)
3. Results and Discussion
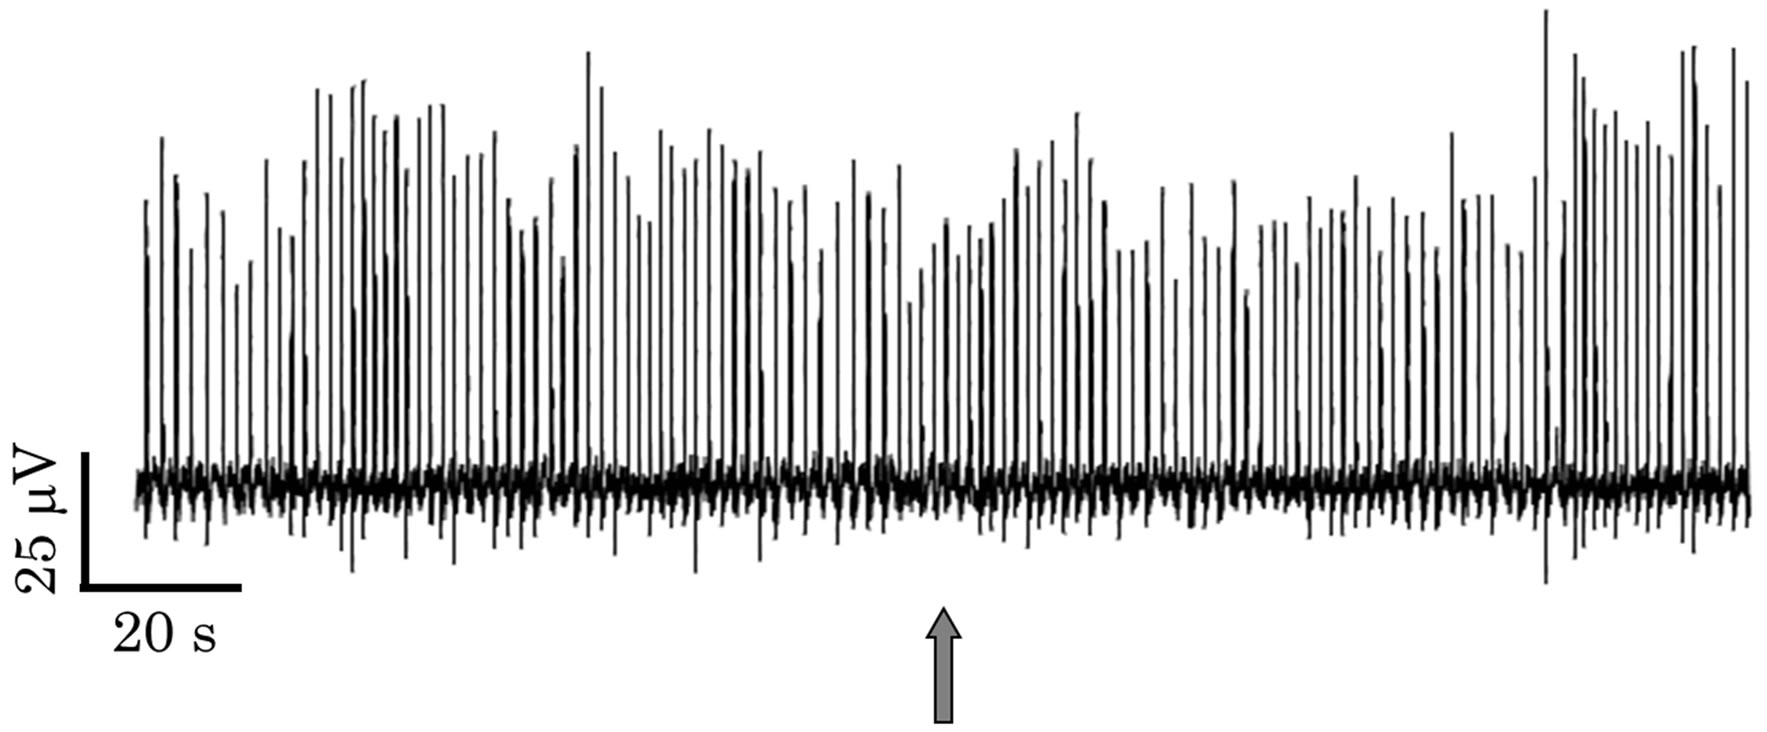
Figure 1 shows time changes in the LFP in the PC. The LFP is induced by the electric current between the glass electrode and the reference. When the electric current is from the glass electrode to the reference, the LFP become upward. As another group reported, the LFP showed an oscillation with 0.5 - 1 Hz (Figure 1(a)). While 3 to 5 mm tip glass electrodes were used in the previous reports [3,4,7], however, larger-bore (80 mm tip) glass electrodes were used in the present study. It is therefore supposed that more spatial information is included in the present LFP, which is discussed below. In Figure 1, no change in the LFP oscillation pattern was seen in a wet air stimulus (Figure 1(a)), while a change was seen in an aversive odor (isoamyl acetate) stimulus (Figure 1(b)). Although the frequency estimated from peak-to-peak intervals was not much changed by the odor stimulus, the waveform became different as shown in Figure 2. The waveform had shoulders (thin line in Figure 2(a)) and sometimes some peaks (shown later) before the odor stimulus. The characteristics in the waveform are supposed to be due to a phase difference among neural activities in the measurement area of the glass electrode.
 (a)
(a) (b)
(b)
Figure 1. LFP oscillations in the PC. (a) Control (a wet air stimulus); (b) An aversive odor (isoamyl acetate) stimulus. The wet air or odor stimulus was applied at the time shown by the gray arrow.
After the odor stimulus, however, it had one peak and a sharp shape (thick line in Figure 2(a)), which suggests a decrease in the phase difference among the neural activities. Similar results were obtained for another aversive odor (cineol). The half width of the waveform was decreased by the aversive odor stimuli (Figure 2(b)). Thus, the present LFP measurement suggests that the aversive odors induce spatially coherent activities in the PC. To confirm it, we next examined the spatiotemporal neural activities in the PC using the fluorescent voltage imaging.
Figure 3 shows time changes in the fluorescence intensity of the dye (Di-4-ANEPPS) in the PC. The four ROIs with 64 pixel ´ 64 pixel (about 40 mm ´ 40 mm) were put on the fluorescent images along the distalproximal axis of the PC (Figures 3(a) and (b)). The changes in the fluorescence intensity (DF) are expressed as relative values to the basal level with %. The fluorescence intensity of each ROI showed an oscillation corresponding to the LFP oscillation simultaneously measured (Figures 3(c)). Here, the fluorescence increase of the dye (DF > 0) corresponds to hyperpolarization of neurons. The hyperpolarization induces the electric currents to surroundings. The summation of the electric currents