Liquid-Solid Partitioning of Precipitation along an Altitude Gradient and Its Statistical Properties: An Italian Case Study ()
1. Introduction
Many evidences are nowadays available of a globally changing climate [1] [2] . Among the effects of this change, the most important ones are surely the increasing global mean temperature [1] , the reduction of the diurnal temperature range [3] , the decrease of snowpack extension [4] [5] , the increasing precipitation in the mid-high latitudes and its decreasing in the tropics [1] [6] , and the more frequent occurrence of extreme events [7] .
Temperature is a key variable in determining the partitioning between solid and liquid precipitation events [8] , and in characterizing the climatology of a region [4] . As a consequence, one of the most important issues, when dealing with modern hydrological research, is to understand how climate change would affect the properties of precipitation events at a site [9] .
Many experimental data available in the literature show that the percentage of yearly precipitation, which falls as rain, has been changing over the past 50 years in many areas of the world, such as North America [10] . In northern Canada, for example, the snow proportion on total precipitation has been increasing during the whole twentieth century [11] [12] , while it has been deeply decreasing in most of the United States and southern Canada [8] . This element is of preeminent importance in such an environment, where 50% - 70% of water runoff is nowadays originated from snowpack storage [4] . As a consequence, earlier timings and scarcer entities of spring runoff are predictable, as already described, for example, by [13] -[15] .
Furthermore, the magnitude of temperature variation at high elevations is more intense than at the global scale [16] , so that this topic becomes particularly relevant in mountainous areas, where most of the precipitation input falls as snow and is stored in the snowpack till spring and summer [17] .
Nevertheless, while it is well-known how the global trend is oriented to modifying the liquid-solid partitioning of events in favor of the first type of component, and of mixed events at temperate latitudes [8] . The possible implications of the differences in the statistical properties of the various types of events on climatic scenarios are still abundantly unknown [6] [7] .
Here we address this issue analyzing the precipitation data series at six Automatic Weather Stations (AWS) along an altitude gradient located in Trentino region, northeast Italy, and investigating whether in these sites solid and liquid events may have the same statistical properties. If it is so, we could conclude that climate change impact on precipitation regards mainly the events partitioning, rather than the correspondent statistical properties. If it is not so, the prediction of water availability in the future would be further complicated by the modifications in events statistics, which would determine non-stationary scenarios [9] .
2. Case Study
2.1. Data
We have considered as a case study the Italian network Meteotrentino, located in Trentino region, northeast Italy. We have chosen this network mainly because of its elevation range. The gauging stations are located between 100 and 3000 m a.m.s.l.
The network is composed by roughly 150 stations, which covers the province of Trento. The network has been established in 1997, gathering together stations and data series coming from previously existing AWS, and organizing them in a unique network. Data series length covers, in some cases, a period equal to ninety years.
The type and frequency of available data greatly change from station to station. Anyway, the minimal instrumentation in the network configuration includes a heated precipitation gauge and a thermo-hygrometer. Then, other variables are sometimes measured, such as wind direction and velocity, solar radiation and snow depth. Data are available at the URL http://www.meteotrentino.it/.
The heated gauge mixes the contributions of the different types of events (solid and liquid). Data are therefore reported as mm of water equivalent. The precision is equal to ±0.1 mm/h, the resolution to 0.2 mm/h, the measurement range is 0 - 300 mm/h. The thermometer precision is equal to ±0.4˚C, resolution to 0.02˚C and the measurement range is −30˚C to +50˚C.
The time resolution ranges from the daily one to the sub-hourly one, depending by the site. Data are subjected to quality control. As a consequence, each available value is flagged with a number, which indicates its quality. As an example, data can be flagged as “good”, “estimated”, “interpolated”, “missing” or “uncertain”. We have judged the quality of a station through the percentage of data classified as “good” on the total reported values. We define this ratio as Quality Index, QI.
2.2. AWS Selection
We have selected six weather stations within the network. Choice criterions have been: 1) stations have to be located at different heights, covering the whole range of elevations; 2) data series have to refer to a common period of observation; 3) quality index has to be particularly high, say >75%.
For each station we have considered the data series of total precipitation p and air temperature T at the hourly scale. We report in Table 1 the selected AWS, together with their coordinates, elevation, and QI. The considered period is 1994-2009.
The quality of data series is rather good. The minimum QI is equal to 76.7% for Passo Tonale. This value represents anyway the best result that it is possible to obtain by considering stations at the same altitude. We report in Figure 1 a map with the location of AWS, together with the indication of the city of Trento, and San Michele all’Adige (indicated with D), where it is located a disdrometer.
The Trentino region is mainly mountainous. Its geomorphology is characterized by a central ample alpine valley, crossed by the Adige river along the North-South direction, and by different transverse valleys, mainly in the West-East direction, as in Figure 1. S1 and S2 are placed in a valley environment. In particular, S1 is exposed to the lift of humid currents from the Garda Lake (which represents the south-eastern border of Trentino region) along the valley, while S2 (within the Sole Valley) faces incomes of air fluxes mainly from East (from the Adige Valley). On the contrary, S6 is placed in a glacier environment. The remaining sites are placed at three different alpine passes, and are therefore exposed to currents coming from both East and West.
3. Methods
3.1. Definitions
Here, we have represented the precipitation event with a rectangular shape, of duration D in hours, and volume of precipitation H in mm [18] . Volumes are hereafter considered as variables for unit area.
The precipitation event is distinguished in three different types: solid, liquid or mixed event.
As a consequence, six random variables are here considered: the duration of a solid event DS, of a liquid event DL, of a mixed event DM, and similarly, the volume of a solid event, HS, of a liquid event HL and of a mixed event, HM.
3.2. Selection of the Events
As a first step, the data of each AWS have been used to select the precipitation events and to obtain an observed data set for each random variable.
We have identified the precipitation events using a minimum inter-event time (MIT) equal to six hours (following, e.g., [18] -[20] ). The beginning of an event is individuated by a not-null registration of p. If two not-null values are at least six hours distant, then they are considered as two different events. If they are not, they belong to the same event.
Then, for each event we have calculated the volume H, by summing the hourly registered values of volume belonging to the same event, and the duration D.
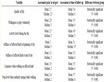
Table 1. Automatic weather stations considered in the study.

Figure 1. Location of the AWS considered within the Trento Province, with the position of the disdrometer.
Because of the time resolution of the data, the samples are characterized by the repetition of multiples of the elementary resolution, i.e. 1 hour for duration, and 0.2 mm for volume These repetitions (also known as ties) are a source of noise in the data: if we have collected an event of duration D, its real duration is in the range D ± 0.5 h. If we have evaluated a volume equal to H, its real value is in the range H ± 0.1 mm.
To separate events between the solid, the liquid and the mixed ones, at least three different approaches are available in the literature basing on air temperature [21] . The simplest one is represented by a static threshold temperature method, which considers as snowfall any event, which occurs with a temperature lower than a threshold, and as liquid any event which occurs with a temperature greater than the threshold itself. The method can be refined by providing two thresholds, to include mixed events in the classification [22] .
Despite of its simplicity, no definitive indication is available in the literature as for the value of the threshold [21] . As an example, [23] tested this method dividing some half-hourly precipitation data series measured in the Andes and classifying as snowfall any event contemporaneous to an air temperature equal to, or minor, of −1˚C, and as rainfall any event contemporaneous to a temperature equal to, or greater, than +3˚C.
As for the events occurred between −1˚C and +3˚C, [23] adopted a more complex method based on 11 meteorological variables. As further examples, [24] used a static threshold equal to −1.5˚C to separate between solid and liquid contributions, while [25] adopted the physically based threshold of 0˚C. In [26] the upper limit of snowfall in a continental area has been determined, and found to be variable during the year between +1.4˚C and +2.6˚C.
As an alternative and more exhaustive approach, a gradual increase with the temperature in the proportion of liquid contribution on the total precipitation volume can be imposed, as done by [27] . As a third chance, a more complex method can be established which predicts the snow and rain proportions basing on the comparison between maximum and minimum daily temperatures and a threshold [21] .
Other methods are available in literature, which account for different climatic and topographic factors in determining the form and the intensity of precipitation. Reference [28] , for example, proposes seasonal correlations between the intensity of precipitation and many topographic variables, such as the elevation, the versant exposure and the distance to the sea. The correlations have been calibrated using 44 AWS in the southeastern United States. Similar considerations are reported for the United Kingdom [29] and Sweden [30] . Nevertheless, these correlations are strongly site dependent, so that their application in other environments needs a general climatic characterization of the area. As for the case study area, an ample analysis of Alps climatology is available in [31] . From this, it is evident how the mean seasonal precipitation over the Trentino region is rather uniform, except for the primary flanks in the southeastern part of the Region, which has not been considered. In general, the Trentino region turns out to be a relatively uniform and dry area in spite of its topography, if compared to, for example, the northwestern Italy. Besides, [31] reports particularly dry conditions for many Alpine valleys in the East-West direction, which is the topographical condition of four out of six AWS considered. In addition, five out of six AWSs are placed on the same versant respect to the Adige valley.
For all these reasons, we have adopted here a simple static threshold method, based only on air temperature. It has been adapted in order to include in the classification also the mixed typology. According to [25] , a 0˚C threshold has been used because of its physical base. Therefore, we have classified as “solid” each event which has occurred with a stably negative air temperature, as “liquid” each event which has been characterized by a stably positive air temperature, and as “mixed” those events which have experienced both positive and negative values of air temperature. We have checked this assumption by considering data measured during 2008 by a laser-optic disdrometer (Thies) placed at San Michele all’Adige. The instrument is placed in the Adige valley, at an elevation of roughly 200 m a.m.s.l. (Figure 1). It is able to discriminate the different types of precipitation, with a 1 minute time resolution. It registers also air temperature. To validate our assumption, only few liquid events must be found in correspondence of negative values of air temperature. Conversely, few solid events should be collected with a positive air temperature. We have counted the number of samples, for each typology, occurred with a positive, and a negative temperature, obtaining six different sets of data, which have been used to check our assumption.
3.3. Data Analysis
As a second stage, to get a general description of the climatology of the sites, and its variation with the altitude, we have calculated for each random variable the sample mean and variance. Then, for each type of event, we have evaluated the sample value of Pearson’s correlation coefficient ρ, and Kendall’s τ [32] between duration and volume. These coefficients give a measure of dependence between the two variables. In particular, Kendall’s τ is less influenced than ρ by anomalous data. The positive dependence is represented by positive values of coefficients (in the range 0 - 1), the negative dependence by negative values (in the range −1 - 0), while 0 denotes independence.
We have restricted the analysis only to values of volume greater than 0.2 mm.
3.4. Goodness-of-Fit Tests
As a third step, we have performed goodness-of-fit tests on data to check if the datasets of duration (volume), distinguished by type of precipitation, may be characterized by the same probability distribution, whatever this distribution is. To this aim, we have used the two-sample Kolmogorov-Smirnov test (in the next indicated also as KS2 test), [32] . The null hypothesis of the test is that the two samples are extracted by the same probability distribution.
For each site, we have run the test for the data of the following couples of variables: DS and DL, DS and DM, DL and DM, HS and HL, HS and HM, HL and HM.
Here, we have randomized the values of duration and volume in the data, when ties are present. In particular, we have used a Uniform distribution in the d ± 0.5 h for duration, and h ± 0.1 mm for volume, where d and h indicate the ties. Tests have been performed with a 5% significance level.
4. Results and Discussions
4.1. Events Partitioning
We report in Figure 2 the analysis of disdrometer data for 2008 at San Michele all’Adige. For each typology of precipitation event, we have evaluated the percentage of data, which occurred with a negative (positive) temperature on the total amount of data of that type. Figure 2 reports the six sets of data.
Almost no liquid event occurred with a negative temperature. This is true also for mixed events. If we consider solid events, it is evident how the majority of them occurred with a negative temperature. Nonetheless, a great amount of solid events did occur with a positive air temperature (roughly 46%). From this, we conclude that only solid events are reasonably expectable below 0˚C, while a number of solid events are possible even with a positive temperature. These results are in agreement with, [22] [33] [34] .
A crucial element in this analysis is the different time resolution of disdrometer respect to AWS. Thanks to its 1 minute time resolution, the disdrometer samples sixty times within the time resolution of. In any of these 1 minute sampling intervals, the instrument classifies the precipitation as “mixed” only if both the two phases are contemporaneously present, while a mixed event could be also characterized by the alternation of phases on the whole duration of the event. Then, it follows that the high percentage of solid events, which occurred with a positive temperature, could be ascribable to mixed events.
The main conclusion we can draw from this analysis concerns the scarcity of liquid events, which occur with a negative temperature. It partly confirms our choice of a 0˚C threshold. Besides, this value has a physical basis, which in the absence of more precise indications represents a justification for its choice.
We report in Table 2, for each site, the total amount of events, in the three forms, together with the evaluation of the mean value of the nivometric coefficient. This coefficient is defined as the ratio between the yearly precipitation fallen as snow and its total. While solid events are very rare at low elevations (e.g., at S1), liquid events are still abundant at high elevations. As an example, the nivometric coefficient at S6 is equal to roughly 30%, even if 46% of events fall under solid form.
4.2. Statistics
In Table 3 the sample values of mean and variance are reported for the two classes of random variables and the three types of events, as function of the site.
From Table 3, it is possible to see that the form “mixed” is characterized by the longest average durations, and by the greatest values of variance, except for S1. This is partly justified by considering that the longer the event is, the higher the chance of fluctuation of air temperature. Then, the chance of classifying a long event as mixed is rather probable.
In addition, the mean duration of solid events is greater than the one of liquid events in four cases out of six. This is systematically verified for S4, S5 and S6, which represent the sites at high elevations. At lower elevations, the situation is a bit more irregular. If we consider the volume, we can observe that solid events have a mean value of H greater than that of liquid events in 50% of the sites. Concerning the variance, solid events show a value greater than the one of liquid events in four cases out of six for H and in three cases out of six for D.

Figure 2. Percentages of precipitation under the three forms, distinguished for positive and negative air temperature, at San Michele all’Adige.
Table 2. Number of events, for each type, and each site, in the period 1994-2009.
Table 3. Sample means and variances as function of the site and type of event.
As a consequence, we can conclude that solid events are generally longer than the liquid ones at high elevations, although they present also a great variation. Nonetheless, as for H, no clear altitude gradient is evident.
Figures 3-5 report the empirical cumulative distribution functions Fn(x) of duration (left panel) and volume (right panel) for the different forms, respectively for S1, S3, and S6. We have selected these because of their significance in illustrating the behavior of Fn(x) for the different forms at low, medium and high elevations.
These figures confirm the comments reported previously. Mixed events are systematically characterized by longer durations, and greater volumes than the other forms of precipitation.
The shape of the empirical CDF is affected by the size of the data samples. This confirms how solid and mixed events occurrence increases with the altitude of the site.
Table 4 reports the sample values of Pearson’s ρ and Kendall’s τ. From Table 4, it is evident how durations and volumes of precipitation are strongly positively dependent in all the three forms, i.e. an increase in duration corresponds to an increase in volume.
This dependence does not show any altitude trend. In general, the dependence measured by the Kendall’s τ is fainter than that one measured by ρ. The only irregular situation is represented by S1, at which the size of solid and mixed samples does not allow for reliable inferences.
In Figure 6, for S6, we report the couple (duration, volume) for the events distinguished by solid, liquid and mixed. The dependence between the two variables is quite evident. In particular, no couple of values in the areas characterized by, respectively, short durations and great volumes, or long durations and small volumes is present. Besides, it is evident how long durations are typical of solid events, as discussed before, while liquid events present shorter durations.
4.3. Two-Sample Kolmogorov-Smirnov Tests
Table 5 reports the p-value of KS2 tests. From Table 5 it is possible to see that the results are strongly dependent by the elevation.
In fact, at S1, the null hypothesis of same distribution between the durations has been never rejected. Similarly, for the volume, two out of three combinations have exhibited the same result.
On the contrary, if we consider the highest elevations (S5 and S6), the null hypothesis is always rejected. In these cases, the very small p-value gives certain reliability in rejecting the null hypothesis.
At intermediate elevation sites (i.e., S2, S3, S4), in ~83% of the cases the null hypothesis is rejected. The results of KS2 tests are strongly influenced by the size of the two samples. As a consequence, the non-negative

Figure 3. Empirical cumulative distribution function of the duration (left) and volume (right) for solid, liquid and mixed events at S1.

Figure 4. Empirical cumulative distribution function of the duration (left) and volume (right) for solid, liquid and mixed events at S3.

Figure 5. Empirical cumulative distribution function of the duration (left) and volume (right) for solid, liquid and mixed events at S6.
Table 4. Sample value of the Pearson’s correlation coefficient ρ, and the Kendall’s τ of duration and volumes of solid, liquid and mixed events at the different sites.
Table 5. p-value of the KS2 tests, with indication of not-rejection (NR), or rejection (R), of the null hypothesis (i.e. the two samples come from the same distribution) at a significance level equal to 0.05.

Figure 6. Duration and volume of the events, solid, liquid and mixed, at S6.
outcomes at the lower elevations are probably not very significant.
At a global glance, if we focus on durations, it is evident how, apart from the results at S1, in the 93% of the other cases the null hypothesis has been rejected, while the percentage decreases to the 86% if we consider the volumes.
The overall results show how it is unacceptable to assume that the durations, and volumes, of solid, liquid and mixed events have the same probability distribution.
5. Conclusions
Here statistical properties of solid, liquid and mixed events along an altitude gradient have been discussed, in terms of both duration and volume.
The characterization of these events is important in hydrological modeling [35] .
For this aim, an Italian case study has been considered. Hourly data series of precipitation and air temperature at six AWS within Meteotrentino network, located in Trentino region, northeast Italy, have been used to obtain data samples of duration and volume for the different forms of events.
A partitioning criterion has been used to select the events and has been validated by using one year long disdrometer data series, at 1 minute time resolution. A temperature-based partitioning procedure has been established, which does not account for some important climatologic factors, such as seasonality or versant aspect. More attention will be paid in future developments to this issue.
Univariate and bivariate statistics are calculated by using sample data of duration and volume. Means and variances of the different variables have been evaluated.
They show that the durations of the different types of events change with elevation. Sample values of Pearson’s r and Kendall’s t indicate 1) a positive dependence between the two variables for solid, liquid and mixed events; 2) no evident trend with the altitude gradient.
Two sample Kolmogorov-Smirnov tests applied to each couple of durations DS, DL, DM, and similarly to each couple of volumes HS, HL, HM indicate that both durations and volumes of different types of events can be rarely considered extracted by the same probability distribution. The results show that the KS2 test is not passed at high elevations, while in some cases, at lower elevations, the test is passed, probably due to the limited size of one of the samples.
Acknowledgements
We would like to thank Meteotrentino for the hourly data series of precipitation and air temperature, the Edmund Mach foundation in San Michele all’Adige for 1 minute disdrometer data, and the Autonomous Province of Trento for the DTM used in Figure 1.
We would like also to thank the anonymous reviewer for the useful indications provided.