Open Access Library Journal
Vol.06 No.05(2019), Article ID:92666,20 pages
10.4236/oalib.1105399
The Application of Quality Costs Accounting in Industrial Companies in Benghazi Libya
Tarek Abdelhafid Elsharif
Accounting Department, Higher Institute of Administrative and Financial Sciences, Benghazi, Libya

Copyright © 2019 by author(s) and Open Access Library Inc.
This work is licensed under the Creative Commons Attribution International License (CC BY 4.0).
http://creativecommons.org/licenses/by/4.0/


Received: April 15, 2019; Accepted: May 24, 2019; Published: May 27, 2019
ABSTRACT
Quality represents the first competitive advantage of industrial and service companies. The race by companies to provide a high-quality output, in fact, derives from the intensity of competition, leading to continuous quality improvement, because it is impossible to compete in the local and global markets without providing high-quality products to be accepted by customers; thus quality becomes the primary goal to be met with attention and care locally and internationally. This study intended to identify the concept and nature of accounting quality as a modern development in the globalization of the economy and recognize the reality of accounting quality in the Libyan industrial companies which work in Benghazi city. In addition to the fact that quality cost accounting is one of the essential ingredients that activates industry and achieves growth. So, to achieve the aims of the study, a prepared questionnaire distributed to the sample of companies, and the collected data was analyzed to reach the purposes of the study. The study concluded with a set of results and recommendations, which both will show at the end of the research.
Subject Areas:
Accounting
Keywords:
Quality, Accounting Quality, Quality Costs, Evaluation Costs, Prevention Costs, Internal Failure Costs, External Failure Costs

1. Introduction
The issue of quality is now the strategic objective and competitive advantage of many companies, but it is evidence of the success of companies in the market competing locally and internationally.
Thus, quality is the first competitive advantage for both industrial and service companies. Competition by companies to produce high-quality commodities is, in fact, a result of the intensity of competition, which leads to continuous improvement of quality and attention to it. So, it is not possible to compete in the local and international markets without providing high-quality products that are accepted by the customer. Thus, quality becomes the main objective which should be attention and attention [1] .
The cost of quality is one of the modern accounting trends to which attention is focused at present, also concept of quality costs has evolved to become one of the most important pointers of the influence on production costs, which is reflected in the impact on profitability levels and the company’s ability to cope with emergency conditions [1] .
This study attempted to lighten on the quality management field, its definition, stages of development, its benefits, and other related topics.
And then study transferred to the area of accounting quality as an important and new area, and represents a stage of development in the outstanding accounting, what is the quality of accounting? What are the objectives? And what are the underlying elements? In this study, we also discussed quality accounting and its stages of development, its classification, and the principles of accounting measurement and analysis of quality costs and their results.
2. Literature Review
In recent years, companies have become increasingly aware of the need to apply the concepts of TQM. Many institutions and companies in the world have sought to establish the principles and concepts of quality in the industrial, service and productivity processes where they can face the new challenges associated with the intense competition at the international and local levels. This means that these companies and institutions must strive to achieve the highest quality of their goods and services so that they can prove themselves locally and internationally.
2.1. Quality Concept
The origin or concept of quality is due to the word (Qualities), which means the nature of the person, the nature of the object or the degree of rigidity. In the past, it meant accuracy and mastery through the manufacture of historical and religious monuments from statues, castles and palaces for the purposes of bragging them or to be used for protection purposes and recently changing the concept of quality after the development of management science and the emergence of large production and industrial revolution and the appearance of large companies and increased competition if the concept of quality has new dimensions [2] .
2.2. Definition of Quality Management
There are several meanings of Quality Management:
1) A new approach to customer performance requires the renewal of traditional management practices and long-term commitment to the unity of objectives, teamwork, and participation of all organization members [3] .
2) Quality is a set of characteristics and characteristics that characterize the product and customers, whether in terms of design product or manufacture or ability to perform so as to reach the satisfaction of these customers and their happiness [2] .
3) Is an introduction to quality management based on the involvement of each member of the organization and aims at long-term success by satisfying the customer and achieving benefits for the employees of the establishment and society [4] .
2.3. The Importance of Total Quality Management
Total quality in this age has become the basis for commercial communications between countries, which determines the success or failure of production and service organizations in the world as it is a means to satisfy the consumer and increase productivity and reduce costs and reduce profit and therefore must be managed in an effective way because of its importance as the overall quality system leads to cost reduction and increase profitability. Where studies which conducted on companies Sized companies showed that (43) out of every (45) company doubled in size in five years due to the interest of their founders in quality management, also lead to consumer satisfaction, competitive advantage, and high return. In addition, becomes essential to get some international certificates of quality, such as ISO, and like the overall quality management work to improve the natural reputation of the institution from the views of customers [3] .
2.4. Benefits of Total Quality Management
According to Al-Shabrawy [4] , the benefits of (TQM) can be divided into the following points:
1) Improvement in profitability and competitiveness:
The improvement achieved in quality leads selling and thus increasing profitability and competitiveness, and the slogan of TQM is the best thing to do right from the first time.
2) Increase organizational effectiveness:
Comprehensive quality management produces greater capacity for teamwork, improved communication and greater involvement of all problem-solving workers and improved management-employee relations, thereby reducing turnover.
3) Achieve customer satisfaction:
Quality Management focuses on understanding the requests and wants of the client and determining what they are offering now and what we should do to provide more. The overall management of quality determines the function of every group in this field starting with the market research stage to determine the specifications that belong to the customer through the design phase, Handling and distribution and finally installation and after-sales service.
2.5. The Concept of Quality Costs and Their Components
The concept of quality has been associated with costs since poor quality represented a disproportionate use of resources and energies as well as labor and time, resulting in high costs, which have had a meaningful impact on the rise in production costs and the overall costs of the company [1] .
Since 1950, attention has been paid to quality costs due to the negative impacts of poor-quality costs and the need to avoid them by eliminating poor quality.
In 1988, Juran and Gryna [5] wrote about the general meaning of the costs of quality, and from that time the literature on quality costs began to take on a wider scope. In 1957, Masser [6] wrote an article entitled (Quality and Quality Officer). In 1964, the first report on poor quality cost (PQC) was published. Therefore, definitions and concepts that reflect the cost of quality have emerged if they are defined (costs that appear in a number of activities related to the quality of the product or service). The definition referred to activities in a total case, without specifying the activities according to their importance and their relation to the failure of the product or service.
Horngren [7] defines quality costs as the costs incurred to prevent the appearance of poor quality or costs implications for poor quality. This means that the cost of quality is either in the form of (poor quality costs) or (good quality costs) and both in result represent costs for quality and can be summarized in Table 1.
In view of the above, the cost of quality can be defined as costs incurred in reaching a certain level of quality if they appear in order to reach the specified level of quality, which is referred to as good quality costs and includes the cost of prevention and evaluation and the costs incurred ratio of poor quality or failure that accompanies the process, which is called poor quality costs and includes the costs of both internal and external failures.
This means that paying attention to good quality costs and directing them towards quality improvement (production products and processes) contributes to the elimination of poor quality and thus reduction in the total quality cost. So, good quality costs are referred to as so-called quality assurance costs, as for poor quality costs are called non-conformance or failure costs [8] .
In this area, [1] [2] , and [6] split the cost of quality into the fixed and the variable cost as designated in Table 2.
2.6. Analysis of Quality Costs
Nowadays quality costs in worldwide practice are usually distinguished into three main categories of quality costs: prevention, appraisal, and failure (by distinguishing inner and external) costs. The orientation of modern organizations towards satisfaction of customers’ needs and expectations requires for a decrease of failure costs and improvement of quality. Calculation of external failure quality costs allows organizations to discover what loss they are suffering because the mistakes committed influenced the customer. Therefore, external failure costs of quality are determined as one of the most significant costs of quality [8] [9] .
According to Abdul-Sayed [1] , any work within the company entails some cash expenses called costs. In companies, costs accompany labor inputs and outputs. Contemporary administrations seek to understand the economic interactions between work methods, personnel, equipment and relationships in such a way as to produce high quality products and low costs , usually through cost analysis to demonstrate the relationship between cost elements and trends and study them with a view to identifying waste, loss and defective products, and taking corrective action, [7] [10] [11] agree that the cost of quality analysis means “costing back to its main and subsidiary components and determining the relationship between them and their trends”.
Table 3 shows the different views in the classification of the elements of the main and subsidiary quality costs that measure the costs of quality and which help in the process of analysis.

Table 1. Costs of quality.
Table 2. Quality cost classification to (variable and fixed) costs.
Table 3. Quality cost classification to (variable and fixed) costs.
Differently, the analysis requires that the views on the level of interest in the cost of quality and the standard ratio be known since this is the basis for measuring and comparing the types of quality costs and their reflection on both quality improvement and cost reduction. The level of total quality costs, focusing on the costs of the external failure of its relation to the reputation of the company, the attitude of customers as well as their effect on the level of expected return of sales.
3. Statement of the Problem
At a time when developed countries, including the United States and European countries, have gone a long way in the field of accounting quality, we see from the other side Arab countries lagging in this area and could not absorb the idea and importance of the subject only recently. These countries did not know the importance of quality accounting, which made business organizations and companies suffer from delays in the application of the concepts of total quality, due to stumbling in the application for the quality of accounting.
This study attempted to answer the following main question:
“Is―costs accounting of quality―applied to industrial companies in Benghazi?”
To answer the main question of the study, the following sub-questions were formulated:
1) Are the documentation procedures for the cost of quality in industrial companies followed in Benghazi city?
2) Are quality costs related to prevention are calculated in industrial companies in Benghazi city?
3) Are quality costs related to evaluation are calculated in industrial companies in Benghazi city?
4) Are quality costs related to internal failure are calculated in industrial companies in Benghazi city?
5) Are quality costs related to external failure are calculated in industrial companies in Benghazi city?
4. Objectives of Study
The study aims to recognize the concept and nature of quality of accounting as one of the latest developments in the globalization of the economy, and to know the reality of quality of accounting in the Libyan industrial companies, in addition to the fact that accounting of quality costs is one of the most important elements that stimulate the industry and achieve its growth.
5. Methodology
This part of the study shows the study population, tools, model and hypotheses, moreover statistical methods which were utilized.
5.1. Study Model
The study model consists of five main variables were (following documentation procedures for costs of quality, calculation of quality costs related to prevention, calculation of quality costs related to evaluation, calculate the quality costs related to internal failure and calculate the quality costs related to external failure) as variables that measure the extent to which quality accounting is applied in the industrial companies operating in Benghazi city as shown in Figure 1.
5.2. Study Hypotheses
Based on the theoretical framework of the study, based on the study’s questions and objectives, and reviewing the Literature, the main hypotheses of the study can be formulated as follows:
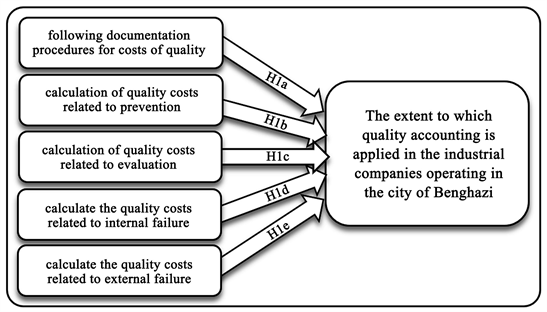
Figure 1. Study model.
H0: There are statistically significant differences at α = 0.05 level. That the participants in the study do not think that quality costs accounting is applied in the industrial companies in Benghazi city.
H1: There are statistically significant differences at α = 0.05 level. That the participants in the study think that quality costs accounting is applied in the industrial companies in Benghazi city.
H0: μ < 3
H1: μ ≥ 3
This main hypothesis leads us to the following sub-hypotheses:
H1a: There are statistically significant differences at α = 0.05 level. That the participants in the study think that documentation procedures are followed in the industrial companies in Benghazi city.
H1b: There are statistically significant differences at α = 0.05 level. That the participants in the study think that quality costs related to prevention are calculated in industrial companies in Benghazi city.
H1c: There are statistically significant differences at α = 0.05 level. That the participants in the study think that quality costs related to evaluation are calculated in industrial companies in Benghazi city.
H1d: There are statistically significant differences at α = 0.05 level. That the participants in the study think that quality costs related to internal failure are calculated in industrial companies in Benghazi city.
H1e: There are statistically significant differences at α = 0.05 level. That the participants in the study think that quality costs related to external failure are calculated in industrial companies in Benghazi city.
These hypotheses will be verified using t-test analysis as shown subsequently in part (6.2).
5.3. Population and Sample
Since the objective of the study is to identify the extent of the application of quality accounting in the industrial companies operating in Benghazi, and therefore all the industrial companies operating in Benghazi were studied. These companies are (Table 4).
5.4. Study Instrument
The questionnaire was designed as a major tool for collecting relevant data for study within the industrial companies that working in Benghazi. In the questionnaire, each question is scaled using 5 Likert scale ranging from strongly agree (5) and strongly disagree (1) for each statement. Where questionnaire was divided into two sections as the first section include general questions and the second one covers all variables of study as shown in Table 5.
Furthermore, After contacting the chambers of commerce and industry in Benghazi, 12 industrial companies were identified in the city of Benghazi 160 questionnaires were distributed to these companies, of which 142 were retrieved with a response rate of 89% and 22 questionnaires were excluded (by 14%) because they were not valid for analysis, hence the questionnaires analyzed were 120 questionnaires (by 75%) as shown in Table 6.
・ The validity of the questionnaire
This test measures the extent to which the questions represent a good representation of the subject, This test measures the extent to which the questions represent a good representation of the subject, This method depends on the area to which the question items represent an excellent representation of the topic to be studied so that it is logical that the content of the questionnaire is valid as long as it includes all elements of the subject to be measured and represented [12] .
That was achieved by conducting the test of the sincerity of the arbitrators as being experienced and efficient in the subject for which the study tool prepared. Using the opinions of the specialists in the field of quality from the members of the teaching and their observations, the researcher reached the reliability and validity of the questionnaire and the fact that it is applicable in its final form.
・ Validity of the structure
Also, for the reliability of the instrument, the researcher used the validity of the structure. It is a measure of instrument reliability that measures the extent to which the objectives of the tool achieved. Where measures the extent to which each area of study is closely related to the total score of the questionnaire paragraphs [13] .
The following Table 7 shows the result of this test.
・ The stability of the questionnaire
As per many studies, constructs are considered to have internal consistency reliability when the Cronbach Alpha value exceeds (0.60 to 0.70), In this study, the reliability assessment was done using Statistical Package for Social Sciences (IBM Spss 22).
The stability of the study instrument was verified. Where the α-Cronbach coefficient was computed for each set of questionnaire questions, where all measures in this study show a high level of reliability, ranging from (0.696 to 0.940), All scales exceeded 0.60, therefore the survey is considered reliable as presented in Table 8.
Table 4. Study population.
Source: Chamber of Commerce and Industry―Benghazi.
Table 5. Number of questions related to sections of study.
Table 6. Distribution of questionnaires.
Table 7. Validity of the structure.
**Correlation is significant at the 0.01 level (2-tailed).
Table 8. The stability of the study instrument (Cronbach’s α).
6. Results
6.1. Demographic and Descriptive Statistics
In the beginning, it is required to indicate the percentage of demographic information for participants in this study. Where Table 9 covers demographic information including gender, age, qualification, participant department, specialization, and participants experience.
The results indicate that about 77% of participants were males, about 23% were females and about 83% of the participants were aged between 30 and 50 years of age and about 42% of the participants were college graduates with 30% bachelor and 11.7% have a master’s degree, the specialization of the participants in this study was distributed to about 42% management, about 33% accounting, and 25% economy.
Table 9 also shows the departments to which the participants belong, where about 42% work in company management, 25% work in administrative and financial Affairs and 25% work in the quality department. And about 67% of participants have over 10 years of experience.
All demographic results in Table 9 indicate that the sample members have good experience expressing valid opinions in answering the questionnaire.
6.2. Data Analysis
After validating the search variables, the next step associated conducting one-sample T-test analysis for purpose of testing hypotheses. This analysis used to verify the main hypothesis and the sub-hypothesizes arising from it. So, this test was used to analyze the paragraphs of the questionnaire. Where the paragraph is positive, meaning that the respondents agree with their content if the calculated t value is greater than the tabular t value of (1.66 right-tailed, [14] ) or the significance level is lower than (0.05) and the relative weight is greater than (60%), and the opinions of the respondents in the paragraph shall be neutral if the level of significance is greater than (0.05).
Table 9. Demographic information.
・ Test First Hypothesis: Follow Procedures for Documentation of Quality Costs
Procedures for documentation are that the company must ensure that all documents, records, and basic data for product safety, legitimacy and quality are present, and controlled by the company on them effectively.
H1a: There are statistically significant differences at α = 0.05 level. That the participants in the study think that documentation procedures are followed in the industrial companies in Benghazi city.
Table 10 shows participants views in the first axis of the study which is about procedures for documentation of quality costs.
In general, the Mean for all the first axis paragraphs (documentation procedure) is (4.01) by relative weight is (80.12%), which is greater than neutral relative weight (60%) and (t) calculated is (29.768), which is greater than t tabular of (1.66) with significance level (0.000) is less than (0.05).
Indicates acceptance of the alternative hypothesis, which means that documentation procedures are followed in industrial companies in Benghazi.
・ Test Second Hypothesis: Calculation Quality Costs Related to Prevention
Prevention costs are the costs incurred to prevent defects in the product and to prevent product non-conformity with the required specifications.
H1b: There are statistically significant differences at α = 0.05 level. That the participants in the study think that quality costs related to prevention are calculated in industrial companies in Benghazi city.
Table 11 shows participants views in the second axis of the study which is about quality costs related to prevention.
In general, the Mean for all the second axis paragraphs (Quality Costs Related to Prevention) is (4.18) by relative weight is (83.63%), which is greater than neutral relative weight (60%) and (t) calculated is (23.065), which is greater than t tabular of (1.66) with significance level (0.000) is less than (0.05).
Indicates acceptance of the alternative hypothesis, which means that quality costs related to prevention are calculated in industrial companies in Benghazi.
・ Test Second Hypothesis: Calculation Quality Costs Related to Prevention
Evaluation costs are the costs spent on examination and testing to assess product quality and identify problems in the production process.
H1c: There are statistically significant differences at α = 0.05 level. That the participants in the study think that quality costs related to evaluation are calculated in industrial companies in Benghazi city.
Table 12 shows participants views in the third axis of the study which is about quality costs related to evaluation.
In general, the Mean for all the third axis paragraphs (Quality Costs Related to Evaluation) is (4.21) by relative weight is (84.17%), which is greater than neutral relative weight (60%) and (t) calculated is (24.006), which is greater than t tabular of (1.66) with significance level (0.000) is less than (0.05). Indicates acceptance of the alternative hypothesis, which means that quality costs related to evaluation are calculated in industrial companies in Benghazi.
・ Test Fourth Hypothesis: Calculation Quality Costs Related to Internal Failure
Internal failure costs are all costs associated with a product that failed to meet the quality standards and was discovered at the facility prior to its exit to the consumer.
Table 10. Follow procedures for documentation of quality costs.
The value of the t tabular at the level of significance (0.05) and the degree of freedom (119) is equal to (1.66).
Table 11. Calculation quality costs related to prevention.
The value of the t tabular at the level of significance (0.05) and the degree of freedom (119) is equal to (1.66).
Table 12. Calculation quality costs related to evaluation.
The value of the t tabular at the level of significance (0.05) and the degree of freedom (119) is equal to (1.66).
H1d: There are statistically significant differences at α = 0.05 level. That the participants in the study think that quality costs related to internal failure are calculated in industrial companies in Benghazi city.
Table 13 shows participants views in the third axis of the study which is about quality costs related to the internal failure.
In general, the Mean for all the fourth axis paragraphs (Quality Costs Related to Internal Failure) is (4.25) by relative weight is (85%), which is greater than neutral relative weight (60%) and (t) calculated is (25.981), which is greater than t tabular of (1.66) with significance level (0.000) is less than (0.05).
Indicates acceptance of the alternative hypothesis, which means that quality costs related to internal failure are calculated in industrial companies in Benghazi.
・ Test Fifth Hypothesis: Calculation Quality Costs Related to External failure.
External failure costs are the sum of the costs of a defective product that is discovered after delivery to the customer or consumer.
H1e: There are statistically significant differences at α = 0.05 level. That the participants in the study think that quality costs related to external failure are calculated in industrial companies in Benghazi city.
Table 14 shows participants views in the third axis of the study which is about quality costs related to the external failure.
In general, the Mean for all the fifth axis paragraphs (Quality Costs Related to External Failure) is (4.19) by relative weight is (83.89%), which is greater than neutral relative weight (60%) and (t) calculated is (22.753), which is greater than t tabular of (1.66) with significance level (0.000) is less than (0.05).
Indicates acceptance of the alternative hypothesis, which means that quality costs related to External failure are calculated in industrial companies in Benghazi.
・ Test Main Hypothesis: Applied quality costs accounting in industrial companies in Benghazi.
H1: There are statistically significant differences at α = 0.05 level. That the participants in the study think that quality costs accounting is applied in the industrial companies in Benghazi city.
Table 15 shows participants views about Apply quality costs accounting in industrial companies in Benghazi.
In general, the Mean for main axis paragraphs (Apply quality costs accounting in industrial companies in Benghazi) is (4.05) by relative weight is (81.08%), which is greater than neutral relative weight (60%) and (t) calculated is (23.793), which is greater than t tabular of (1.66) with significance level (0.000) is less than (0.05) as shown in Figure 2.
The results in Table 15, which is confirmed in Figure 2, indicate rejection of the main hypothesis and all sub-hypotheses emanating from it. And the acceptance of the alternative hypothesis and all alternative sub-hypotheses, which means that the quality costs accounting is applied in industrial companies in the city of Benghazi.
Table 13. Calculation quality costs related to internal failure.
The value of the t tabular at the level of significance (0.05) and the degree of freedom (119) is equal to (1.66).
Table 14. Calculation quality costs related to external failure.
The value of the t tabular at the level of significance (0.05) and the degree of freedom (119) is equal to (1.66).
Table 15. Applied quality costs accounting in industrial companies in Benghazi.
The value of the t tabular at the level of significance (0.05) and the degree of freedom (119) is equal to (1.66).

Figure 2. One-sample T-test result.
7. Conclusions, Recommendations and Limitations
From the above, the study reached several conclusions and recommendations, the most important of which are:
7.1. Conclusions
1) There is great attention in following the procedures of authentication in all the companies under study, with some shortcomings in the disposal or replaced of old documents, which are useless in some of these companies.
2) There is also important attention by the companies under examination in calculating the costs of the prevention, with some weaknesses in calculating the planning and designing of quality costs and developing their system.
3) Likewise, there is great attention by the companies under search in calculating the costs of the evaluation, with some weaknesses for the cost of testing supplies from raw materials and semi-finished products and in calculating the cost of testing the field performance in these companies.
4) All the companies involved are concerned with internal failure costs, with a few shortcomings in calculating the costs of the waste (exhaust or scrap) that cannot be repaired or recycled, as well as the cost of problem-solving and error analysis.
5) Similarly, all companies concerned are interested in calculating the costs of external failure, with a slight weakness in terms of calculating the costs of handling customer complaints.
7.2. Recommendations
After reviewing the results of the study, we can come up with a set of recommendations:
1) The need to pay attention to follow the procedures of documentation, especially in the side of the procedures of disposal or replacement of old documents, which are useless in some of these companies.
2) Also, the need to pay attention to the costs of prevention, especially on the one hand calculating the planning and designing of quality costs and developing their system.
3) Likewise, attention should be given to the calculation of evaluation costs, especially in the cost of examining the procurement of raw materials and semi-finished products and calculating the costs of the field performance test.
4) As well, the need to pay consideration to the calculation of internal failure costs, especially when calculating the costs of waste (exhaust or scrap) that cannot be repaired or recycled, as well as in calculating the costs of problem-solving and error analysis.
5) Attention should also be given to calculating the costs of external failure, especially in terms of calculating the costs of handling customer complaints.
7.3. Limitations and Future Research Directions
This study deals with the concept of accounting of quality costs are within the following limits:
・ Time Limits: The time limit between was 15/01/2019 and 14/04/2019 represents the temporal limit for search.
・ Spatial boundaries: The spatial boundaries are in the city of Benghazi Libya and the industrial companies operating therein.
Therefore, the researcher suggests that future studies should be carried out using the same scale or after appropriate adjustments on it and applied to other sectors such as oil companies, banks, companies, and service institutions.
Conflicts of Interest
The author declares no conflicts of interest regarding the publication of this paper.
Cite this paper
Elsharif, T.A. (2019) The Application of Quality Costs Accounting in Industrial Companies in Benghazi Libya. Open Access Library Journal, 6: e5399. https://doi.org/10.4236/oalib.1105399
References
- 1. Abdel-Sayed, N.H. (2009) Quality Accounting. Dar Al Thaqafa for Publishing & Distributing, Amman, Jordan.
- 2. Al-Tharadka, M.S. (2006) Practical Guide to the Application of Total Quality Management ISO 9000. Safa Printing House, Amman, Jordan.
- 3. Zaidan, S. (2011) Total Quality Management. 2nd Edition, Dar Al-Manahej, Amman, Jordan.
- 4. Al-Shabrawi, A. (1995) Practical Guide to the Application of Total Quality Management ISO 9000. 1st Edition, Arab Scientific Information Company-Shuaa, Cairo, Egypt.
- 5. Juran, J.M. and Gryna, F.M. (1988) Quality Control Handbook. 4th Edition, McGraw-Hill, New York.
- 6. Masser, W.J. (1957) The Quality Manager and Quality Costs. Quality Control in India, 14, 5-8.
- 7. Horngren, C.T., Bhimani, A., Datar, S.M. and Foster, G. (1997) Management and Cost Accounting. 3rd Edition, FT Prentice Hall, New York.
- 8. Snie?ka, V., Daunorien, A. and ?ekevi?ien, A. (2013) Hidden Costs in the Evaluation of Quality Failure Costs. Engineering Economics, 24, 176-186.
https://doi.org/10.5755/j01.ee.24.3.1186� - 9. Obied-Allah, F.M. (2016) Quality Cost and Its Relationship to Revenue Sharing in Supply Chain. Accounting and Finance Research, 5, 173-189.
https://doi.org/10.5430/afr.v5n3p173 - 10. Russell, R.S. and Taylor III, B.W. (2010) Operations Management: Creating Value along the Supply Chain. 7th Edition, John Wiley & Sons, Hoboken, New Jersey.
- 11. Everett, E.A. and Ebert, R.J. (2008) Production and Operations Management: Concepts, Models, and Behavior. 5th Edition, Simon & Schuster, Singapore.
- 12. Robinson, J.P., Shaver, P.R. and Wrightsman, L.S. (1991) Criteria for Scale Selection and Evaluation. In: Robinson, J.P., Shaver, P.R. and Wrightsman, L.S., Eds., Measures of Personality and Social Psychological Attitudes, Academic Press Inc., Cambridge, Massachusetts, 1-16. https://doi.org/10.1016/B978-0-12-590241-0.50005-8
- 13. Carmines, E.G. and Zeller, R.A. (1979) Reliability and Validity Assessment. Sage Publications, Thousand Oaks, 17. https://doi.org/10.4135/9781412985642
- 14. (2015) Student T-Value Online Calculator. https://goodcalculators.com/