American Journal of Plant Sciences
Vol.4 No.2(2013), Article ID:27865,6 pages DOI:10.4236/ajps.2013.42033
Changes in Inositol Phosphates in Low Phytic Acid Field Pea (Pisum sativum L.) Lines during Germination and in Response to Fertilization
![]()
1School of Food Systems, North Dakota State University, Fargo, USA; 2Crop Development Centre, University of Saskatchewan, Saskatoon, Canada.
Email: dilrukshi.thavarajah@ndsu.edu
Received December 25th, 2012; revised January 25th, 2013; accepted January 31st, 2013
Keywords: Phytic Acid; Inositol-3-Phosphate; Low Phytic Acid Mutants; Field Peas; Iron; Phosphorus
ABSTRACT
Inositol phosphates are the main form of phosphorous (P) storage in legume seeds. Mutants low in inositol hexaphosphate (IP6), also known as phytic acid (PA), have been developed to increase iron (Fe) bioavailability and reduce P waste to the environment. The objectives of this study were to determine 1) inositol-P form changes during germination, and 2) the effect of P fertilizer application on seed PA, total P, and Fe concentration of three field pea (Pisum sativum L.) cultivars and two low-PA lines grown under greenhouse conditions. Low-PA field pea lines clearly had lower PA (1.3 - 1.4 mg·g−1) than cultivars (3.1 - 3.7 mg·g−1). Phytic acid concentration in both cultivars and low-PA lines decreased during germination, but tended to increase seven days after germination. Levels of inositol-3-phosphate-phosphate (IP3-P; 0.6 mg·g-1) and inorganic P (1.8 - 2.0 mg·g−1) were higher in low-PA lines than in the field pea cultivars. Reduction of PA in low-PA line seeds may reduce seed Fe and total P concentrations, as levels in the low-PA lines (37 - 42 mg·kg−1 Fe; 4003 - 4473 mg·kg−1 total P) were typically less than in field pea cultivars (37 - 55 mg·kg−1 Fe; 3208 - 4985 mg·kg−1 total P) at different P fertilizer rates. Overall, IP3 is the major form of P present in low-PA field pea lines during germination; however IP6 is the major form of P present in field pea cultivars. Therefore, low-PA field pea lines could be a potential solution to increase Fe bioavailability, feed P utilization, and reduce P waste to the environment.
1. Introduction
Phytic acid (PA), myo-inositol 1,2,3,4,5,6-hexakis (dihydrogen phosphate) or phytate, is a naturally occurring phosphorous (P)-rich compound formed during seed maturation [1]. Phytic acid accounts for 60% - 80% of the total P present in seeds, and is the primary source of P during germination [1]. The phosphates in PA chelate with essential mineral micronutrients such as iron (Fe) and zinc (Zn) and reduce mineral bioavailability to humans and animals. For example, poultry and swine feed grain P is in the phytic acid-P (PA-P) form and is excreted as phosphate complexed minerals; therefore, monogastric animal feeds must be supplemented with bioavailable P and minerals or phytase enzyme supplements for the animals to utilize P and mineral nutrients [2]. Beyond nutritional implications, PA-derived P in animal waste is a major environment pollution issue in the United States, Europe, and elsewhere [3]. However, recent studies indicate that PA may have significant health benefits with respect to preventing kidney stone formation, diabetes, caries, atherosclerosis, coronary heart disease, and a range of cancers [4]. Therefore, the negative nutritional and environmental concerns associated with PA are somewhat balanced by the positive health benefits it demonstrates as an antioxidant or anticancer agent. Optimizing the level of PA and other inositol phosphates in seeds is required to maximize nutritional and health benefits while reducing P waste to environment.
To reduce problems associated with PA in animal feed, nonlethal recessive mutants with low seed PA levels have been identified in maize (Zea mays L.; [5]), barley (Hordeum vulgare L.; [6]), rice (Oryza sativa L.; [7]), wheat (Triticum aestivum L.; [8]), common bean (Phaseolus vulgaris L.; [9]), and field pea (Pisum sativum L.; [10]). These low-PA mutants produce seeds that have normal levels of total P; however, their PA-P is 50% - 90% lower than regular cultivars [1,7]. It is argued that low-PA mutants are able to uptake inorganic P and translocate it to the developing seed, yet chemical mutagenesis has reduced conversion of this P into PA-P in the seeds [1]. The overall PA-P reduction evident in chemical mutants may be the result of increased inorganic P synthesis or increases in both inorganic P and myo-inositol with five or fewer P esters per molecule [2,11]. No detailed information regarding the inositol phosphate composition of either mature or germinating seeds of PA mutants of any crop has been reported to explain the observed PA reduction.
Field pea is a cool season pulse crop domesticated about 9000 years ago and more recently cultivated in North America and Europe. Significant land area has recently been added to field pea in the Northern Plains region of the USA, including North Dakota, South Dakota, and eastern Montana. Over the last two decades, the pulse production area in North Dakota has increased from less than 10,000 acres to nearly 900,000 acres [12]. The USA is one of the major field pea exporters in the world, and the production of other pulses continues to increase. Field peas are rich in protein (20% - 30%) and an excellent source of dietary fiber, slowly digestible carbohydrates, essential amino acids, and polyunsaturated fatty acids. They are also a rich source of bioavailable essential minerals and vitamins [13,14]. Field pea grown in North Dakota has moderate concentration of PA (4.9 - 7.1 mg·g–1 of PA or 1.4 - 2.0 mg·g–1 of phytic-P) despite very high total P concentrations (3.5 - 5.0 mg·g–1) [14]. Two low-PA field pea mutants, namely 1-150-81 and 1-2347-144, were recently developed in Canada [10] in response to the proposal that PA reduction in staple food crops may serve to increase mineral bioavailabilities of populations deficient in mineral micronutrients [15].
P fertilization has a positive effect on PA concentration in mature seeds. In soybean (Glycine max L.), PA increased linearly from 4.2 to 19.2 mg·g−1 as fertilizer P treatment varied from 2 to 50 mg·L−1 [16]. Nikolopoulou et al. [17] also found that total soil P level positively influences PA concentration in field pea and chickpea (Cicer arietinum L.). However, no data are available to compare field pea cultivars to low phytate lines and determine the different inositol-P forms during germination and the effect of P fertilizer application on seed PA, total P, and Fe concentrations. The objectives of this study were thus to determine 1) changes in inositol-P forms during germination and 2) effects of P fertilization on seed PA, total P, and Fe concentrations of three field pea cultivars and two low-PA field pea lines grown under greenhouse conditions.
2. Materials and Methods
2.1. Materials
Standards, chemicals, and high-purity solvents used for PA extraction, high performance liquid chromatography (HPLC) analysis, and micronutrient analysis (Fe and P) were purchased from Sigma Aldrich Co. (St. Louis, MO) and Alfa Aesar—A Johnson Matthey Company (Ward Hill, MA) and used without further purification.
2.2. Germination Study
Field pea cultivars for the germination study included three cultivars (CDC Striker, CDC Golden, and DS Admiral) and two low-PA mutant lines (1-150-81 and 1-2347-144; [10]. The cultivars were chosen based on their current use in the USA and Canada, and the potential for follow-up genetic studies based on contrasting biochemical profiles. Fifteen surface sterilized seeds from each field pea cultivar and line were placed on sterile petri dishes with absorbent paper saturated with millipore water. Germination was conducted in a dark wooden box at 22˚C. A total of 60 Petri dishes were randomly distributed in three similar wooden boxes. Harvesting was conducted 0, 1, 3, and 7 days after germination for each cultivar with three replicates. Every second day, the absorbent paper was saturated with 2 - 3 mL of millipore water. Each harvest day, seeds from 15 Petri dishes were harvested, weighed, oven dried at 40˚C for several days to a constant weight, and stored at −20˚C until further analysis. This entire experiment was repeated once under the same conditions.
2.3. Greenhouse Study
Fifty seeds from each of the three field pea cultivars and two lines were pre-germinated for 7 days using conditions similar to those described above. Three of these pre-germinated seeds from each field pea cultivar or mutant line were sown in 6” plastic pots filled with approximately 300 g of a peat-perlite-vermiculite mixture (Sunshine Grow Mix Number 1, Sun Gro Horticulture Canada Inc, ON, Canada). The soil in each pot was saturated with deionized water, allowed to drain overnight, and then the weight of each pot recorded. At seeding, pots were at 70% field capacity. Greenhouse conditions (North Dakota State University (NDSU) Greenhouse Complex, Fargo, USA) were as follows: day/night temperatures of 22˚C/16˚C; photosynthetically active radiation levels of 300 µmol m−2·s−1 using a 16 h photoperiod beginning at 0600 local time, and 50% - 60% relative humidity. A total of 60 pots were seeded: three replicates of the five genotypes at four different P fertilizer rates applied at seeding {0 (control) and 10, 20, and 40 mg·kg−1 P}. Pots were watered to approximately 70% of free draining moisture content every day and 250 mL of nutrient solution were added to all pots every two weeks, as per standard procedures for field pea at the NDSU Pulse Quality and Nutrition program. Nutrient concentrations of the all-purpose 20-20-20 fertilizer solution (Plant Products Co. Ltd., Brampton, ON, Canada) were 20% total N, 20% total P, 20% soluble K, 0.02% B, 0.05% chelated Cu, 0.1% chelated Fe, 0.05% Mo, 0.05% Zn, and 1% EDTA. As field pea plants do not grow in the Sun Gro potting medium without addition of P fertilizer (Pulse Quality and Nutrition personal experience), control plants received the regular nutrient solution but not additional P fertilizer. Plants were thinned to two per pot after emergence and allowed to grow for 43 days, by which time all plants had begun flowering and thus received a second P fertilizer treatment, as described above. At physiological maturity, all plants were hand harvested and air dried (40˚C), then the weight of biomass was recorded. Plants were then threshed, the total seed weight per plant recorded, and seeds stored at −20˚C until further analysis. This entire experiment was repeated once.
2.4. Inositol P and PA Extraction and Quantification
Field pea seed samples were prepared using a modified PA extraction method described by Thavarajah et al. [18]. Ten mL of 0.5 M hydrochloric acid (HCl) were added to powdered field pea samples (100 mg), and then the flasks placed in a boiling water bath with stirring for 5 min. After centrifugation (4000 ´ g, 3 min), PA-cations were complexed by the addition of 1.5 mL of 12 M HCl. Analysis of PA was achieved using high performance anion exchange chromatography (HPAEC) with conductivity detection (CD) (ICS-5000 Dionex, Sunnyvale, CA, USA). Briefly, an Omnipac Pax-100 anion exchange column (250 mm ´ 4 mm I.D.), in series with an Omnipac Pax-100 (8 µm) guard column, was employed for PA separation (Dionex, Sunnyvale, CA, USA). A gradient mobile phase with a flow rate of 1.0 mL·min−1 was applied using the following eluents: (A) 200 mM sodium hydroxide; (B) deionized water-isopropanol (50:50, v/v); and (C) water. The gradient elution was 0 to 13 min B 6% and C 12%, 13.1 to 30.0 min B 30% and C 2%, 30.1 to 43 min B 56% and C 2%, and 43.1 to 65 min B 61% and C 8%. Prior to PA detection, eluents were suppressed by an anion suppressor (ASRS® 300, 4 mm: Dionex, Sunnyvale, CA, USA). Pure PA standards were used to produce a calibration curve for peak identification and quantification; the detection limit was 5 mg·L−1. Low-PA laboratory reference samples were used periodically to ensure measurement consistency (CDC Redberry = 4.5 ± 0.1 mg·g−1 and CDC Robin = 4.6 ± 0.1 mg·g−1). Error tolerance for all lab reference samples was <0.1%.
2.5. Total P and Fe Extraction and Quantification
Total P and Fe concentrations in field pea seeds were determined using a previously described modified HNO3- H2O2 method [19]. Ground seed samples (500 mg) were digested in nitric acid (70% HNO3) at 90˚C for 1 h. Samples were further digested with hydrogen peroxide (30%) before being diluted to 10 mL with nano-pure water. Fe concentrations were measured using inductively coupled plasma emission spectroscopy (ICP-ES; ICP-6500 Duo, Thermo Fisher Scientific, Pittsburg, PA, USA). Total Fe measurements using this method were validated using National Institute of Standards and Technology (NIST) standard reference material 1576a (wheat flour; [P] = 1340 ± 100 mg·kg−1; [Fe] = 14.1 ± 0.1 mg·kg−1). A homogenized laboratory reference material (CDC Redberry: P = 3505 ± 100 mg·kg−1; Fe = 64 mg·kg−1) was also used periodically for quality control. A calibration curve for Fe concentration was produced using serial dilutions from 0.5 to 5.0 mg·L−1. Phytic acid-P concentration was calculated from the weight ratio of P atoms per molecule of phytic acid (1:3.56). Inositol 3 phosphate-P concentration was calculated from the weight ratio of P atoms per molecule of IP3 (1:4.52).
2.6. Statistical Analysis
For the germination study, the experimental design was a completely randomized design with five pea cultivars, three replicates per cultivar, and four harvesting dates. Data from replicates were combined and data error variances tested for homogeneity. For combined analysis, a mixed model analysis of variance was performed using the PROC GLM procedure of SAS version of 9.3 [20], with genotype, harvest days, and the interaction between genotype and harvest days as the class variables, and the term including the runs of the experiment defined as a random factor. A separate analysis of variance was performed for each harvest day to examine the effect of pea genotype on inositol-P forms (IP3 and IP4) and PA concentrations. Means were separated by Fisher’s protected least significant difference (LSD) at p < 0.05.
For the greenhouse study, the experimental design was a randomized complete block design with five pea cultivars, three replicates per cultivar, and four P fertilizer rates. Data from replicates were combined and data error variances tested for homogeneity. For combined analysis, a mixed model analysis of variance was performed as above, with genotype, P fertilizer rate, and the interaction between genotype and P fertilizer rate as the class variables, and the term including the runs of the experiment defined as a random factor. A separate analysis of variance was performed for each P fertilizer rate on pea genotype effect for PA, total P, and Fe concentrations as described above. Means were separated by Fisher’s protected least significant difference (LSD) at p < 0.05.
3. Results
3.1. Germination Study
Our results indicate low-PA field pea lines suffer no significant effects with respect to germination percentage (99%), seed viability (99%), weight of total plant biomass (12 - 15 g of biomass per pot), and seed weight (5 - 8 g of seeds per pot) compared to field pea cultivars grown under the same greenhouse conditions.
Before germination (day 0), the two field pea lines 1-2347-144 and 1-150-81, had IP3 concentrations significantly higher (2.9 and 3.2 mg·IP3·g−1, respectively) than the cultivars (range 2.0 - 2.3 mg·g−1·IP3) (Table 1). Mutant line IP3 concentrations were also significantly higher than field pea cultivars both 1 and 7 days after germination (Table 1). On day 3, IP3 concentrations in low-PA field pea line 1-2347-144 and CDC Striker began a decreasing trend; however, IP3 concentrations began to increase in low-PA line 1-150-81, CDC Golden, and DS Admiral. IP4 concentrations were very low (0.01 mg·g−1) during seed germination and throughout the study for all five cultivars studied (data not shown). Before germination (day 0), field pea cultivars had significantly higher PA concentrations (3.1 - 3.7 mg·g−1 of PA) than the low-PA field pea lines (1.3 - 1.4 mg·g−1) (Figure 1). As expected, PA concentration decreased 1 day after germination; however, PA appears to increase by day 3 or 5 for most lines (Figure 1). Overall, the PA concentration decreased over time from day 0 values for all field pea cultivars and lines except line 1-150-81.
Combined analysis for different P forms and total P indicates low-PA lines have significantly lower PA-P (0.3 - 0.4 mg·g−1) and higher IP3-P (0.6 - 0.7 mg·g−1) concentrations than the cultivars (0.7-0.9 mg g−1 PA-P; 0.4-0.5 mg·g−1 IP3-P) (Figure 2). Total P concentration
Table 1. Inositol-3-phosphate (IP3) concentration for seeds of three field pea cultivars and two low-PA lines during germination.

aMeans within a column followed by different letters are significantly different at p < 0.05. bSE, pool standard error of means calculated from ANOVA for each harvest day (n = 30).
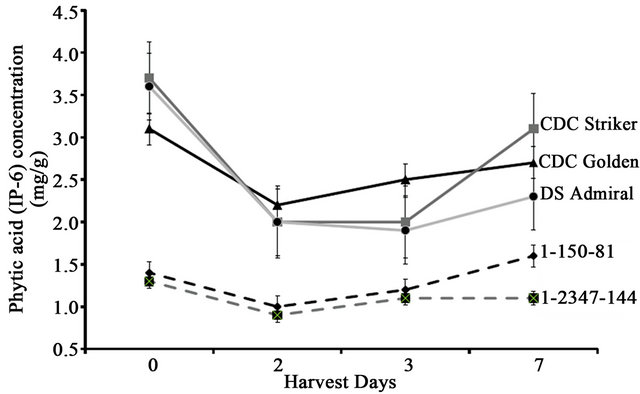
Figure 1. Phytic acid concentration of the seeds of three field pea cultivars and two low-PA lines during germination.

Figure 2. Different P forms (inorganic, IP6-P, IP3-P, and IP4-P) in the seeds of three field pea cultivars and two low-PA lines during germination. Data from combined statistical analysis for all harvesting days (n = 120).
ranged from 2.4 mg·g−1 for CDC Golden to 2.7 mg·g−1 for CDC Striker, DS Admiral, and 1-2347-144, to 2.9 mg·g−1 for 1-150-81. As expected, both low-PA lines had significantly higher inorganic-P concentrations than the field pea cultivars (Figure 2).
3.2. Greenhouse Study
Application of additional P fertilizer did not greatly increase PA concentrations in field pea seeds except at the 10 mg·kg−1 of P rate for the low-PA lines and CDC Striker (Table 2). The low-PA lines had significantly lower PA concentrations than all three cultivars at all of the P fertilizer rates considered. In the controls, CDC Golden had a significantly higher PA concentration (14.1 mg·g−1) than DS Admiral (10.6 mg·g−1), CDC Striker (7.9 mg·g−1), and the two mutant lines (2.3 - 2.7 mg·g−1). CDC Golden also had the highest PA concentration for all P fertilizer treatments (12.3 - 14.1 mg·g−1); low-PA lines had the lowest concentrations (2.3 - 3.5 mg·g−1).
Table 2. Response of phytic acid, total P, and Fe concentration in field pea seeds to P fertilizer for three field pea cultivars and two low-PA lines under greenhouse conditions.
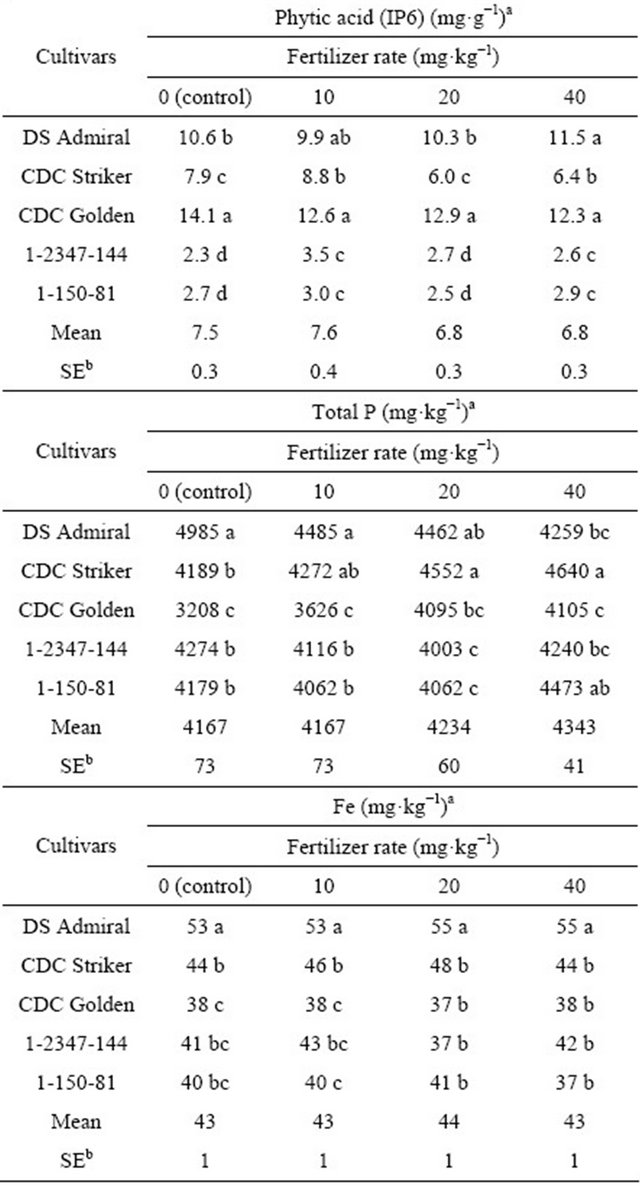
aMeans within a column followed by different letters are significantly different at p < 0.05. bSE, pool standard error of means calculated from ANOVA for P fertilization rate (n = 30).
Mean total P concentration among seeds of the field pea cultivars and low-PA lines increased with increasing P fertilizer rates (from 4167 to 4343 mg·kg−1); however low-PA lines had significantly lower total P concentrations at P fertilizer rates of 10 and 20 mg·kg−1 than the cultivars. In the controls, DS Admiral had significantly higher seed P concentration than all other field pea cultivars and lines; at higher P fertilizer rates (20 and 40 mg·kg−1), CDC Striker had significantly higher seed P concentration than all other tested cultivars and lines (Table 2).
Seed Fe concentration was largely unaffected by increasing P fertilizer rates. Mean seed Fe concentration among field pea cultivars and lines ranged from 43 to 44 mg·kg−1 (Table 2). DS Admiral had a significantly higher Fe concentration (53 - 55 mg·kg−1) than the others (37 - 43 mg·kg−1) regardless of P fertilizer rate (Table 2).
4. Discussion
myo-Inositol is a cyclic sugar alcohol derivative of glucose in the plant pyrophosphate pathway. Different myoinositol forms, including IP3, IP4, and IP6 or PA, have been identified in plants. Human diets rich in PA can significantly decrease the bioavailability of numerous minerals. Therefore, low-PA mutants were developed as a solution to increase mineral bioavailability in both human food and animal feed and to reduce P pollution to the environment. Several low-PA mutant lines have been developed for different cereal crops [2,21]; low-PA mutants of field pea have ~60% less PA-P (1.0 - 1.1 mg·g−1) and more inorganic P (1.0 - 1.1 mg·g−1) than commercial cultivar CDC Bronco (2.5 mg·g−1 PA-P; 0.25 mg·g−1 inorganic P;) [10].
Raboy et al. [22] demonstrated that altering PA levels of soybean seeds had no detectable effect on germination or viability. This study clearly indicates that low-PA field pea lines have more IP3-P and less IP6-P (PA) than field pea cultivars; cultivars and lines had similar IP-4 concentrations. The low-PA lines also had significantly higher inorganic P concentrations than the cultivars. Thus, low-PA lines appear to achieve their low-PA levels without notable changes in the profiles of other inositols or total P.
Seed PA plays three physiological roles; it is a P storage form, an energy source, and is critical to dormancy survival and germination, wherein the germinating seed hydrolyzes PA to inorganic P [2,23]. After germination, PA levels dropped by day 3 but began to increase again by day 7. Similarly, IP3 concentrations rapidly decreased by day 1 and further decreased 7 days after germination. These results are similar to reports by Williams [23] for wheat and Raboy et al. [22] for soybean. However, comparison of changes in other inositol P forms was not possible; previous studies did not report other inositol P forms. Moreover, myo-inositol P identification and quantification can be carried out by different analytical procedures, but most research quantifying PA in plants has utilized colorimetric procedures with or without separation of different inositol P forms [1,10,24]. At present, HPAEC-CD provides the best means to separate and quantify different inositol P [18,25]. The current study results based on HPAEC-CD analysis indicates IP3, IP4, and IP6 are the only inositol forms detectable in the study samples.
Total P in seeds and plant materials can generally be represented by the sum of inorganic phosphates and inositol phosphates. Despite comparable levels of total P to cultivars, low-PA mutants have higher levels of inorganic P. Similar results were reported for field pea [10] under field conditions and for soybean [22] under greenhouse conditions. This confirms the success of cautious efforts towards PA reduction, which proceeded with caution due to concerns regarding limiting impacts on seed germination and the ability of seeds to produce biomass.
Biofortification of most commonly eaten foods with essential mineral micronutrients (e.g., Fe, Zn, calcium (Ca), magnesium (Mg)) has been viewed as a food-based solution to reduce deficiencies in these micronutrients [15]. Mineral biofortified crops have been developed and pulses naturally biofortified with Fe, Zn, and selenium (Se) are available from the USA and Canada [26]. However, biofortification can only be meaningful when the biofortified minerals are bioavailable. Removal of antinutrient factors through PA reduction has been undertaken to increase mineral bioavailability [15]. The results of the current study confirm that low-PA mutants are low in PA; this alone is a positive factor for improving mineral bioavailability in human diets. In addition, the incorporation of low-PA field pea in animal feed should lead to increased mineral and P utilization and a reduction of P waste to the environment.
Soil P levels are positively correlated with PA accumulation in mature seeds of cereals and legumes [16,17]. In soybean, a single gene was identified for P uptake under low P soil levels [27]. Raboy and Dickinson [16] reported four-fold PA level increases in soybean resulting from P fertilizer treatments. In the two low-PA field pea lines, the greatest increase in PA occurred at the lowest P fertilization rate evaluated (10 mg·kg−1); however, total P levels decreased at intermediate P fertilization rates (10 and 20 mg·kg−1) and increased at the high P fertilizer rate (40 mg·g−1) (Table 2). Overall, low-PA field pea lines may have high P fertilizer use efficiency; however, further research is required to confirm this observation.
In summary, low-PA field pea lines have reduced PA levels with higher levels of IP3 than field pea cultivars. In addition, agronomic performances during germination were similar to cultivars. Therefore, utilization of lowPA field pea in human food and animal feeds may further increase mineral bioavailabilities. Future mineral bioavailability studies using low-PA field pea should be conducted to test the true efficacy of PA reduction in increasing human mineral bioavailabilities and feed P utilizations.
5. Acknowledgements
Financial support for this research was provided by the Northern Pulse Growers Association, the USA Dry Pea Lentil Council, and the NDSU Agricultural Experiment Station, Fargo, ND, USA.
REFERENCES
- V. Raboy, “Progress in Breeding Low Phytate Crops,” Journal of Nutrition, Vol. 132, No. 3, 2002, pp. 503S- 505S.
- K. Cichy and V. Raboy, “Evaluation and Development of Low-Phytate Crops,” Agronomy, Vol. 51, 2009, pp. 177- 200.
- A. N. Sharpley, S. C. Charpa, R. Wedepohi, J. Y. Sims, T. C. Daniel and K. R. Reddy, “Managing Agricultural Phosphorus for Protection of Surface Water: Issues and Options,” Journal of Environment Quality, Vol. 23, No. 3, 1994, pp. 437-451. doi:10.2134/jeq1994.00472425002300030006x
- U. Konietzny, K. D. Jany and R. Greiner, “Phytate: An Undesirable Constituent of Plant-Based Foods?” Journal fuer Ernaehrungsmedizin, Vol. 8, 2006, pp. 18-28.
- V. Raboy, P. F. Gerbasi, K. A. Young, S. D. Stoneberg, A. T. Pickett, A. T. Bauman, P. P. N. Murthy, W. F. Sheridan and D. S. Ertl, “Origin and Seed Phenotype of Maize Low Phytic Acid 1-1 and Low Phytic Acid 2-1,” Plant Physiology, Vol. 124, No. 1, 2000, pp. 355-368. doi:10.1104/pp.124.1.355
- S. R. Larson, K. A. Young, A. Cook, T. K. Blake and V. Raboy, “Linkage Mapping of Two Mutations That Reduce Phytic Acid Content of Barley Grain,” Theoretical and Applied Genetics, Vol. 97, No. 1-2, 1998, pp. 141- 146. doi:10.1007/s001220050878
- S. R. Larson, J. N. Rutger, K. A. Young and V. Raboy, “Isolation and Genetic Mapping of a Non-Lethal Rice (Oryza sativa L.) Low Phytic Acid 1 Mutation,” Crop Science, Vol. 40, No. 5, 2000, pp. 1397-1405. doi:10.2135/cropsci2000.4051397x
- M. Guttieri, D. Bowen, J. A. Dorsch, V. Raboy and E. Souza, “Identification and Characterization of a Low Phytic Acid Wheat,” Crop Science, Vol. 44, No. 2, 2004, pp. 418-424. doi:10.2135/cropsci2004.0418
- B. Campion, F. Sparvoli, E. Doria, G. Tagliabue, I. Galasso, M. Fileppi, R. Bollini and E. Nielsen, “Isolation and Characterisation of an lpa (Low Phytic Acid) Mutant in Common Bean (Phaseolus vulgaris L.),” Theoretical and Applied Genetics, Vol. 118, No. 6, 2009, pp. 1211- 1221. doi:10.1007/s00122-009-0975-8
- T. Warkentin, O. Delgerjav, G. Arganosa, A. U. Rehman, K. E. Bett, Y. Anbessa, B. Rossnagel and V. Raboy, “Development and Characterization of Low-Phytate Pea,” Crop Science, Vol. 52, No. 1, 2012, pp. 74-78. doi:10.2135/cropsci2011.05.0285
- V. Raboy, “Low Phytic Acid-Containing Corn Seed Mutant Construction and Selection (US5689054A),” United States Department of Agriculture, 1997.
- FAOSTATS, “Food and Agriculture Organization,” 2010. http://www.faostats.org
- N. Wang, D. W. Hatcher, T. D. Warkentin and R. Toews, “Effect of Cultivar and Environment on Physicochemical and Cooking Characteristics of Field Pea (Pisum sativum),” Food Chemistry, Vol. 118, No. 1, 2009, pp. 109- 115. doi:10.1016/j.foodchem.2009.04.082
- D. Amarakoon, D. Thavarajah, K. McPhee and P. Thavarajah, “Iron-, Zinc-, and Magnesium-Rich Field Peas (Pisum sativum L.) with Naturally Low Phytic Acid: A Potential Food-Based Solution to Global Micronutrient Malnutrition,” Journal of Food Composition and Analysis, Vol. 27, No. 1, 2012, pp. 8-13. doi:10.1016/j.jfca.2012.05.007
- R. M. Welch, “Breeding Strategies for Biofortified Staple Plant Foods to Reduce Micronutrient Malnutrition Globally,” Journal of Nutrition, Vol. 132, 2002, pp. 495S- 499S.
- V. Raboy and D. B. Dickinson, “Effect of Phosphorus and Zinc Nutrition on Soybean Seed Phytic Acid and Zinc,” Plant Physiology, Vol. 75, No. 4, 1984, pp. 1094- 1098. doi:10.1104/pp.75.4.1094
- D. Nikolopoulou, K. Grigorakis, M. Stasini, M. Alexis and K. Iliadis, “Effects of Cultivation Area and Year on Proximate Composition and Antinutrients in Three Different Kabuli-Type Chickpea (Cicer arientinum) Varieties,” European Food Research and Technology, Vol. 223, No. 6, 2006, pp. 737-741. doi:10.1007/s00217-006-0261-9
- P. Thavarajah, D. Thavarajah and A. Vandenberg, “Low Phytic Acid Lentils (Lens culinaris L.): A Potential Solution for Increased Micronutrient Bioavailability,” Journal of Agricultural and Food Chemistry, Vol. 57, No. 19, 2009, pp. 9044-9049. doi:10.1021/jf901636p
- D. Thavarajah, P. Thavarajah, A. Sarker and A. Vandenberg, “Lentils (Lens culinaris Medikus Subspecies culinaris): A Whole Food for Increased Iron and Zinc Intake,” Journal of Agricultural and Food Chemistry, Vol. 57, No. 12, 2009, pp. 5413-5419. doi:10.1021/jf900786e
- SAS Institute, “2005 SAS User’s Guide: Statistics,” Cary, North Carolina, 2005.
- V. Raboy, “Approaches and Challenges to Engineering Seed Phytate and Total Phosphorus,” Plant Science,” Vol. 177, No. 4, 2009, pp. 281-296. doi:10.1016/j.plantsci.2009.06.012
- V. Raboy, S. J. Hudson and D. B. Dickson, “Reduced Phytic Acid Content Does Not Have an Adverse Effect on Germination of Soybean Seeds,” Plant Physiology, Vol. 79, No. 1, 1985, pp. 323-325. doi:10.1104/pp.79.1.323
- S. G. Williams, “The Role of Phytic Acid in the Wheat Grain,” Plant Physiology, Vol. 45, No. 4, 1970, pp. 376- 381. doi:10.1104/pp.45.4.376
- N. Wang, D. W. Hatcher and E. J. Gawalko, “Effect of Variety and Processing on Nutrients and Certain AntiNutrients in Field Peas (Pisum sativum),” Food Chemistry, Vol. 111, No. 1, 2008, pp. 132-138. doi:10.1016/j.foodchem.2008.03.047
- P. Talamond, S. Doulbeau, I. Rochette and J. P. Guyot, “Anion-Exchange High-Performance Liquid Chromatography with Conductivity Detection for the Analysis of Phytic Acid in Food,” Journal of Chromatography A, Vol. 871, No. 1-2, 2000, pp. 7-12. doi:10.1016/S0021-9673(99)01226-1
- D. Thavarajah, P. Thavarajah, A. Wijesuriya, M. Rutzke, R. P. Glahn, G. F. Combs and A. Vandenberg, “The Potential of Lentil (Lens culinaris L.) as a Whole Food for Increased Selenium, Iron, and Zinc Intake: Preliminary Results from a 3 Year Study,” Euphytica, Vol. 180, No. 1, 2011, pp. 123-128. doi:10.1007/s10681-011-0365-6
- R. L. Bernard and R. W. Howell, “Inheritance of Phosphorus Sensitivity in Soybeans,” Crop Science, Vol. 4, No. 3, 1964, pp. 298-299. doi:10.2135/cropsci1964.0011183X000400030018x