Journal of Biomedical Science and Engineering
Vol.6 No.3(2013), Article ID:29138,7 pages DOI:10.4236/jbise.2013.63037
The influence of filters on the SPECT image of Carlson phantom
![]()
Department of Physics, University of Guilan, Rasht, Iran
Email: *Sadremomtaz@yahoo.co.uk
Received 20 December 2012; revised 27 January 2013; accepted 3 February 2013
Keywords: SPECT; Carlson Phantom; Filter; Cut-Off Frequency
ABSTRACT
Filter backprojection is an important method of image reconstruction technique in clinical nuclear medicine imaging. Because of noisy images due to less available photon statistics and different factors associated with imaging system in nuclear medicine tomography, using optimal filter to suppress the noise with keeping the proper signal is one of the significant steps in image reconstruction strategy for clinical use. In this paper, we present the effect of implementation of different filters on the hot region of Carlson phantom SPECT image in reconstruction process. By defining some criteria such as image smoothness and contrast, estimation of spatial resolution and location of hot cylindrical sources and their detectability the best filter with specified parameter have been determined and the results have been interpreted. Results show that the perceived image quality of hot region and also their detectability has been improved when Shepp-Logan and Ram-Lak filters with cut-off frequency of 0.4 has been used.
1. INTRODUCTION
Single Photon Emission Computed Tomography (SPECT) imaging is widely used in clinical nuclear medicine because of its beneficial role in diagnosis and management of diseases such as lymphoma cancer [1,2]. But, different factors such as; statistical nature of radioactive decay, scatter and attenuation of gamma ray, produced noise in electronic and photomultipliers tubes and detection efficiency of imaging system causes to degrade image quality, contrast and brightness in the obtained images by SPECT systems. One of the effective ways for compensation of image degradation and noise suppression use of filtered backprojection (FBP) method and implementation of smoothing filters which significantly affect the image quality. Despite of existence novel techniques of image reconstruction, this method is still the most widely used in practical experiment in nuclear medicine center, because of its facility and speed [3,4]. In this method, acquisition data from recorded gamma ray in SPECT heads are filtered and then backprojected by setting the entire arrays of the pre-defined image matrix along the ray pointing to the sample to the same value [5].
The filters used in SPECT imaging divided into different category; star artifact reduction filter, smoothing filters and restoration filters. All of these filters are always mathematical equations in frequency domain, because of speeding up the calculations. The choice of filter in the reconstruction process is generally trade of between the extent of noise suppression and fine detail reduction as well as the spatial frequency pattern of the image data. Indeed, the aim of filtering in filter backprojection method is to suppress produced noise and simultaneously to preserve spatial resolution and proper signal [6]. So, because image noise dominant in high frequency regions in Fourier domain, low-pass or smoothing filters are usually applied to projection images before reconstruction to reduce produced noise early in the process chain.
Degree of high frequency suppression in the filters has been done by selection of cut-off frequency which determines where the filter amplitude rolls off to zero. Thus, the choice of this parameter is trade of between the smoothness of the image and fine details detection of reconstructed images and it determines the size of the objects that will be removed from the image.
The purpose of this study is to determine the optimum filter function and cut-off frequency for SPECT images of radioactive water filled Carlson phantom. The results of this study have an important role in the clinical applications for lesion detection in the patient body because of different hot cylinder regions in the utilized phantom and similar attenuation coefficient between body tissue and phantom materials. Determining the optimal filter with selected cut-off frequency, can help to ensure the accurate diagnosis and defect size. These results can also help to speed up time of image processing since selection of optimal filter is very tedious and time-consuming in clinical experiment which being selected by trial and error [7].
2. MARTIALS AND METHODS
The Carlson phantom [8], as shown in Figure 1, was prepared by filling the water into the tank and the hot and cold regions inserts were placed in the phantom tank.
2.1. Imaging Protocol
The gamma camera used in this study was a dual head variable angle SPECT system, model ADAC EPIC Vertex. This system has been equipped with low energy high resolution (LEHR) collimator and using the following acquisition parameters: Matrix size 128,128 and 16-bit depth, magnification 2, window width 20%, distance of between shields to UFOV 9.4 cm, and step-and-shoot mode.
2.2. Processing
At first, Carlson phantom (see Figure 1) was filled by homogeneously distributing 5 mCi of Tc-99m and placed at the center of axis of rotation of the ADAC Dual head gamma camera SPECT system. The imaging was performed with the SPECT system. Then the raw data were transferred from SPECT workstation to MATLAB software. These data was reconstructed and processed by MATLAB image processing toolbox.
Our study focused on the transaxial view and slice numbers 83 to 89 in 3-dimention of reconstructed images of Carlson phantom. This slice related to 9 paired-holes as hot regions with 4.7, 5.9, 7.3, 9.2, 11.4, 14.3, 17.9, 22.4 and 38.5 mm diameters in the way of eight pairedholes with same diameter located on the opposite of each other and forming V-shape (Figure 1(c)). Images of these slices were produced by implementation of various filters with different parameters. Then, because of the improving uniformity and accurately of the reconstructed image of cylindrical sources, these slices were added

Figure 1. Carlson phantom showing the individual inserts for resolution and contrast assessments (a); the assembled phantom [8] (b); Schematic diagrams of 8 pairs holes as hot regions and drawn line profiles for evaluation of hot regions images (c).
together pixel by pixel.
A number of line profiles were drawn through the specified regions of reconstructed images by implementation of various filters to calculate different parameters from generated data. So that we draw two line profiles through the central section of two marginal holes images, symmetrically (line profiles A and B in Figure 1(c)), one line profile through the eight small aligned holes images (line profile C in Figure 1(c)) and another on the vacant region (line profile D in Figure 1(c)). Then, Gaussian distributions were fitted on the generated data of line profiles that passed through the holes. The fitting was done by “MATLAB” software and the full width at half maximum (FWHM) and central pixel of each Gaussian distribution has been calculated via standard deviation.
2.3. Types of Filtration
We used Hann, Hamming, Shepp-Logan, Cosine and Ram-Lak filters that defined in image processing toolbox of MATLAB software in the reconstruction process. We used the values of 0.1, 0.2, 0.3, 0.4, 0.5, 0.6, 0.7, 0.8 and 0.9 for the cut-off frequency of each filter. All the above values were selected blindly to cover the whole range of variables. A total of 45 filtering conditions were considered.
3. RESULTS
As mentioned, we draw two line profiles through the locations of two marginal holes in reconstructed image and fit two Gaussian curves on the generated data from each hole. Then, with standard deviations of each fitted Gaussian curve, their FWHM values were calculated under implementation of Hann, Hamming, Shepp-Logan, Cosine and Ram-Lak filters. And then, means values of FWHM for each filters with assigned cut-off frequency have been calculated. These results have been shown in the Figure 2.
On the other hand, center of Gaussian distribution fitted
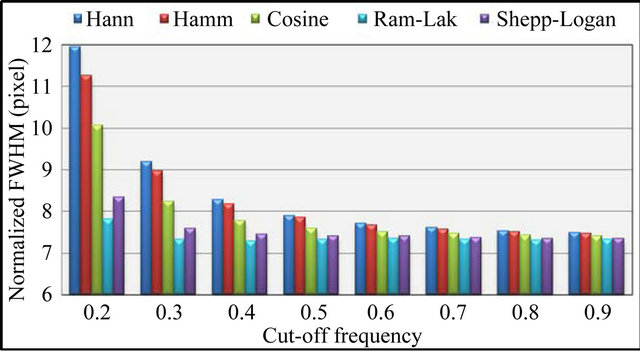
Figure 2. The mean FWHM of two marginal hot cylinders images vs. cut-off frequency under implementation of the Hann, Hamming, Shepp-Logan, Cosine and Ram-Lak filters.
on the line profile that passed through the lower hole, which produce better results than upper hole, in reconstructed image was calculated. These values were considered as center of hot cylinder and were drawn for various filters with different cut-off frequency in Figure 3.
3.1. Results of FWHM of Marginal Holes Images
We evaluate image of two marginal big holes by calculation of FWHM of fitted Gaussian curve on the line profiles A and B in Figure 1(c). Results show that the cut-off frequencies from 0.4 to 0.9 for Hann and Hamming filters, 0.5 to 0.9 for Cosine filter, 0.3 to 0.9 for Shepp-Logan filter and 0.2 to 0.9 for Ram-Lak filter were found to be potentially useful. Because the size of two marginal hot cylinders in the reconstructed images is always larger than actual value, lower values of FWHM is produced better results for accurate detection of hot cylinders. Calculations of the FWHM values for all of the filters show an improving in FWHM as the value of the cut-off frequency increases. But, for Ram-Lak filter this fact not existed and the values of FWHM almost are constant and the best value of FWHM achieve by cut-off frequency of 0.4.
Although, we averaged the results of the calculated FWHM of upper and lower holes images, but our investigations show that because of various attenuation coefficients in different direction, results of upper hot cylinder image are worse than lower.
3.2. Results of Central Pixel of Hot Cylinder Region
Central pixel of fitted Gaussian distribution on the line profile B was considered as center of lower cylinder location. This parameter for various filters with different parameters together with actual value of central pixel of lower cylinder was drawn in Figure 3. Results show that with increasing of cut-off frequency, estimated central

Figure 3. The variation of central pixel of lower hot cylinder image vs. cut-off frequency under implementation of the Hann, Hamming, Shepp-Logan, Cosine and Ram-Lak filters.
pixel has been changed. The variation of calculated central pixel related to their actual value was computed via standard deviation. These values were 0.138, 0.147, 0.158, 0.162, and 0.170 pixels for Shepp-Logan, RamLak, Cosine, Hann and Hamming filters, respectively.
3.3. Results of Detectably of Eight Aligned Holes
For evaluation of detectably of smaller holes, a line profile was passed through the eight small aligned holes images on the V-shape holes. Because of existence higher attenuation in the upper region, we focused on the right side of these holes arrangements. Results were fitted with a smoothing spline curve by MATLAB as shown in Figure 4 (because of similarity between results of acquired images by implementation of Hann and Hamming filters, only results of Hann filter has been shown). In this figure, results of implementation of various filters with different parameters in reconstruction process have been shown. The peaks in the diagrams are related to accumulation of radioactivity in each hole. So, the first hole produces the largest peak due to greater diameter than others and so on.
Diagrams show that higher peaks in all cases in the hot cylinder location are related to Ram-Lak and SheppLogan filters, respectively.
The interesting fact for these filters is low variation in the line profile of hot cylinders in the cut-off frequency values higher than 0.3. While, larger values of cut-off frequency will produce higher peaks for other filters. For Hann, Hamming and Cosine filters three peaks due to three hot cylinders and for Ram-Lak and Shepp-Logan filters four peaks due to four hot cylinders have been observed, obviously. It is noteworthy that although two peaks exist between 55 to 60 pixels for the Ram-Lak and Shepp-Logan filters diagrams in cut-off frequencies 0.8 and 0.9, but visual evaluation of images show that they are related to the accumulation of radioactivity in several aligned small holes that are seen as one peak. This pseudo-peak cause ambiguity in detection of the fourth peak in cut-off frequencies 0.8 and 0.9 of Ram-Lak and Shepp-Logan filters. Inspection of diagrams of these filters in Figure 4 shows that cut-off frequency of 0.4, which produce the four peaks and then have a flatten curve, is the best selection for better detectability of hot cylinders in the acquired phantom images.
3.4. Results of Image Smoothness in Cold Region
For assessment of image smoothness in cold region, a line profile was drawn on the desired cold region on the phantom image (line was drawn on the region between V-shape arrangement of cylindrical holes as line profile D in Figure 1(c)). We show obtained results under implementation of various filters with selected cut-off fre-
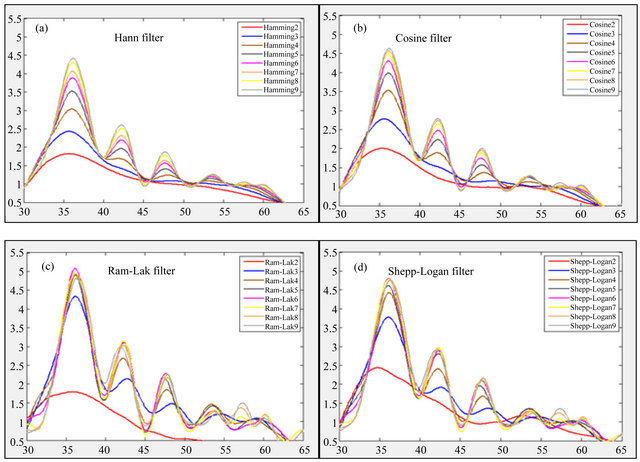
Figure 4. Diagrams of Line profiles that passed through the right side of V-shape arrangement of eight holes under implementation of the Hann (a); Cosine (b); Shepp-Logan (c) and Ram-Lak (d) filters with different cut-off frequencies.
quencies, which produced the best results in the former evaluations, in Figure 5. Furthermore, we also show result of implementation of Hann filter with cut-off frequency of 0.4 to compare effect of using low value of cut-off frequency of three other filters on the image smoothness. Results show that Hann filter with cut-off frequency of 0.4 produce smoother curve than others and the best result is related to this situation. And then, RamLak and Shepp-Logan filters with cut-off frequency of 0.4 and Hann and Hamming filters with cut-off frequency of 0.9 produce better results, respectively.
4. DISCUSSION
Results of calculated FWHM of big cylinders images in Figure 2 show that the values of FWHM have less variation for reconstructed image by implementation of Ram-Lak filter than others and minimum values of FWHM are obtained by it. In this diagram, same behavior of obtained results by implementation of Hann and Hamming filters are seen. And so, with increasing of the cut-off frequency values, the amount of FWHM under implementation of these filters will be close to each other. Results for Cosine filter always better than

Figure 5. Line profiles that passed through the cold region under implementation of the Hann, Hamming, Shepp-Logan, Cosine and Ram-Lak filters with specified cut-off frequency.
Hann and Hamming filters and worse than Shepp-Logan and Ram-Lak filters. So, we expect that the better detection of two marginal hot cylinders and their brightness are obtained by reconstructed images with Ram-Lak and Shepp-Logan filters with cut-off frequencies 0.4 - 0.9, respectively.
Results for calculating central pixel of marginal hot cylinder image, as shown in Figure 3, exhibit the same behavior for all filters, to some extent. Shepp-Logan and Ram-Lak with cut-off frequency of 0.4 and Hann and Hamming filters with cut-off frequency of 0.7 and Cosine filter with cut-off frequency of 0.6 are produced images that central pixel of hot cylinder image are almost coincidence with actual position. Although, variation in the calculated values by implementation of different filters are negligible.
Inspection of line profile that passed through the eight aliened holes on the V-shape arrangement (Figure 4) shows that for Hann, Cosine and Hamming filters with increasing of cut-off frequency, resolution and detection capability of smaller peaks, which is related to activity in the cylindrical holes with smaller radius, increased. So, this fact causes the more cylindrical holes with smaller radius were observed at higher values of cut-off frequencies. But for Ram-Lak and Shepp-Logan filters the best results are achieved in cut-off frequency of 0.4. Indeed, in this filters because of presences compress low peaks in 50 to 65 pixels for cut-off frequency larger than 0.6, the main peak related to fourth hole couldn’t be specified separately.
Examinations of images smoothness show that reconstructed image by Cosine filter have higher fluctuation in the drawn line profile than others. Then, we expect that low image quality has been existed for reconstructed image by implementation of this filter than others.
Until now, the assessment of all results shows that the best results for the detection capability and spatial resolution of hot regions with consideration of images smoothness for each filter are as following; Shepp-Logan and Ram-Lak filters with cut-off frequency of 0.4, Hann, Hamming and Cosine filters with cut-off frequency 0.9, respectively. Figure 6 shows reconstructed images of Carlson phantom under implementation of these filters with specified cut-off frequency. In this figure, we also show reconstructed image by Hann filter with cut-off frequency of 0.4 to represent an arbitrary image with smoother spectrum.
Due to high fluctuation in line profile that passed through the cold region (Figure 5), low image quality for reconstructed image by Cosine filter is quite obvious (Figure 6(a)). For this filter, detection capability of third cylinder in the right side of V-shape cylindrical holes is more difficult than others (with exception of produced image by Hann 0.4 filter).
Because of the higher uniformity of the reconstructed images by implementation of Hann and Hamming filters than Cosine filter, better image quality is achievable by them (Figures 6(b) and (c)).
In addition to, similar behavior of diagrams related to Hann and Hamming filters in Figures 1-5 cause similarity between the obtained images by implementation of these filters. On the other hand, fourth hole in the right side of V-shape holes is not still visible in this situation.
Image quality has been increased, with decreasing the cut-off frequency of Hann filter as shown in Figure 6(d). Indeed, in this situation the role of the filter is more efficient for smoothing as in the Figure 5 are obvious. But, this fact causes blurring of image and decreasing of detection capability of hot regions images, so that detection capability of second hole is even difficult in the V-shape holes arrangement.
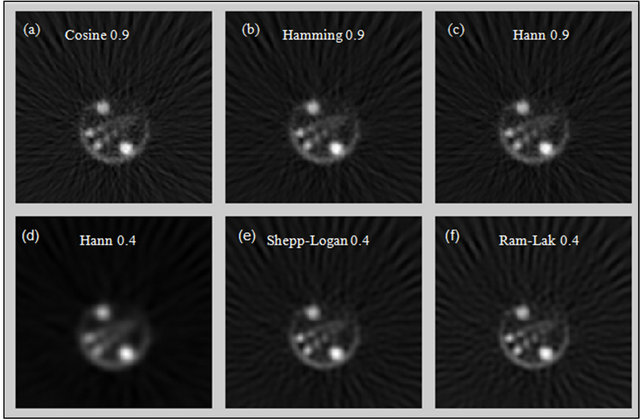
Figure 6. Images of hot regions section of Carlson phantom under implementation of Cosine (a); Hamming (b); Hann (c) and (d); Shepp-Logan (e) and Ram-Lak (f) filters with specified cut-off frequencies that noted above the each of the figure.

Figure 7. Histogram diagrams of represented images in Figure 6 for the Cosine (a); Hamming (b); Hann (c) and (d); SheppLogan (e) and Ram-Lak (f) filters with specified cut-off frequencies that noted above the each of the histogram.
Inspection of Figure 6 show that the best results for detection capability of hot sources are related to reconstructed image by Shepp-Logan and Ram-Lak filters (Figures 6(e) and (f)), so that fourth hole in the right side of V-shape holes is visible with using of these filters with cut off frequency 0.4 neither of other filters.
Histogram diagrams of represented images in Figure 6 have been shown in in Figure 7. Diagrams show that the best results for contrast are related to the Ram-Lak and Shepp-Logan filters. Afterward, the Hann and Hamming filters are produced the best contrast for reconstructed images.
Overall, inspection of Figures 1-7 show that the best results are related to Ram-Lak and Shepp-Logan filters with cut off frequency 0.4, respectively, that is obvious in Figure 6. But, Inspection of results shows that because of the better values of FWHM of hot sources images and higher produced peaks in the line profile that passed through the hot cylinders regions with Ram-Lak filter than Shepp-Logan filter, detection capability of fourth hole has been improved in reconstructed image by implementation of Ram-Lak filter than another, to some extent.
5. CONCLUSION
All the findings, quantitative analysis of the transaxial images of cylindrical hot regions of Carlson phantom showed that four hot cylinders images in the right side of V-shape arrangement holes only are visible separately with Ram-Lak and Shepp-Logan filters with cut-off frequency of 0.4, respectively. And so, accurate locations of radionuclide distribution have been produced in this situation. On the other hand, because of having smooth line profile in the cold region and sharp peak in the four hot regions of produced images by implementation of Ram-Lak and Shepp-Logan filters with cut-off frequency of 0.4, these filters with specified cut-off frequency is optimal selection. On the other hand, among the all filters with specific cut-off frequency that produced better quantitative results, better uniformity would be achieved by these filters. Despite of the Hann filter with cut-off frequency of 0.4 produce better image qualities with smoother spectrum, but it causes imperceptible of smaller hot region and image blurring.
![]()
![]()
REFERENCES
- Cherry, S.R., Sorenson, J.A. and Phelps, M.E. (2003) Physics in nuclear medicine. 3th Edition, Saunders, Philadelphia.
- Cullom, S.J. (2001) Principles of cardiac SPECT. In: Cardiac SPECT Imaging, Williams & Wilkins, Lippincott, USA.
- Kunyansky, L.A. (2001) A new SPECT reconstruction algorithm based on the Novikov explicit inversion formula. Inverse Problems, 17, 293-306. doi:10.1088/0266-5611/17/2/309
- Zeniya, T., Watabe, H., Aoi, T., Kyeong, M., Teramoto, N., Hayashi, T., Sohlberg, A., Kudo, H. and Iida, H. (2004) A new reconstruction strategy for image improvement in pinhole SPECT. European Journal of Nuclear Medicine and Molecular Imaging, 31, 1166-1172. doi:10.1007/s00259-004-1510-4
- Groch, M.W. and Erwin, W.D. (2000) SPECT in the year 2000: Basic principles. Journal of Nuclear Medicine technology, 28, 233-244.
- Lyra, M. and Ploussi, A. (2011) Filtering in SPECT image reconstruction. International Journal of Biomedical Imaging, 2011, 2011, 1-14. doi:10.1155/2011/693795
- Gilland, D.R., Tsui, B.M.W., McCartney, W.H., Perry, J.R. and Jan, B. (1988) Determination of the optimum filter function for SPECT imaging. Journal of Nuclear Medicine, 29, 643-650.
- IAEA (2009) Quality assurance for SPECT system. © IAEA, Vienna, IAEA Human Health Series No. 6.
NOTES
*Corresponding author.