Health
Vol.5 No.7A4(2013), Article ID:34214,8 pages DOI:10.4236/health.2013.57A4008
Changes in fat but not fruit and vegetable intakes linked with body weight change in Mexican women immigrants in Quebec
![]()
Department of Food Science and Nutrition, Laval University, Quebec, Canada; *Corresponding Author: helene.jacques@fsaa.ulaval.ca
Copyright © 2013 Elsa-Patricia Olivares-Navarrete et al. This is an open access article distributed under the Creative Commons Attribution License, which permits unrestricted use, distribution, and reproduction in any medium, provided the original work is properly cited.
Received 22 April 2013; revised 23 May 2013; accepted 15 June 2013
Keywords: Fruit and Vegetable Intake; Fat Intake; Body Weight; Immigration; Mexican Women; Quebec; Canada
ABSTRACT
The objective of the present study was to identify dietary parameters for predicting body weight change (ΔBW) in Mexican-born women (Mexicans) following immigration to Quebec City, Canada. Methods: Changes in fruit (ΔF), vegetable (ΔV), fruit and vegetable (ΔFV), and fat (ΔFat) intake were assessed according to post-immigration periods (1 - 5 years, 6 - 10 years, 11 - 20 years) using a food frequency questionnaire (FFQ). Anthropometric measures were also conducted in 87 Mexicans (study group) and 88 native-born Quebecers (comparison group) aged 18 - 65 years. Associations were calculated using full and partial robust regression models adjusting for potential confounders (origin, education, income, age, length of residence in Quebec City). Results: There was no difference in ΔBW between the groups. Body weight (BW) increased significantly in both Mexican (5.5 ± 0.9 kg, P < 0.0001) and Quebec women (4.7 ± 0.8 kg, P < 0.0001). ΔBW was positively correlated with ΔFat (β = 0.03, P = 0.003), but not correlated with origin, ΔF, or ΔV. ΔBW was negatively associated with education (β = –4.33, P = 0.007) and positively associated with length of residence (β = 0.3, P = 0.003). Partial models indicated ΔF (β = –1.35, P < 0.0001), ΔV (β = –1.04, P = 0.0001), and ΔFV (β = –2.27, P < 0.0001) were associated with origin, whereas net annual household income (β = 0.16, P = 0.04) was positively associated with ΔFat. Conclusions: Change in body weight could be predicted by length of residence, education, and change in fat intake in Mexican immigrant women and native-born Quebecers whereas changes in fruit and vegetable intakes could be predicted by Mexican or Quebec origin.
1. INTRODUCTION
Obesity is a global health problem that is not only acute in industrialized countries such the United States (US) and Canada, but also increasingly prevalent in developing countries such as Mexico. It is a leading contributor to type 2 diabetes, hypertension, and cardiovascular disease, and is linked with increased risk for some cancers. It is mostly related to high fat [1] and meat [2] consumption, low consumption of fruits, vegetables, and fiber [3-5], and insufficient physical activity [3,6,7]. In an era of increasing global population mobility and rapid economic and social changes, studying the relationships between immigration and obesity could shed further light on this multi-factorial phenomenon.
When immigrants first arrive in Canada, they generally have low susceptibility to chronic degenerative diseases and disabilities. This phenomenon, which has been observed irrespective of the immigrant’s origin, is called the “healthy immigrant effect” [8,9]. However, over time, immigrants’ health status converges with that of the host population [10]. Immigration status, income, gender, employment, discrimination, use of language, education, length of residence, lifestyles, and social network all interact to influence immigrant population health.
Studies [2] have shown deterioration of the US Latin American immigrants’ diet with “acculturation”, a process whereby immigrants progressively assume typically native-born habits. Less acculturated Latinos in the US and in Canada have healthier diets than more acculturated Latinos, independently of how acculturation is measured (length of residence, place of birth, preferred language, generation) [8,11]. In Quebec, Canada (1998-99), 71% of Latin immigrants had insufficient income to ensure good nutrition [9]; not surprisingly, only 21% of Latin immigrants had a food intake in line with Canada’s food guide.
The impact of Mexican immigrants’ food consumption in the US has been widely studied [12]. By contrast, in Canada, the second preferred immigration country for Mexicans [13], no such nutritional studies have been done. This study was thus undertaken to examine changes in food consumption—namely fruit, vegetable, and fat intakes—in women of Mexican origin following their immigration to Quebec City. It also examined whether changes in those dietary parameters predicted body weight change in this population. We hypothesized that, following their immigration, these women would reduce their fruit and vegetable intake and increase their fat intake, resulting in weight gain.
2. MATERIALS AND METHODS
2.1. Population
In 2006, there were 317,170 women aged 15 years and older in Quebec City, of whom 250 were Mexican immigrants [14,15]. Mexican women were recruited in the Quebec City metropolitan area through advertisements in the media, churches, day care centers, “francization centers” (centers for sociolinguistic integration), immigrants’ associations, Mexican restaurants, grocery stores, and at Laval University. Native-born Quebec women (referred to as Natives in this study) were mainly recruited from among students, workers, and participants in studies at Laval University. The snowball technique was used.
Inclusion criteria for the Mexicans were: being 18 - 65 years old, having resided 1 - 20 years in Quebec City, having lived in Mexico immediately before coming to Canada, having no chronic diseases, perceiving themselves to be in good health, and intending to remain in Canada. Inclusion criteria for Natives were: being 18 - 65 years old, being Canadian by birth and having parents and partners (if any) who were Canadians, having no chronic diseases, perceiving themselves to be in good health, and having lived in Quebec City at least one year. Exclusion criteria for both groups were: being pregnant or nursing, and having conditions requiring dietary restrictions (e.g. food allergies) at the time of the interview or of immigration (or corresponding period for Natives). Exclusion criteria for Mexicans were: having been raised from childhood in Quebec; living at least six months of the year in Mexico.
Quota sampling was used according to age (18 - 50 years and 51 - 65 years) and length of residence (for Mexicans: 1 - 5 years, 6 - 10 years, and 11 - 20 years). We started with a sample of 188 women. Of those, 13 (seven Mexicans and six Natives) were excluded due to missing data. Our final sample consisted of 175 women: 87 Mexicans (study group) and 88 Natives (comparison group). Mexicans and Natives were paired on age, and length of residence of each Mexican was paired with a corresponding time period in a Native. Hereinafter, the Mexican in these pairs will be referred to as the Native’s “counterpart”. The Research Ethics Committee of Laval University approved this study.
2.2. Measurements
Interviews and anthropometric measures were conducted between July 2010 and July 2011 with each participant in her native language, by the principal author (EO), a trained nutritionist. Participants received written information and signed a consent form. Participants answered a socio-demographic questionnaire followed by a food frequency questionnaire (FFQ). Before data collection, questionnaires were pretested in nine Latin and two Native women living in Quebec City. Accordingly, the date of arrival in Quebec City was added to the sociodemographic questionnaire, and some modifications, such as words added or modified to define certain food items, were made to the food list derived from an FFQ validated for Quebec [16,17]. Moreover, as already in the validated FFQ [16,17], there was an open question at the end of the questionnaire to allow participants to report any frequency of eaten foods not listed in the FFQ and give information about recipes used in order to better assess intakes of individual food items.
The socio-demographic variables of interest were ethnic origin (as proxy of immigration) (Mexicans, Natives), education (< or ≥ 13 years of education), net annual household income (Canadian dollars of all family members after taxes), age (years) and length of residence (for Mexicans, years since arrival in Quebec; for Natives, a period corresponding to that of their counterpart). Then, food consumption was assessed simultaneously for two one-month periods: T0 (past time), corresponding to the third month before immigration for Mexicans and the corresponding period for Natives, and one month before the interview, T1 (current time), for both groups. Data from the FFQ were analyzed with a food composition calculator developed specifically for this FFQ [16] to obtain fruit and vegetable intakes (servings/day) and fat intake (g/day) at T0 and T1. Changes in fruit (ΔF), vegetable (∆V), fruit & vegetable (∆FV), and fat (∆Fat) intakes were defined by calculating the difference between the estimated current and past intakes (T1-T0).
The fruit and vegetable groups in the FFQ included all fresh, canned, or frozen fruits and vegetables, juices, sauces (compotes), soups, leafy vegetables, fruiting vegetables, root vegetables, cabbages, mushrooms, grain and pod vegetables, onion, garlic, stalk vegetables and sprouts, legumes, mixed salads, and mixed vegetables. Because of their high fat content, olives and avocados were considered as fat. Dried fruit, because of high sugar content, were considered as candy [18]. Potatoes were assigned to the cereal group due to starch content [18]. Plastic models of foods in Canada’s Food Guide [19] and Mexico’s Tablas de Valor Nutritivo de los Alimentos [20] were used.
We collected data on body weight (BW) in three forms: self-reported past BW (kg), self-reported current BW (kg), and measured current BW (kg). Self-reported past BW corresponded to the weight the Mexican women recalled having just before immigrating to Quebec; for Natives it was the weight they recalled having at the corresponding period (T0). Self-reported current BW corresponded to the weight declared at the time of interview for both groups. The current BW (T1) was measured with a SECA 869 electronic scale at the end of the interview with participants wearing light indoor clothing and no shoes. Our main outcome, ΔBW, was calculated by subtracting measured current BW (T1) from self-reported past BW (T0) as a continuous variable (kg). Current height was assessed without shoes using a SECA 214 mobile stadiometer. Change in BMI was obtained by subtracting past BMI [(self-reported past BW)/(measured current height)2] (T1) from current BMI [(measured current BW)/(measured current height)2] (T0). To interpret BMI, we used the World Health Organization criteria [21].
2.3. Data Presentation and Statistical Analysis
The statistical analyses were performed with SAS 9.3 [22]. All statistical tests were two-sided, with statistical significance of P < 0.05. The sample size was calculated following the rule of thumb (minimum 10 cases by category of independent variables) and taking into account the prevalence of overweight and obesity in Mexicans, US. Mexican immigrants, and Canadians [1,2]. This resulted in a minimum sample size of 83 Mexicans and 83 Natives. Frequencies and percentages for sociodemographics were calculated, as well as means and standard errors for BW, fruit, vegetable, and fat intakes at T0 and T1. Subsequently, we used Student’s t-test for normally distributed data and the non-parametrical Wilcoxon test for skewed data to determine differences between T0 and T1 for Mexicans, for Natives, and for differences in terms of BW, fruit, vegetable, and fat intakes between Mexicans and Natives.
Given the presence of outliers, a robust multiple regression model (ROBUSTREG) was used to estimate the contribution of our parameters (ΔF, ΔV, and ΔFat) to ΔBW. We adjusted for origin, education, net annual household income, and length of residence. Age was excluded from this analysis because of collinearity with length of residence. Interaction between origin and length of residence, included in the model, allowed us to assess the effect of origin based on variations in length of residence.
Robust partial regression models were applied taking our independent variables as dependent variables (fruit, vegetable, and fat intakes) and co-variables as independent variables (origin, education, income, and length of residence).
3. RESULTS
3.1. Study Population
Table 1 presents the socio-demographic characteristics of the study population at the time of interview. The average ages of Mexicans and Natives were respectively 39 ± 1 years (SEM) and 40 ± 2 years (SEM); 42.5% of Mexicans (n = 37) were Canadian citizens and 42.5% (n
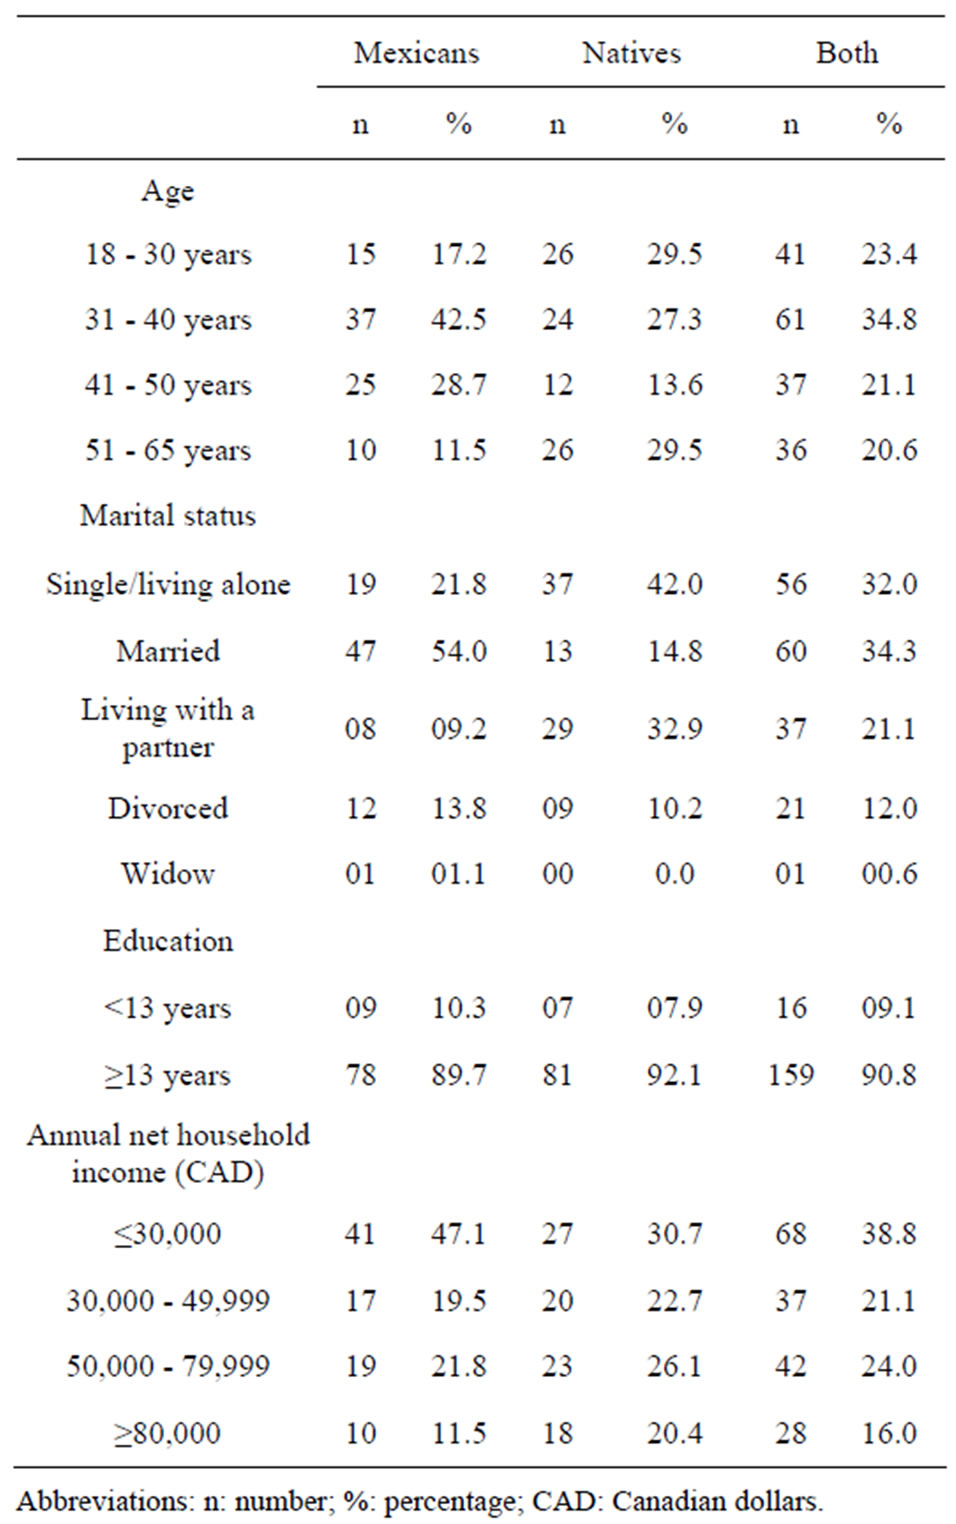
Table 1. Socio-demographic characteristics of the population studied at the time of the interview.
= 37) were permanent residents. Eight percent (n = 7) were tourists who had decided to stay in Canada, and 6.9 % (n = 6) were refugees. More than half (54%) of the Mexicans were married; 42% of the Natives lived alone and 32.9% lived with a partner. Both groups were equally educated. Finally, 47.1% (n = 41) of Mexicans had a net annual family income below 30,000 CAD, the lowest income category, whereas Natives’ incomes were more equally distributed across the four categories.
3.2. Change in Body Weight
Table 2 shows current and past body weight and BMI, ΔBW, and ΔBMI of both groups at corresponding periods. Self-reported current BW [Mexicans 66.0 ± 1.5 kg (SEM); Natives 62.9 ± 1.0 kg (SEM)] was strongly positively correlated (r = 0.98, P < 0.0001) with measured current BW [Mexicans: 66.5 ± 1.4 kg (SEM); Natives: 64.0 ± 1.0 kg (SEM)], indicating that body weights were reported with good accuracy. On average, self-reported past BWs were similar between Mexicans [61.0 ± 1.2 kg (SEM)] and Natives [59.3 ± 0.9 kg (SEM)] (P = 0.676). Average BW increased by 5.5 ± 0.9 kg (SEM) for Mexicans and by 4.7 ± 0.8 kg (SEM) for Natives, showing no difference in average weight gain between the two groups (P = 0.600). Average BMI increased by 2.1 ± 0.3 kg/m2 (SEM) in Mexicans and by 1.8 ± 0.3 kg/m2 (SEM) in Natives. No difference in BMI change was observed between the two groups (P = 0.470).
Figure 1 shows ΔBW according to length of residence. In both groups, BW increased with length of residence. No differences were found between Mexicans and Natives in any of the three residence periods.
3.3. Predictors of Change in Body Weight
Table 3 illustrates a robust multiple linear regression model for ΔBW in Mexican women immigrants and Natives. This model explained 13% of variance (R2) in ΔBW. Age was collinear with length of residence and was thus excluded from the model. No difference in ΔBW between Mexicans and Natives was observed. However, BW increased by 0.34 kg for each year of residence (P = 0.003). ΔFat intake was generally positively associated with ΔBW; while the other variables and covariables remained constant, BW increased by 0.03 kg when fat intake increased by 1 g a day (P = 0.003). Participants with more education (≥13 years), seemed to have avoided gaining 4.33 kg compared with less educated participants (<13 years) when length of residence and other variables and co-variables remained constant (P = 0.007). The relationship between ΔBW and length of residence was similar for both groups.
Robust partial regression models presented in Table 4 show a negative association between ΔF, ΔV, and ΔFV and origin. According to these models, Mexicans decreased their average fruit, vegetable, and fruit & vegetable intakes by 1.35 servings/day (P < 0.0001), 1.04 servings/ day (P = 0.0001), and 2.27 servings/day (P < 0.0001), respectively, compared with Natives after adjusting for education, income, and length of residence. No effect of origin was observed on ΔFat. On the other hand, income was positively associated with ΔFat. For each 1000 CAD of net annual household income, average fat intake increased by 0.16 g/day (P = 0.04). The partial models explained 10.4%, 8.2%, 13.2%, and 2.0% of variance (R2) in ΔF, ΔV, ΔFV, and ΔFat, respectively.
4. DISCUSSION
The present study showed that BW increases observed in the Mexican immigrants and native-born Quebec women could be predicted by length of residence, changes in fat intake (ΔFat), and education, but not by origin. Our results only partly support our hypothesis, in that, following their immigration to Quebec City, the Mexican women reduced their intakes of fruits and vegetables but did not increase their fat intake compared with Natives. On average, the Mexicans decreased their fruit, vegetable, and fat intakes after immigration, but unexpectedly, there was no association between changes in fruit (ΔF) and vegetable (ΔV) intakes and ΔBW. Rather,

Table 2. Current and past body weight (BW) and BMI and the differences (current-past) in Mexicans (since immigration) and Natives (corresponding period).

Figure 1. Changes in body weight (BW) (current-past) in the Mexicans (since immigration) (Δ1) and Natives (corresponding period) (Δ2) according to length of residence. Values are mean ± standard of the mean (SEM). 1 - 5 years of residence (n = 45 Mexicans and 36 Natives; P > 0.05), 6 - 10 years of residence (n = 26 Mexicans and 28 Natives; P > 0.05), 11 - 20 years of residence (n = 16 Mexicans and 24 Natives; P > 0.05).
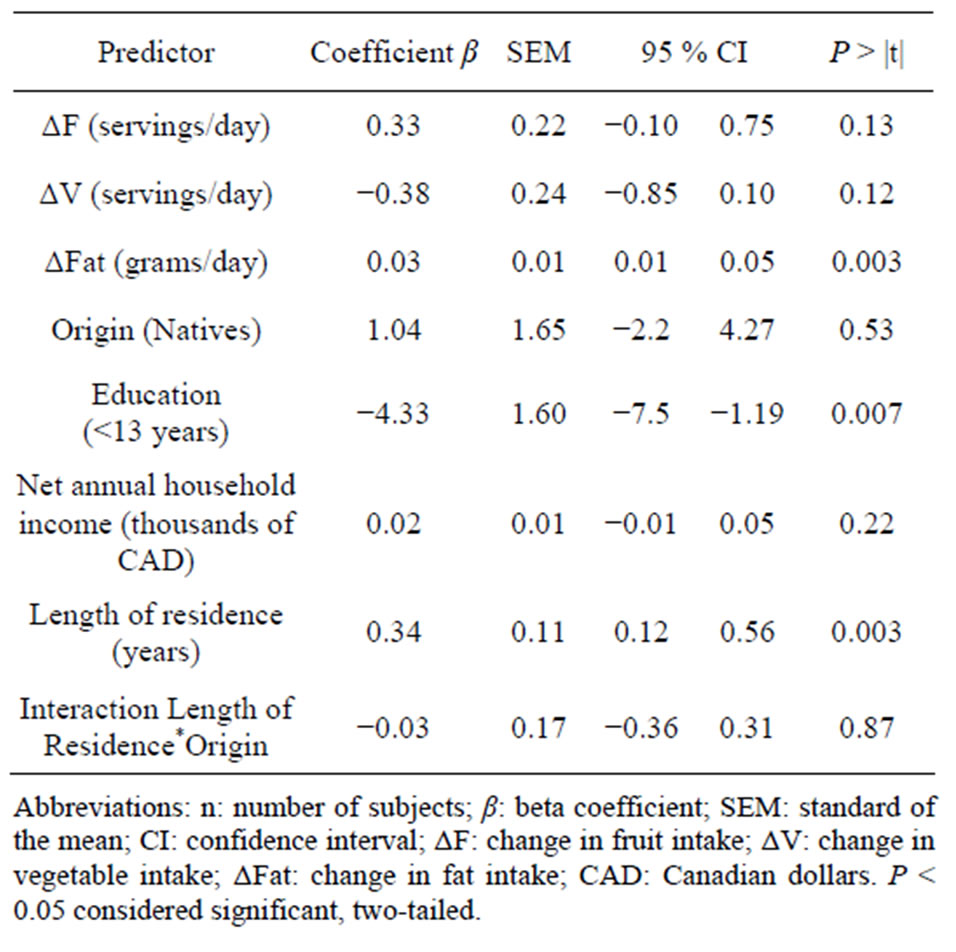
Table 3. Robust multiple linear regression model for weight change in Mexicans since immigration and in Natives (n = 175).
changes in fruit, vegetable, and fruit & vegetable intakes were predicted by Mexican or Quebec origin.
Mexicans’ weight gain corresponded to Natives’ levels. The observed lack of difference in weight gain between both groups (Table 2) and lack of association between increased weight and origin (Table 3) are consistent with other findings showing that immigrants (all origins) living in Montreal, province of Quebec, or in Toronto, in the neighboring province of Ontario, are not at higher risk of developing excess weight than non-immigrants [23,24]. Also, in the present study, with additional years in Quebec City, BW of both Mexicans and Natives increased gradually. Higher BW associated with length of residence has been reported in Latino immigrants to the US and may be due to acculturation processes such as adopting some unhealthy practices of their new environment [25]. It may also be that the loss of supportive factors from the immigrants’ society of origin would result in loss of healthy behaviors and their replacement with unhealthy behaviors [25].
The full regression model showed a positive association between weight gain and increased fat intake. As total fat intake is representative of total energy intake, which is a key factor in weight change [26], this result is consistent with findings in other studies [27,28]. However, we observed on average a reduction of fat intake in Mexicans (–15 g/day; P = 0.0008) and in Natives (–23 g/day; P < 0.0001). This result suggests that if the fat intake had been increased, the weight gain would have been greater. Nevertheless, in partial models, we observed that fat intake increased by 0.16 g/day for each 1000 CAD of net family income earned per year, suggesting that higher income promotes fat intake. Furthermore, we cannot exclude the possibility that other factors not included in our model, such as consumption of other high energy food components (e.g. simple carbohydrates), physical activity, pregnancy, or stress factors such as unemployment, may have exerted a greater influence than fat intake on weight gain.
The negative association between ΔBW and education seen in the present study is consistent with that observed by Nayga [29], who found that knowledge was inversely related to the probability of developing obesity. However, we observed that even though 89.7% of the Mexicans in our sample had ≥13 years of education, they had gained weight. Low income [30], lack of time to prepare homemade food, colder climate, weak social network, family separation, unfamiliarity with the new place, and necessity of working outside the home [2] could be other confounding factors.
The partial robust models demonstrated that ΔF, ΔV, and ΔFV were associated with origin. Indeed, the Mexicans decreased their fruit (β = –1.35; CI –1.92 to –0.78, P < 0.0001), vegetable (β = –1.041; CI –1.56 to –0.51, P < 0.0001) and fruit & vegetable (β = –2.27; CI –3.18 to –1.36, P < 0.0001) intakes following immigration. These results are consistent with US studies showing that highly acculturated Latinos eat fewer fruits and vegetables than do those who are less acculturated [31]. These decreases in fruit and vegetable intakes in Mexicans could be due to financial constraints [32]. Nearly half of the
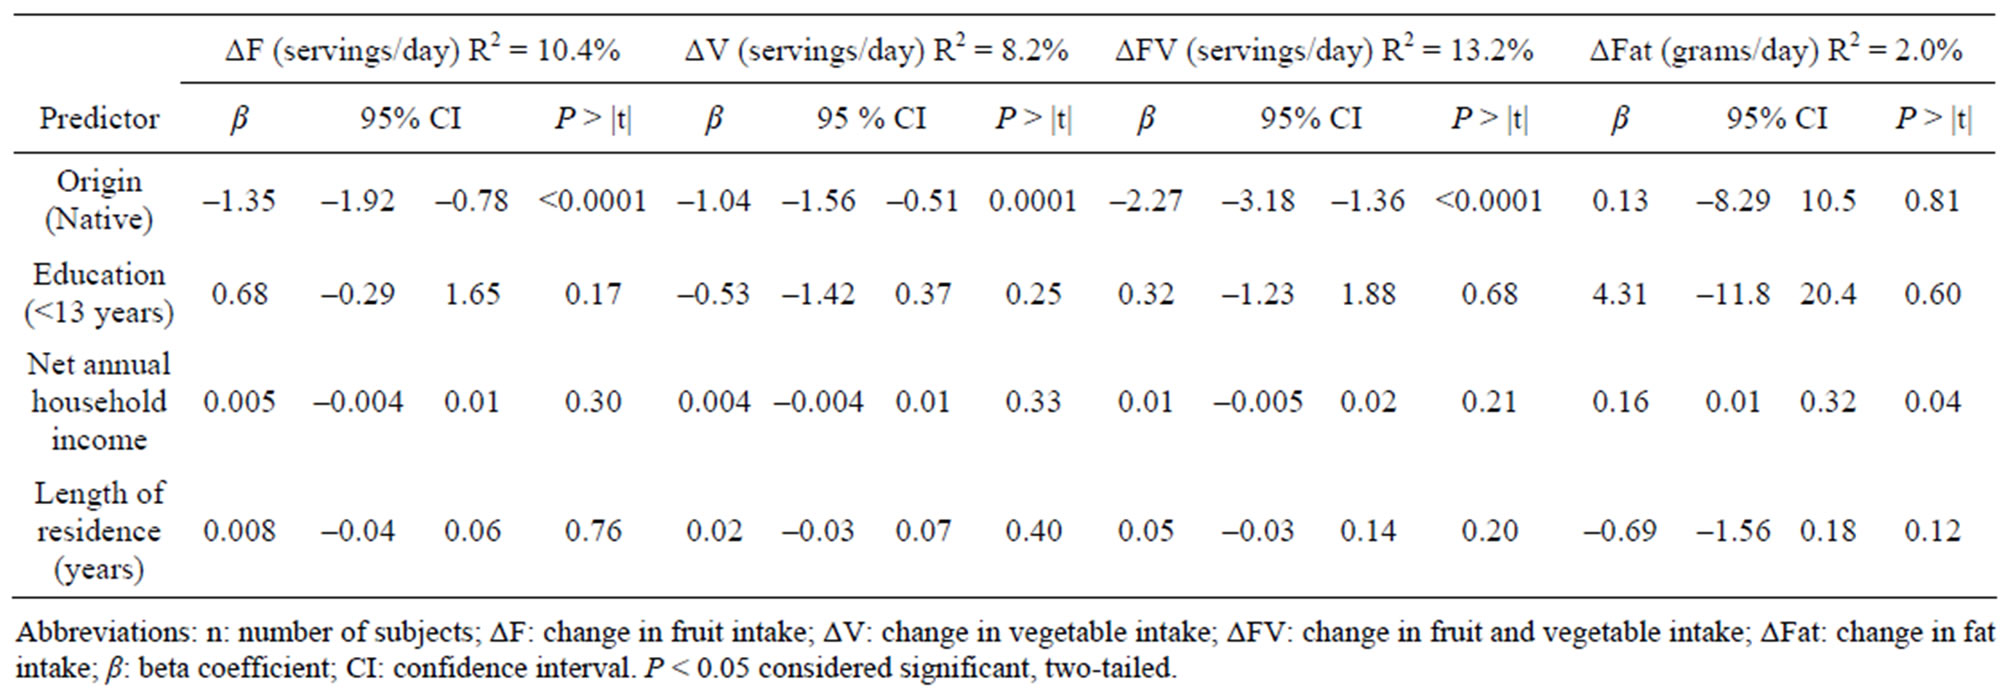
Table 4. Robust partial multiple linear regression models for changes in fruit, vegetable, and fat intakes in Mexican immigrant women since immigration and in Natives (n = 175).
Mexican women in this study had low incomes and could barely afford to buy fruits and vegetables. Other possible explanations include lack of knowledge about the fruits and vegetables available, different taste, and lack of time to prepare food [33-35]. Lack of consensus on what is considered a fruit or a vegetable and on what constitutes a serving of either could also hamper comparison of results between studies, which could produce a bias.
This study thus presents certain limitations. First, although we used the same standardized FFQ and procedures in both groups, there could be a cultural bias due to different perceptions of Mexican immigrants and Natives regarding their food intakes. Also, it was administered in two languages (Spanish for the study group and French for the comparison group) by a single trained interviewer who had the same culture and language as the study group. Second, memory bias cannot be completely excluded. To minimize such bias, we based our interview methodology on studies in which dietary intake was successfully evaluated in the past [36,37]. Finally, concern could be raised regarding the reliability of self-reported past body weight. In this regard, in a lifelong growth study in the US, long-term memory of BW covering up to 50 years was found to be reliable [38].
In sum, results from this research identified ΔFat intake, length of residence, and education, but neither ΔF or ΔV intakes nor origin, as predictors of ΔBW in Mexican-born immigrant women following their arrival in Quebec City. In this study, immigration to Quebec City was a predictor of ΔF, ΔV, and ΔFV in the study group of Mexican women. The results of this study support recommending to both groups of women that they reduce fat intake to minimize weight gain, but especially Mexican immigrants with low education and income. Future studies with Mexicans and other subgroups of Hispanic immigrants [39,40] are needed to test determinants of obesity not assessed in this study, such as physical activity, pregnancy, and chronic stressors related to adaptation to a new country.
5. ACKNOWLEDGEMENTS
The authors jointly collaborated on the proposal, developed the instruments and the details of data collection, and analyzed and interpreted the data. Elsa-Patricia Olivares-Navarrete supervised data collection at Laval University. All three authors met frequently to discuss and revised the manuscript and approved the final version. The authors wish to thank all the participants in the study, Melissa Mercier for help in cleaning up the database, and Hélène Crépeau M.Sc. (statistics), for assistance with the statistical analysis. We also thank the National Council of Science and Technology of Mexico for its support.
REFERENCES
- Williams, D.E.M., Prevost, A.T., Whichelow, M.J., Cox, B.D., Day, N.E. and Wareham, N.J. (2000) A cross-sectional study of dietary patterns with glucose intolerance and other features of the metabolic syndrome. British Journal of Nutrition, 83, 257-266.
- Ayala, G.X., Elder, J.P., Campbell, N.R., Slymen, D.J., Roy, N., Engelberg, M. et al. (2004) Correlates of body mass index and waist-to-hip ratio among Mexican women in the United States: Implications for intervention development. Women’s Health Issues, 14, 155-164.
- Schroder, K.E. (2010) Effects of fruit consumption on body mass index and weight loss in a sample of overweight and obese dieters enrolled in a weight-loss intervention trial. Nutrition, 26, 727-734.
- Du, H., Van der A., D.L., Boshuizen, H.C., Forouhi, N.G., Wareham, N.J., Halkjær, J., et al. (2010) Dietary fiber and subsequent changes in body weight and waist circumference in European men and women. American Journal of Clinical Nutrition, 91, 329-336.
- Mattei, J., Malik, V., Hu, F.B. and Campos, H. (2012) Substituting homemade fruit juice for sugar-sweetened beverages is associated with lower odds of metabolic syndrome among Hispanic adults. Journal of Nutrition, 142, 1081-1087.
- Chaput, J.P., Sjödin, A.M., Astrup, A., Després, J.P., Bouchard, C. and Tremblay, A. (2010) Risk factors for adult overweight and obesity: The importance of looking beyond the “big two”. Obesity Facts, 3, 320-327.
- Plourde, H., Nolin, B., Receveur, O. and Ledoux, M. (2010) Psychosocial correlates of body mass index in four groups of Quebec adults. Journal of Biosocial Science, 42, 601-618.
- Vissandjee, B., Desmeules, M., Cao, Z., Abdool, S. and Kazanjian, A. (2004) Integrating ethnicity and migration as determinants of Canadian women’s health. BioMed Central Women’s Health, 4, S32.
- Pica, L. (2004) Faits saillants de l’Étude auprès des communautés culturelles 1998-1999 sur les immigrants originaires des pays hispanophones des Amériques. Québec: Institut de la statistique du Québec, 1-8.
- Goel, M.S., McCarthy, E.P., Phillips, R.S. and Wee, C.C. (2004) Obesity among US immigrant subgroups by duration of residence. Journal of the American Medical Association, 292, 2860-2867.
- Lara, M., Gamboa, C., Kahramanian, M.I., Morales, L.S. and Hayes-Bautista, D.E. (2005) Acculturation and Latino health in the United States: A review of the literature and its sociopolitical context. Annual Review of Public Health, 26, 367-397.
- van-Rompay, M.I., McKeown, N.M., Castaneda-Sceppa, C., Falcón, L.M., Ordovás, J.M. and Tucker, K.L. (2012) Acculturation and sociocultural influences on dietary intake and health status among Puerto Rican adults in Massachusetts. Journal of the Academy of Nutrition and Dietetics, 112, 64-74.
- Organisation for Economic Co-operation and Development (OECD) (2009) Country notes—Mexico. In: Latin American Economic Outlook 2010. OECD Publishing, Paris, 237-240.
- Statistics Canada (2006) Place of birth for the immigrant population by period of immigration, 2006 counts and percentage distribution, for Canada, provinces and territories. http://www12.statcan.ca/census-recensement/2006/dp-pd/hlt/97-557/T404-eng.cfm?Lang=E&T=404&GH=4&GF=1&SC=1&S=1&O=D
- Statistics Canada (2006) Age and sex, 2006 counts for females, for Canada and census metropolitan areas and census agglomerations—100% data. http://www12.statcan.ca/census-recensement/2006/dp-pd/ hlt/97-551/pages/Page.cfm?Lang=F&Geo=CMA&Code=01&Table=1&Data=Count&Sex=3&StartRec=101&Sort=2&Display=Page&CSDFilter=5000
- Goulet, J., Nadeau, G., Lapointe, A., Lamarche, B. and Lemieux, S. (2004) Validity and reproducibility of an interviewer-administered food frequency questionnaire for healthy French-Canadian men and women. Nutrition Journal, 3, 1-10.
- Paradis, A.M., Fontaine-Bisson, B., Bossé, Y., Robitaille, J., Lemieux, S., Jacques, H., et al. (2005) The peroxisome proliferator-activated receptor a Leu162Val polymorphism influences the metabolic response to a dietary intervention altering fatty acid proportions in healthy men. American Journal of Clinical Nutrition, 81, 523-530.
- Pérez-Lizaur, A.B., Palacios-González, B. and Castro-Becerra, A.L. (2008) Sistema Mexicano de Alimentos Equivalentes. Fomento de Nutrición y Salud, Mexico.
- Health Canada (2011) Canada’s food guide. http://www.hc-sc.gc.ca/fn-an/food-guide-aliment/index-eng.php
- de Chávez, M.M. and Ledesma, J.A. (2002) Tablas de valor nutritivo de los alimentos. McGraw Hill Interamericana, Mexico.
- World Health Organization (WHO) (2003) Obesity: Preventing and managing the global epidemic. WHO technical report series 894. World Health Organization, Geneva.
- Statistical Analysis System (SAS) Online Documentation® 9.3 (2010) Cary, NC: SAS Institute Inc. http://support.sas.com/ documentation/93/index.html
- Bergeron, P., Auger, N. and Hamel, D. (2009) Poids, santé générale et santé mentale: La situation de divers sousgroupes d’immigrants au Canada. Canadian Journal of Public Health/Revue Canadienne de Santé Publique, 100, 215-220.
- Toronto Public Health (2011) Toronto’s health status indicators: Overweight and obesity by immigrant status. http://www.toronto.ca/health/map/indicators/pdf/overweightandobesitybyimmigrantstatus.pdf
- Kaplan, M.S., Huguet, N., Newsom, J.T. and McFarland, B.H. (2004) The association between length of residence and obesity among Hispanic immigrants. American Journal of Preventive Medicine, 27, 323-326.
- Nicklas, T.A., O’Neil, C.E. and Fulgoni, V.L. (2012) Diet quality is inversely related to cardiovascular risk factors in adults. Journal of Nutrition, 142, 2112-2118.
- Schulz, M., Kroke, A., Liese, A.D., Hoffmann, K., Bergmann, M.M. and Boeing, H. (2002) Food groups as predictors for short-term weight changes in men and women of the EPIC-Potsdam Cohort. Journal of Nutrition, 132, 1335-1340.
- Wang, Y. and Beydoun, M. (2009) Meat consumption is associated with obesity and central obesity among US adults. International Journal of Obesity, 33, 621-628.
- Nayga, R.M. (2000) Schooling, health knowledge and obesity. Applied Economics, 32, 815-822.
- Popkin, B. and Gordon-Larsen, P. (2004) The nutrition transition: Worldwide obesity dynamics and their determinants. International Journal of Obesity and Related Metabolic Disorders, 28, S2-S9.
- Neuhouser, M.L., Thompson, B., Coronado, G.D. and Solomon, C.C. (2004) Higher fat intake and lower fruit and vegetables intakes are associated with greater acculturation among Mexicans living in Washington State. Journal of the American Dietetic Association, 104, 51-57.
- Murashima, M., Hoerr, S.L., Hughes, S.O. and Kaplowitz, S.A. (2012) Feeding behaviors of low-income mothers: Directive control relates to a lower BMI in children, and a nondirective control relates to a healthier diet in preschoolers. American Journal of Clinical Nutrition, 95, 1031-1037.
- Guillaumie, L., Godin, G. and Vézina-Im, L.A. (2010) Psychosocial determinants of fruit and vegetable intake in adult population: A systematic review. International Journal of Behavioral Nutrition and Physical Activity, 7, 2-12.
- Yeh, M.C., Ickes, S.B., Lowenstein, L.M., Shuval, K., Ammerman, A.S., Farris, R. et al. (2008) Understanding barriers and facilitators of fruit and vegetable consumption among a diverse multi-ethnic population in the USA. Health Promotion International, 23, 42-51.
- Pomerleau, J., Lock, K., McKee, M. and Altmann, D.R. (2004) The challenge of measuring global fruit and vegetable intake. Journal of Nutrition, 134, 1175-1180.
- Chavarro, J.E., Michels, K.B., Isaq, S., Rosner, B.A., Sampson, L., Willey, C., et al. (2009) Validity of maternal recall of preschool diet after 43 years. American Journal of Epidemiology, 169, 1148-1157.
- Byers, T., Marshall, J., Anthony, E., Fiedler, R. and Zielezny, M. (1987) The reliability of dietary history from the distant past. Journal of Epidemiology, 125, 999-1011.
- Casey, V.A., Dwyer, J.T., Berkey, C.S., Coleman, K.A., Gardner, J. and Valadia, I. (1991) Long-term memory of body weight and past weight satisfaction: A longitudinal follow-up study. American Journal of Clinical Nutrition, 53, 1493-1498.
- Newbold, K.B. and Danforth, J. (2003) Health status and Canada’s immigrant population. Social Science and Medicine, 57, 1981-1995.
- Wakimoto, P., Block, G., Mandel, S. and Medina, N. (2006) Development and reliability of brief dietary assessment tools for Hispanics. Preventing Chronic Disease, 3, A95.