Modern Economy
Vol.09 No.02(2018), Article ID:82728,17 pages
10.4236/me.2018.92023
Research on Self-Organization Ability of Regional Innovation System in China
Junrong Deng, Zhihua Wang
Xidian University, Xi’an, China

Copyright © 2018 by authors and Scientific Research Publishing Inc.
This work is licensed under the Creative Commons Attribution International License (CC BY 4.0).
http://creativecommons.org/licenses/by/4.0/


Received: January 9, 2018; Accepted: February 25, 2018; Published: February 28, 2018
ABSTRACT
Based on the self-organization theory, this paper analyzed the evolutionary characteristics and mechanism of instability, bifurcation, mutation and random “fluctuation” in the self-organization process of innovation system. Then an empirical study is made on specific and operational self-organization system, constructing innovation system self-organization ability evaluation index system, in order to study the path of self-organization ability judgment framework of regional innovation system in China. It analyzed and compared the path of a series of factors which are concerned with self-organization ability in regional innovation system in China. The results show that the degree of openness, non-equilibrium, fluctuation and non-linearity has positive influence on the self-organization ability of regional innovation system. From the regional perspective, the evaluation of innovation self-organization status in eastern China is obviously higher than that of central and western regions. Finally, it puts forward some suggestions according to the situation of each part, which provides some guiding significance for the corresponding innovation self-organization system in each region in China.
Keywords:
Regional Innovation System, System Evolution, Self-Organization Ability, Partial Least Squares (PLS), Path Lifting

1. Introduction
In the late 1980s and early 1990s, the research on innovation began to “system paradigm”, and a large number of scholars began to study innovation as a system, resulting in a number of concept including national innovation systems, regional innovation systems, technological innovation systems and industrial innovation systems. However, with the development of globalization and communication technology, on one hand economic activities spread worldwide and on the other hand, spatial agglomeration and localization trend is more and more obvious. Some experts also pointed out that the study of regionalization is even more important. In the context of globalization, the importance of this level of state to the impact of economy, R & D and innovation activities is gradually declining [1] . Research on regional innovation has drawn more and more attention from scholars [2] [3] [4] [5] [6] . The role of regional innovation in promoting regional economic development gradually highlights [7] . With regard to the regional innovation system, many domestic and foreign scholars have conducted research, such as the evolution of regional innovation system research, innovation ability research, efficiency research, environmental research, maturity research and so on. Among them, the research on the innovation ability of regional innovation system is divided into two categories: the influence of a special project on regional innovation ability and the influencing factors of regional innovation ability. For a special study: Michael Fritsch, Viktor Slavtcher (2007) [8] based on the knowledge of the relationship between university and regional innovation, it found that academic level and concentration is an important factor affecting regional innovation capacity. Zhao Dali, Gao Wei, Li Yanli’s results (2011) [9] show that knowledge transfer has a significant effect on the cultivation and promotion of regional innovation ability in China, and different regional knowledge transfer forms have different effects on regional innovation ability in China, and there are obvious difference in different innovation ability groups and different periods. Ran Guanghe, Xu Kun, Lu Zhaoyang’s results (2013) [10] show that the structure and efficiency of financial development have a positive effect on the regional innovation ability, and the financial development scale has no obvious effect on the regional innovation ability. The impact of FDI on regional innovation capability has obviously the double threshold effect based on the financial development level. Wan Guanghua, Fan Beilei, Lu Ming (2010) [11] , from the perspective of patent, constructed the regression model to analyze the inequality, and pointed out that the level of economic development, R & D investment, geographical location and openness are the main factors that cause the regional innovation ability inequality. And for the regional innovation system innovation ability of the influencing factors, Wei Shouhua, Wu Guisheng, Lv Xinlei (2010) [12] based on Based on Furman [13] and other national innovation ability analysis framework, analyzed the influencing factors of regional innovation ability from the provincial panel data in China from 1998 to 2007, from four areas including the basis of innovation foundation, industrial cluster environment, quality of production and technology spillover effect to build a regional innovation ability evaluation index system. For Shao Yunfei, Fan Yunfei, Tang Xiaowo (2011) [14] based on endogenous economic growth model, the fixed effect model was used to study the endogenous factors influencing the regional innovation ability.
It is not difficult to see that the past theory has studied the innovation capability of the regional innovation system in detail, but the regional innovation system is an organic whole of the interaction within the regional economic system, the social system and the natural system. Its essence is material, energy, information exchange with natural ecosystem through the enterprise production activities. Regional innovation system has the characteristics of self-organization, and is a self-organization process [15] . Therefore, in terms of self-organization ability, no scholars have studied the self-organization ability of innovative regional system according to the four basic conditions of self-organization theory. Some scholars have established a systematic evaluation system based on the framework of innovation system, such as China’s regional innovation capability index system constructed by China Science and Technology Development Strategy Research Group. These systematic index systems provide data support on the performance of various elements of China’s regional innovation system, but does not help from the indicators of the interaction and the overall role of the elements to determine the performance of innovative systems [16] . In addition, the current study on “self-organizing ability”, mostly focused on the community and the residents of cultural. Yang Guihua (2009) proposed the urban community self-organization ability index system, in his view the community self-organization ability refers to the community that does not require external forces of mandatory intervention, it can integrate, coordinate, maintain by itself, and then achieve an ability in ordering community public life [17] . Bian Xiaohong, Duan Xiaohu (2016) have analyzed the relationship between the construction of “heter-organization” and “self-organization” in the culture of poverty-stricken areas in China, and discussed the dilemma of the construction of “self-organization ability” of rural residents in poverty-stricken areas [18] . It constructs the index system of self-organization ability of regional innovation system based on several paradigms of self-organization system by using self-organization theory in the design of specific research methods. The relationship between the self-organization ability of the system and the degree of openness, the degree of non-equilibrium, the degree of fluctuation and the degree of non-linearity were tested by partial least squares regression. And the structural equation model based on the partial least squares method is used to reveal the relationship between the exogenous variables and the endogenous variables of the regional innovation system. Then, the corresponding scores of the endogenous variables and the exogenous variables in the Chinese provinces are obtained by path analysis, then conducted a regional analysis, and finally put forward the relevant recommendations to improve.
2. Regional Innovation System Self-Organization Capacity Structure Fitting
Self-organization theory is the study of phenomenon and law of system self-organization. Self-organization theory holds that a system’s evolution process from chaos to order or from low-level order to high-order must meet the four conditions including openness, non-equilibrium, fluctuation and non-linearity. Openness, non-equilibrium, fluctuation and non-linearity of the system constitute the basic characteristics of system self-organization.
2.1. Selection of the Variables
Based on the previous research and current situation, this article selects the following indicators.
1) Openness of the system. The degree of openness of regional innovation system is the characteristic basis of self-organization evolution. The innovation system must exchange material, energy and information with the outside world. The funds, talents and information obtained from it have a significant positive effect on the self-organization ability of the innovation system. This study selects three aspects as an indicator of openness. a) Collection of funds b) Absorption and utilization of talent c) Access to information [19] .
2) Non-equilibrium of the system. It is an important feature of self-organized evolution. “Non-equilibrium is the source of order,” the system is in an open and non-equilibrium state, the system is likely to fluctuate by fluctuations, from the original disordered state into a new orderly state. The non-equilibrium degree indexes in it are mainly based on a) Ideas for creation, exchange and adoption b) Multi-polarization of technological innovation resource c) Product variety diversification [20] .
3) Fluctuation of the system. It is the incentive and motivation for self-organizing evolution. The fluctuation degree indexes in it are mainly based on a) Entrepreneurial innovation preferences b) Employees innovation ideas c) Foreign investment d) Science and technology development e) National policy utilization [15] .
4) Non-linearity of the system. The non-linear degree of the system in it is reflected in the synergistic effect [19] .
5) Self-organization of the system. It chooses innovative outputs to study [19] .
Table 1 reports the evaluation index of self-organization ability of regional innovation system.
2.2. Processing of the Variables
The data are mainly from the “China Statistical Yearbook 2014/2015/2016”, “China Statistical Yearbook 2014/2015/2016”, the study object is China’s 31 provinces and autonomous regions and municipalities, because the data are from the yearbook statistics, are single-handed information, The reliability and validity of the data have been tested. The method adopted in it is using SPSS20.0 to replace the partial missing data, then making the logarithm of the data. Finally, the data is standardized.
3. Model Test
3.1. Convergence Validity Test
The judgment index of the convergence validity analysis is the normalized factor

Table 1. Evaluation index of self-organization ability of regional innovation system.
loading coefficient and the average variation extraction (AVE) of each latent variable. Table 2 reports the results of standardized load factor are as follows.
It can be seen that the load factor of each index is more than 0.75, and both pass the t value test. At the same time, the AVE of each latent variable (dimension) exceeds 0.7, which indicates that the scale has good convergence validity.
3.2. Discriminant Validity Test
The test of discriminant validity is to compare the absolute value of the correlation coefficient between the square root of AVE and other latent variables. Table 3 shows the results of discriminant validity test are as follows.
It can be seen that the AVE of each latent variable is greater than 0.50, and the square root of all latent variables AVE is greater than the absolute value of the correlation coefficient between the latent variables, which indicates that the discriminant has good discriminant validity.
3.3. Hypothesis
According to the previous theory, this study makes the following hypothesis in Table 4.
Establish initial hypothesis model of self-organizational capability structural equation of innovation system by Smart PLS. Graph 1 shows the structure of initial model.
3.4. Model Test
Table 5 presents the results of the model test. In this model, the AVE of all latent
Table 2. Standardized load factor.
Table 3. Discriminant validity test.
Table 4. Hypothesis.
Table 5. Model test.
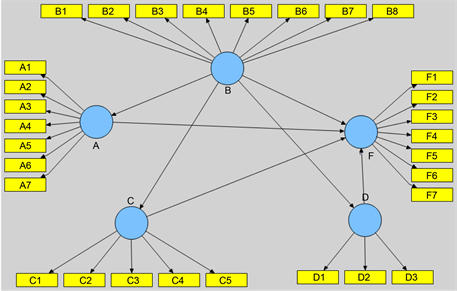
Graph 1. Initial model.
variables is greater than 0.7, exceeding the discriminant threshold of 0.5, indicating that the construction of the measurement model is reasonable; the combined reliability of all latent variables is greater than 0.85, indicating that the model is very reasonable; The fitting coefficient R2 of the variable is maintained at about 0.5, which also means that the model has further improved space. The common variance of all latent variables is more than 0.7, which indicates that the model is ideal. The goodness of Gof is 0.646, and it can be seen that the effect of model prediction is ideal.
Graph 2 gives a detailed structure of initial path coefficient. It can be seen from the Graph 2 that the path coefficient between the non-equilibrium degree B and the system self-organizing ability D is −0.315, which is inconsistent with the previous hypothesis. For this reason, the bootstrap re-sampling method is used to estimate the model. Table 6 shows the results of bootstrap test.
3.5. Model Modification
After removing the hypothesis H2 that has not passed the test, re-run the model
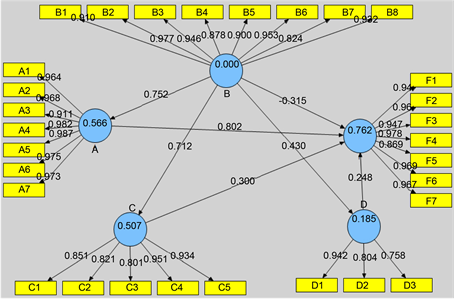
Graph 2. Initial path coefficient.
Table 6. Bootstrap test.
to get the final model. Graph 3 presents the final path coefficient.
After the correction, all the assumed t values are greater than the critical value of 1.962, indicating that the modified model of the path coefficient all passed. Table 7 reports the results of the final bootstrap test.
4. Utilization of Model
4.1. Index Weight
Since the path coefficient reflects the effect of the causal variable on the result variable, the larger the path coefficient, the greater the degree of influence. So the weight of each index is calculated by the path coefficient. Table 8 presents the results of indicator weight.
4.2. Evaluation Results
Through the above-obtained index weight, the ability of each province of the score can be further calculated. Table 9 reports the results of ability score of
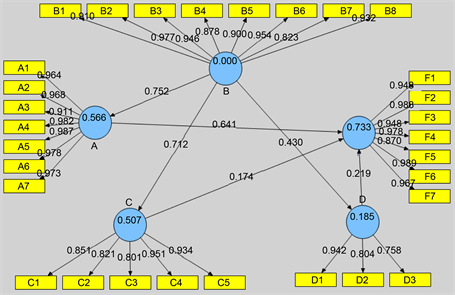
Graph 3. Final path coefficient.
Table 7. Final bootstrap test.
Table 8. Indicator weight.
each province.
So, China’s regional innovation system self-organization ability can be divided into five types. The first type has a higher capacity for the four parts; the second type has the ability to have three parts of the four parts; the third type has the ability to have two parts in the four parts; The fourth type is only one of the four parts is higher; the fifth type is the ability of the four parts are lower. Using the previous research ideas, put the ability value of each part into the two-dimension map (using mean of each part as the classification criteria; mean is zero). Figures 1-3 show the two-part matrix separately as follow.
4.3. Path Analysis
On the whole, according to the content of self-organization theory, the self-organization process is divided into four parts: degree of openness, non-equilibrium degree, fluctuation degree and non-linear degree. It can be targeted to different areas to take different ability to enhance Path, such as B → C and D → C mode: direct promotion method, that is, to enhance the region’s ability in innovation, at the same time, taking the weak part of the region as a starting point to improve the innovation of the region’s short board; for A → B → C and A → D → C mode, the incremental route is adopted by maximizing the advantages of the region first and making up for the disadvantages, through the transition of the B or D region, and finally towards the C region.
Table 9. The ability score of each province.
Specifically, Figure 1(A) For areas of C region, these areas are highly opened and unbalanced, such as Beijing, Shanghai, Guangdong, Zhejiang, Jiangsu, Shandong and other eastern coastal areas, these areas have a strong economic

Figure 1. The matrix of “openness-non-equilibrium”.

Figure 2. The matrix of “fluctuation-non-equilibrium”.

Figure 3. The matrix of “non-linearity-non-equilibrium”.
base and policy advantages, and also have the advantages of capital, talent, information and environmental aspects of supporting facilities. These regions should continue to invest in innovation, and in addition, the efficiency of innovation inputs should be strengthened. Figure 1(B) For areas near the origin of the standard line, such as Jilin, Hebei, Jiangxi, Chongqing, Shaanxi, Hunan and other places. For these areas, they have only one strong aspect of openness and non-equilibrium, and therefore should continue to strengthen the strong aspects of the capacity, while making up for disadvantages. Specifically, it is to maintain the investment in capital, talent, information, while strengthening the input of ideas for creation, exchange and adoption, multi-polarization of technological innovation resource, product variety diversification. Figure 1(C) For the A region, such as Qinghai, Ningxia, Tibet, Hainan, Inner Mongolia, Guizhou, Gansu and other regions. The basic idea of these areas is to adopt a progressive way to enhance the path, that is, A → B → C and A → D → C mode. On the one hand to strengthen the capital, personnel, information investment, on the other hand to enhance the efficiency of innovation.
Figure 2(A) For the C region, the level of fluctuation and non-equilibrium in these areas are high, these areas are mainly gathering in Jiangsu, Guangdong, Shanghai, Beijing, Shandong, Zhejiang and other regions. These areas should continue to strengthen innovation investment, while training for high-tech industry market demand Figure 2(B) For the B region, these areas are areas with a high degree of fluctuation rather than a low degree of equilibrium, such as Shaanxi, Anhui, Hubei, Hunan, Tianjin and other regions. The strategies of these regions are to enhance the efficiency of innovative resources and to make up for deficiencies in innovation. Figure 2(C) For areas of the D region, these areas are areas with low levels of fluctuation rather than high levels of equilibrium, such as Henan, Hebei, Jiangxi, Fujian, Jilin and other regions. The strategies of these areas are to cultivate high-tech industries, enhance market demand, and use national policies. Figure 2(D) For areas of A region, these areas are areas with low levels of fluctuation and non-equilibrium, such as Qinghai, Ningxia, Tibet, Hainan, Inner Mongolia, Guizhou, Gansu and other regions. The basic idea of these areas is to adopt a progressive way to enhance the path, that is, A → B → C and A → D → C mode. On the one hand taking efforts to cultivate the development of high-tech industries, enhance market demand, on the other hand to enhance the efficiency of innovation.
Figure 3(A) For the C region, the level of non-linearity and non-equilibrium in these areas is high, these areas are mainly gathering in Jiangsu, Guangdong, Shanghai, Beijing, Shandong, Zhejiang and other regions. These regions should continue to maintain innovation and efficiency, and in addition, regional and interregional synergies should be strengthened. Figure 3(B) For areas of B region, these areas are regions with high levels of non-linearity, such as Shaanxi, Gansu, Hebei, Hunan, and Heilongjiang. The strategies of these regions are to enhance the efficiency of innovative resources and make up for deficiencies in innovation.
Figure 3(C) For areas of the D region, these areas are regions with low levels of non-linearity and high levels of equilibrium, such as Chongqing, Jiangxi, Henan, Tianjin, Fujian and other regions. The strategies of these regions are to enhance synergistic levels of innovation within and across regions. Figure 3(D) For areas of A region, these areas are areas with low levels of non-linearity and non-equilibrium, such as Qinghai, Ningxia, Tibet, Hainan, Inner Mongolia, Guizhou, Gansu and other regions. The basic idea of these areas is to adopt a progressive way to enhance the path, that is, A → B → C and A → D → C mode. On the one hand to enhance regional and regional synergistic level of innovation, on the other hand to enhance the efficiency of innovation.
5. Conclusions and Policy Implications
This paper uses the partial least squares path analysis of weak hypothesis for small sample as a robust model to estimate the ability of four parts of regional innovation system self-organization, and study the self-organizing ability of each part.
The empirical results come to the following conclusions. First, the influence coefficient of openness on the self-organization ability of regional innovation system is 0.641; the influence coefficient of non-equilibrium degree on the self-organization ability of regional innovation system is 0.700; the influence coefficient of fluctuation degree on the self-organization ability of regional innovation system is 0.174. The influence coefficient of non-linearity on the self-organization ability of regional innovation system is 0.219. The effect of non-equilibrium degree and openness on the self-organization ability of regional innovation system is relatively large. The influence of fluctuation degree and non-linear degree on self-organization ability is slightly lower, which is consistent with self-organization theory. In addition, from the results of the region, the self-organization capacity of the various parts of the performance of the eastern region is significantly higher than the central and western regions. Based on the above research data, this study used two-dimensional matrix to divide the innovation capacity into four types, and then analyzed the path of innovation efficiency improvement in each region. From the matrix analysis, most parts of China’s innovation capacity have a greater room for improvement. At the same time, this paper puts forward some suggestions according to the situation of each part, which provides some guiding significance for the corresponding innovation self-organization system in each region.
Cite this paper
Deng, J.R. and Wang, Z.H. (2018) Research on Self-Organization Ability of Regional Innovation System in China. Modern Economy, 9, 362-378. https://doi.org/10.4236/me.2018.92023
References
- 1. Chung, S. (2002) Building a National Innovation System through Regional Innovation Systems. Technovation, 22, 485-491. https://doi.org/10.1016/S0166-4972(01)00035-9
- 2. Braczyk, H.J., Cooke, P. and Heidenreich, R. (1996) Regional Innovation Systems. London University Press, London.
- 3. Cooke, P., Gomez Uranga, M., Etxebarria, G. (1997) Regional Systems of Innovation: Institutional and Organisational Dimensions. Research Policy, 26, 474-491. https://doi.org/10.1016/S0048-7333(97)00025-5
- 4. Cooke, P., Boekholt, P. and Todling, F. (2000) The Governance of Innovation in Europe. Pinter, London.
- 5. Cooke, P. (2001) Regional Innovation Systems, Clusters and Knowledge Economy. Industrial and Corporate Change, 10, 945-974. https://doi.org/10.1093/icc/10.4.945
- 6. Doloreux, D. (2002) What We Should Know about Regional Systems of Innovation. Technology in Society, 24, 243-263. https://doi.org/10.1016/S0160-791X(02)00007-6
- 7. Gerstlberger, W. (2004) Regional Innovation Systems and Sustainability—Selected Examples of International Discussion. Technovation, 24, 749-758. https://doi.org/10.1016/S0166-4972(02)00152-9
- 8. Slavtchev, M.F.V. (2007) Universities and Innovation in Space. Freiberg Working Papers, 14, 201-218.
- 9. Zhao, D.L., Gao, W. and Li, Y.L. (2011) Research on the Influence of Knowledge Transfer Mode on Regional Innovation Capability. Journal of Scientific and Technological Progress, 28, 32-37.
- 10. Ran, G.H., Xu, K. and Lu, Z.Y. (2013) Effects of Financial Development and FDI on Regional Innovation Capability. Journal of Scientific Research Management, 34, 45-52.
- 11. Wan, G., Fan, B. and Lu, M. (2010) Analysis of China’s Innovation Capacity Inequality: Regression Based on the Decomposition Method. World Economy, No. 2, 3-14.
- 12. Wei, S., Wu, G. and Lei, L. (2010) Influencing Factors of Regional Innovation Capability—Comment on the Regional Disparity of China’s Innovative Capability. China Soft Science, No. 9, 76-85.
- 13. Furman, J.L., Porter, M.E. and Stern, S. (2000) The Determinants of National Innovative Capacity. Research Policy, 31, 899-933. https://doi.org/10.1016/S0048-7333(01)00152-4
- 14. Shao, Y., Fan, Q. and Tang, X. (2011) Study on Influencing Factors of Regional Innovation Capability Based on Endogenous Growth Mode. 32, 28-34.
- 15. Wang, L. (2010) Research on the Evolution of Regional Innovation System Based on Self-Organization Theory. Science of Science and Technology Management, 31, 128-132.
- 16. Chen, K., Kou, M. and Guan, J. (2013) Functional State Examination of Regional Innovation System in China—Panel Data Based on Provincial 2007-2011. China Soft Science, No. 4, 79-98.
- 17. Yang, G. (2009) Urban Community Self-Organization Ability and Its Index System. Socialism Research, No. 1, 72-77.
- 18. Bian, X., Duan, X., Wang, J., et al. (2016) Cultural Poverty Alleviation and Rural Residents’ Culture “Self-Organization” Capacity Building. Library Forum, No. 2, 1-6.
- 19. Li, R. (2010) Enterprise Innovation System Self-Organization Evolution Mechanism and Environment. Harbin Institute of Technology, Harbin.
- 20. Jiang, T. and Liu, S. (2011) Study on the Evolution of Regional Innovation Networks Based on Self-Organization Theory. Science and Technology Management Research, 31, 23-26.