Journal of Environmental Protection
Vol.4 No.12(2013), Article ID:40687,14 pages DOI:10.4236/jep.2013.412161
Hydrological Modeling Using GIS for Mapping Flood Zones and Degree Flood Risk in Zeuss-Koutine Basin (South of Tunisia)
![]()
1Department of Geology, University of Sciences of Tunis, Manar, Tunisia,; 2Water Research and Technology Center, Solimane, Tunisia.
Email: khemirisami_geo@yahoo.fr, benalaya.mohsen@gmail.com, fouadzargouni@yahoo.fr, afefkhnissi@gmail.com
Copyright © 2013 Khemiri Sami et al. This is an open access article distributed under the Creative Commons Attribution License, which permits unrestricted use, distribution, and reproduction in any medium, provided the original work is properly cited. In accordance of the Creative Commons Attribution License all Copyrights © 2013 are reserved for SCIRP and the owner of the intellectual property Khemiri Sami et al. All Copyright © 2013 are guarded by law and by SCIRP as a guardian.
Received May 16th, 2013; revised June 18th, 2013; accepted July 14th, 2013
Keywords: Degree Flood Risk; GIS; Geodatabase; Flood Zones; Hydrological Modeling
ABSTRACT
This study lies within the scope of a strategy of prevention from inundations by the contribution of new technology in stage of the hydrological and geomorphological modeling for protection against the floods in a medium of weak at the average risk in South-eastern Tunisia, starting from the catchment area of Zeuss-Koutine. Considering the lack of studies we were brought to extract the area catchment in question, and to deduce its geomorphological and hydrometric characteristics, starting from the digital terrain model. We could obtain, by overlaying maps of slopes, indices and flows, the hydrological zonation of the catchment area of Zeuss-Koutine. The hydrological study of the basin’s slopes of Zeuss-Koutine is not lying out that very little physical information rests primarily on cartographic processes. The use of the latter can be regarded as an allowing indicator, by the crossing of the explanatory factors of the surface flow (slopes and direction of flow), to define a set of homogeneous hydrological zones in the level of the hydrological characteristics (average slopes, altitudes, roughness, etc). It is mainly a question of better taking account of the physical properties of the basins slopes.
1. Introduction
Prevention from natural risks represents a big challenge for humanity. Especially during last decade, there are brutal climatic changes around the world and any place could, at any moment, be flooded or stormed. In Tunisia, the climate is generally characterized by a high meteorological variability from north to south. It is qualified as an arid to semi-arid under Mediterranean influences toward the north and Saharan influences southward. This difference is due to the existence of a climatic barrier separating these two zones and known as Tunisian Ridge [1]. Such climate type with low rain laid, predominately, Tunisia at the exhibition of floods. The average annual rainfall, in southern Tunisia, doesn’t exceed 80 mm however the evapotranspiration is about 2500 mm. The negative hydrologic balance of these two parameters and the rarity of runoff contribute very little to the deep groundwater recharge. Despite the previously mentioned characteristics and the position of Tunisia in global climatic zones, floods have affected and might affect the south of our country in the area of Gabes-Medenine and specifically Zeuss-Koutine basin purpose of this study [1].
The detailed preliminary study and the choice of the solution proposed and the technique employed for the fight and protection against these floods are extremely important. The prevention is a paramount phase in protection, and it requires several studies; geomorphologic, hydrological, topographic, hydrogeomorphologic, hydrogeological and modeling histories of the floods.
2. Methods and Workflow
The hydrological study of the Zeuss-Koutine basin was conducted on the basis of the modeling, by the use of Geographical Information System (GIS) and, more precisely, the contribution of Digital Elevation Model of Ground (DEM) and its derivative. The DEM is used to define the slopes, the hydrographic network, the delimitation of the basin’s slopes and the extraction of the physical characteristics and water streaming related to this basin.
The whole digital results got in the form of layers of numerical information (GRID) on the areas catchment of Zeuss-Koutine and the water ways of surface constitute basic and useful information for hydrological modeling.
The conjugation of the various classes of parameters obtained starting from these cards streaming of surface, of the slopes (relief), of the hydrographic network, the physical characteristics of the basin and the flow directions and accumulations [2], allowed us to establish maps which will be stacked to other layers such as those of pedology, geology, vegetation and infrastructures. All results and collected parameters will help constitute a data bank usable for a hydrological modeling with space discretization, to delimit homogeneous zones and to prepare a digital cartographic support of the flood plains and degree risks along the basin.
The flood mapping was developed as a result of the layering of several parameters covering geographical areas capable of being flooded according to three scenarios (flood low probability, flood medium probability and flood high probability). Through the application of the formula of Lee (2007), we were able to extract the degree of flood risk in the study area per pixel.
The choice of the technique employed and analyzes it physical and socio-economic operation area catchment to allow (Figure 1):
- To locate and to gradually choose the sectors on which it is desirable and possible to carry out preventive actions for protection against the floods.
- To quantify their effect on the risings and to appreciate their limits and costs.
The cartography of the flood plains and the realization of the maps of the degree risks require several types of studies.
These studies complementary and are connected.
The unit makes it possible to release an adapted and coherent vision of the operation of the catchment area and the problems of installation.
Principal the studies of preventions are the following
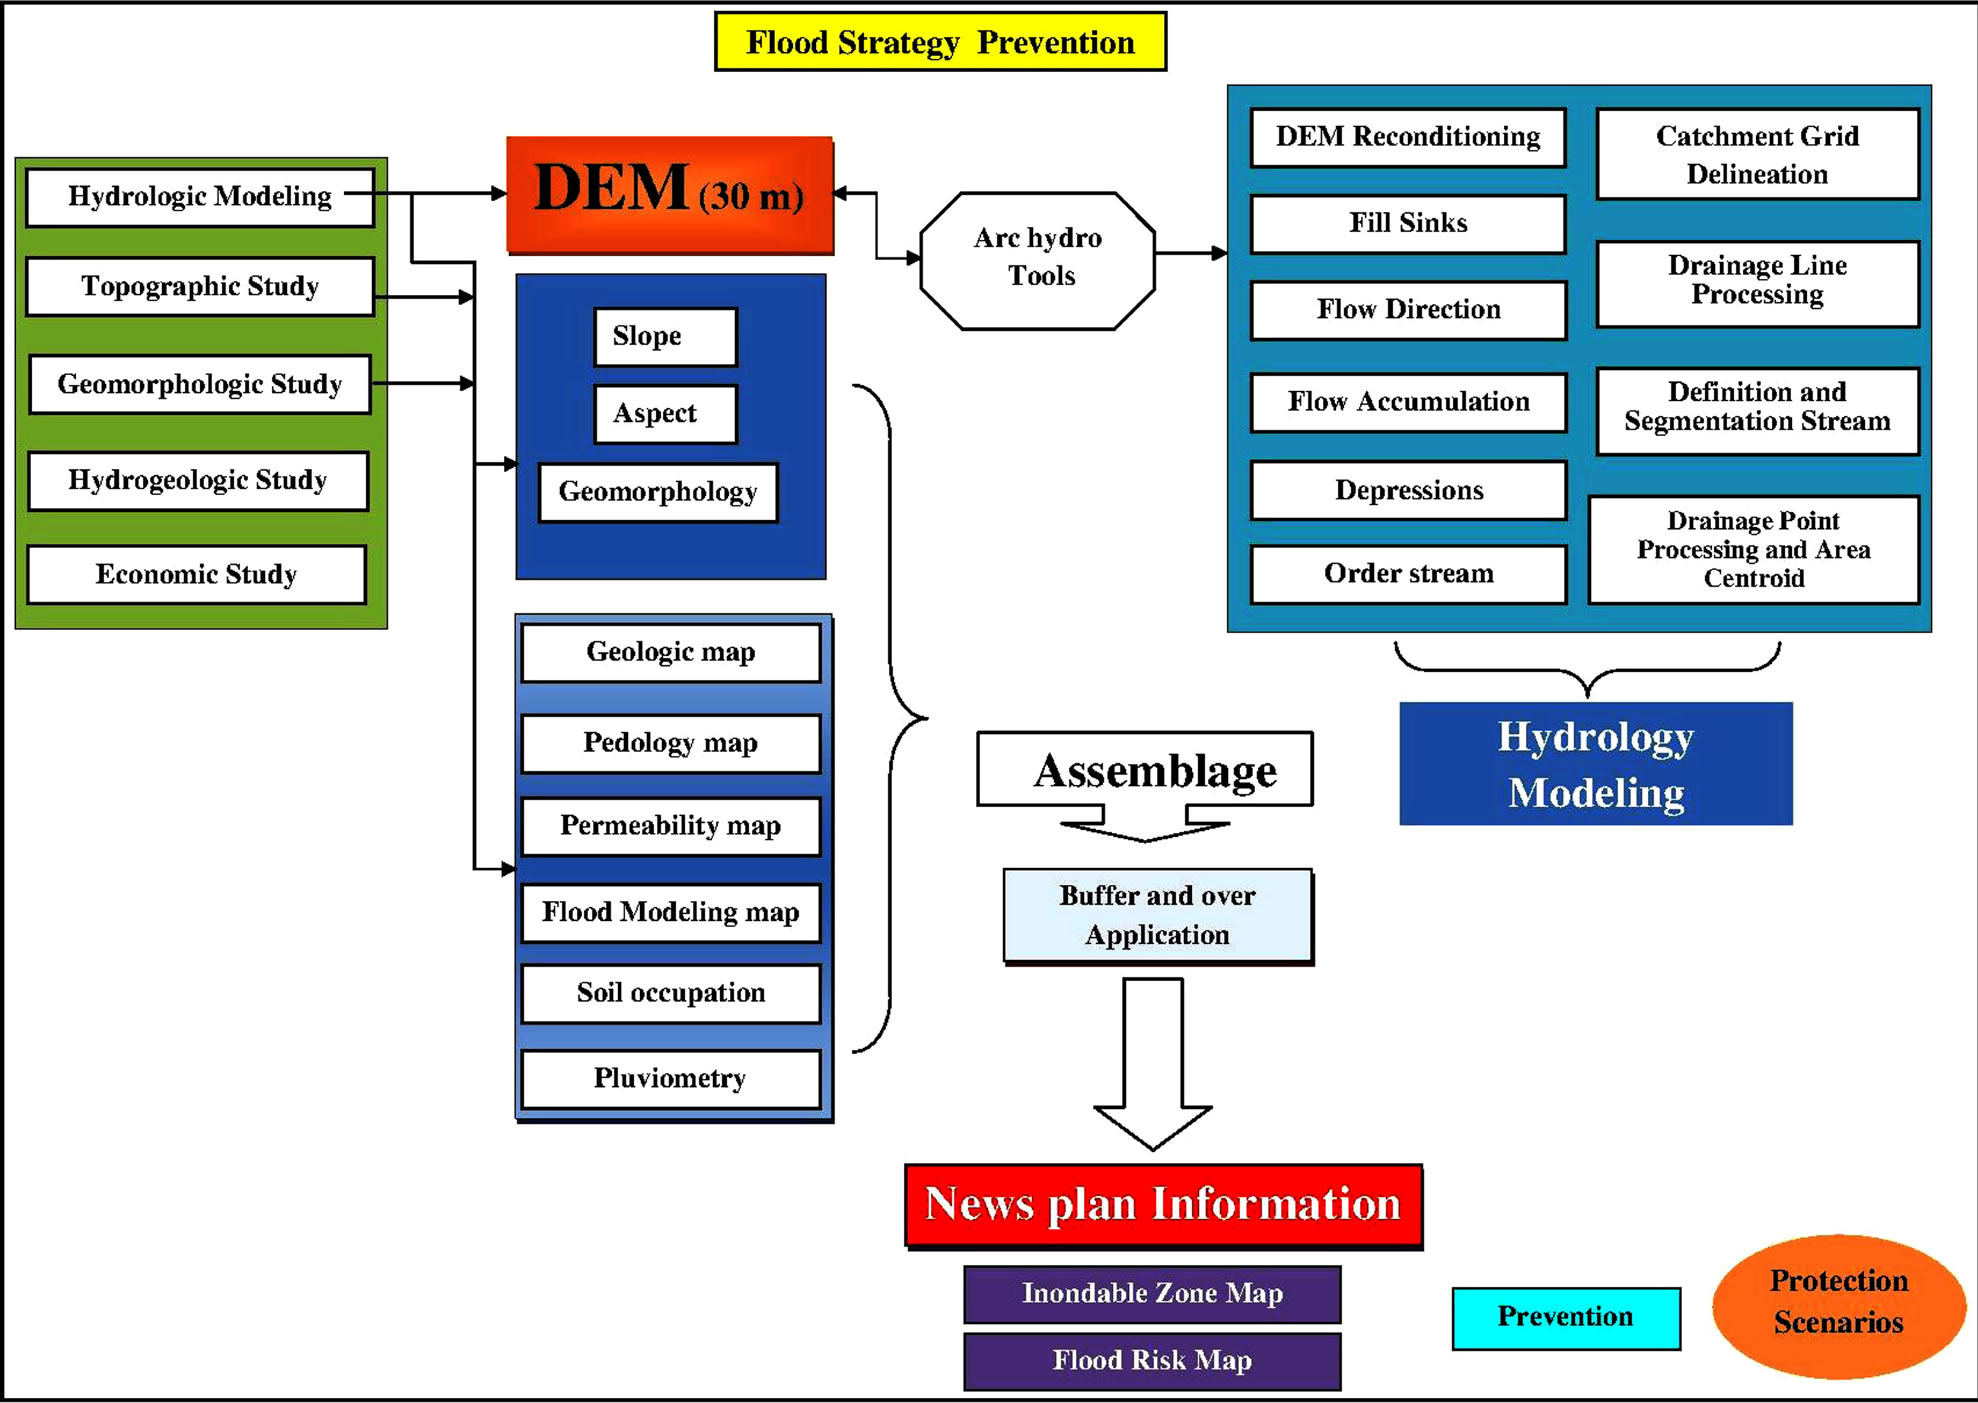
Figure 1. Chart showing the work flow of this study.
ones:
• The hydrological study
• The topographic study
• The geomorphologic and hydrogeologic study
• The hydraulic study
• The socio-economic study The aim of this work is the geometrical, geomorphological and hydrological modeling of the Zeuss-Koutine basin. We will proceed to the interpretation of existent data, the exploitation of the derivatives of the digital terrain and the creation of new layers and overlay plans GRID information in digital form created by interpolation [3].
The results obtained will be used to carry out basic information tools of prevention for fixing priorities for flood management in the basin of Zeuss-Koutine.
On the basis of the results obtained, means and solutions to fight against the floods will be proposed. Thus several types of development and dams will be defined at the end of this study to protect the Zeuss-Koutine basin in the case of probable serious flooding.
2.1. Study Area
2.1.1. Geographical and Administrative Settings
The Zeuss-Koutine basin is situated in South-Eastern Tunisia (Figure 2). It is a part of coastal plain of Jeffara in the southeastern Golf of Gabes. It is limited by the latitudes 37˚10' and 37˚50', and the longitudes 8˚50' and 9˚20' [4].
This sector covers an area of 920 km2. The Northern limit is formed by a line joining sebkhet Oum Ezassar to Henchir Fredj area. The North-Western, and SouthEastern limits are represented by reliefs of northern Dahar. The Southern limit is characterized by the reliefs of Tebaga of Medenine until Tadjeras and bordered by Mednine fault.
The double maritime and continental influence on our area generates a great variability of temperatures and precipitations space and time [5]. The annual average temperature in this area is of 20˚C whereas annual average pluviometry is below 200 mm/an.
The annual evapotranspiration in stations of Gabes and Medenine exceeds 1300 mm. [6].

Figure 2. Study area.
2.1.2. Climatic Evolution in Tunisia
Climate of Tunisia is of the semi-arid type with very great variations in temperature and pluviometry in time that in space. The pluviometric mode is very variable in term of duration and intensity of the rains [7]. Rains of very strong intensity which can generate devastating risings of the natural environment have been witnessed [8].
Tunisian climate is mainly Mediterranean. The pupils can distinguish 3 great climatic units:
• At North, a “wet” zone (400 to 600 mm/year) which feeds the vast hydrographic network of Medjerda.
• In the center, on both sides of the “dorsale”, precipitations spread out of 250 with 400 mm: it is the beginning of a semi-arid climate, with semi-steppe vegetation development.
• In the south, an arid region (less 250 mm/year) even less than 150 mm in southern of Douz) whose “chotts” and the dunes represent the landscape dominating.
With this distribution, it is necessary to add the strong irregularity inter and intra-annual (less than 30 days of rain/year in the south) and the risks posed by the risings (spring and autumn, and not only at north).
The country has approximately 4.6 billion m3 water resources: 60% run on the surface, 40% are underground but 80% of these resources are located in the north while 70% of ground waters are in the south.
The country is also equipped with water tables in north and an enormous potential consisted the fossil sheets of water (aquifers) in the south such as in the case of our sector of study (Zeuss-Koutine). One will point out that salinity is higher (salt 1.5 g/liter) in north.
2.1.3. History of the Risings in Tunisia
The risings are temporal natural changes water’s level caused by abundant precipitations causing the floods [9]; they can occur under various weather conditions and are integral part of the river mode.
The consequences of the floods vary from a medium with another and are primarily related to the distance which separates the urban areas, the agricultural lands and the installations of the floodplains [10], it is thus the preliminary study for the prevention against these risks of floods proves to be paramount for the protection or the reduction of the possible damage.
In Tunisia, the most important risings recorded during the last fifty years are those of 1962, 1969, 1973, 1986, 2003, 2004, 2006, 2007 and 2012.
The risings observed during the last two years caused phenomena ever known with very high damage [11].
The efforts made by the persons in charge (will control) make it possible to equip the country with a broad hydraulic infrastructure: 27 stopping’s, 200 stopping’s hill, 766 lakes hill and more than 3000 drillings and 151,000 wells of surface mobilizing 83% of the unit of the exploitable water resources. These efforts remain always insufficient in front of floods [12] which can affect South-east Tunisia and precisely the area of Djeffara. This later is marked by elevated chains of Tebbaga, Matmata, Mareth and relayed directly at the east and north east to the Zeuss-Koutine basin objective of this study [13]. The rain waters and streaming are at the origin of the floods.
The area of Zeuss-Koutine as all Tunisian South-east presents climatic conditions and geomorphologic which prevent the formation of the risings naturally. These conditions are supposed as follows [14]:
- Irregular annual pluviometry and weak 100 < P< 200 mm, rains are generally stormy and torrential [15];
- High Evapotranspiration EVT and important hydric deficit;
- Winds of various directions, often dessicants and with considerable dynamics [16];
- Specific vegetation with halophyte species;
- Almost complete absence of the high layers (forests) [17].
2.2. Bases Studies for the Definition of a Strategy of Protection (Prevention)
The prevention against the floods Zeuss-Koutine basin requires several studies; principal studies for the choice of a strategy of protection are as follow [18].
2.2.1. Hydrological Study at the Level of Catchment Area
Within the framework of the clarification of scenarios of protection of the basin Zeuss-Koutine, hydrological modeling aims at the definition of events of reference. This definition must be based on three types of information and simultaneous analyses:
• A first analysis consists in defining homogeneous hydrological zones, according to the climatologic (rain…) and morphometric characteristics of the catchment area (relief, slopes, aspect, form) and of its aptitude for the streaming (geology, pedology, occupation of the ground) according to the hydrometric data available [19];
• The second analysis relates to the detailed treatment of chronicles of measurement of flow;
• The last stage consists in describing the intensity of the risings in an unspecified point of the catchment area which will be by mesh in our study constituting the target site on which one seeks to determine the degree risk of rising.
2.2.2. Topographic Study
The technical studies, particularly the hydraulic study, require the knowledge of specific topographic data in an adapted way, the geometry of the ground and that of the works and installations present and projected.
2.2.3. Geomorphologic and Hydrogeological Studies
1) The hydro geomorphologic study
The hydrogeomorphologic method is a first phase of analysis [20] of the natural environments and valleys.
It is interested to describe and high light the whole of the bed of water way and boxing sound (terraces and slopes), as well as the various establishments likely to disturb the flows [21], by accelerating or by slowing down them [22].
It makes it possible to deduce the flood plains by the rare risings with exceptional as well as the values approximate from the physical parameters of the floods.
The DEM in 3D of the basin proposes a visualization of the space provision of the various beds of a waterway and their context. In this case, the modern alluvial plain is framed, on a side by a slope with steep slope, and other by a terrace [23].
Minor bed
Including the bed at low water, it is the bed of the frequent risings. It corresponds to the principal channel of the waterway. It is generally borrowed by the annual rising, known as believed of full-edge, flooding only the low sectors and closest to the bed. This bed is easily locatable since it is delimited by more or less continuous abrupt banks.
Average bed
It is the bed of the average risings. It ensures the transition between the major bed and the minor bed limited by slopes. It corresponds to the bed occupied by the frequent risings with averages (periods of return ranging between 2 and 10 years) which can have an important speed and a solid load.
Major bed
It is the broadest bed, which corresponds to the alluvial plain and which is function of rare and exceptional risings. It recovers old average and minor beds and offers morphological characteristics much simpler. It presents one modeled flatter, and is located below boxing it.
This shutter attempts to study the fine evolution of the bed of the waterway (Figure 3), as well in plan as in profile. This shutter is particularly useful for the establishment and the design of brought closer protections (dams, protections of banks) and of works to be built in the bed (work of derivation, stopping).
2) The hydrogeologic study
It is interested under investigation of the relations between the aquifers and the river. This shutter is justified if the aquifers are likely to influence the mode of the risings or to produce floods by increase of aquifers in the
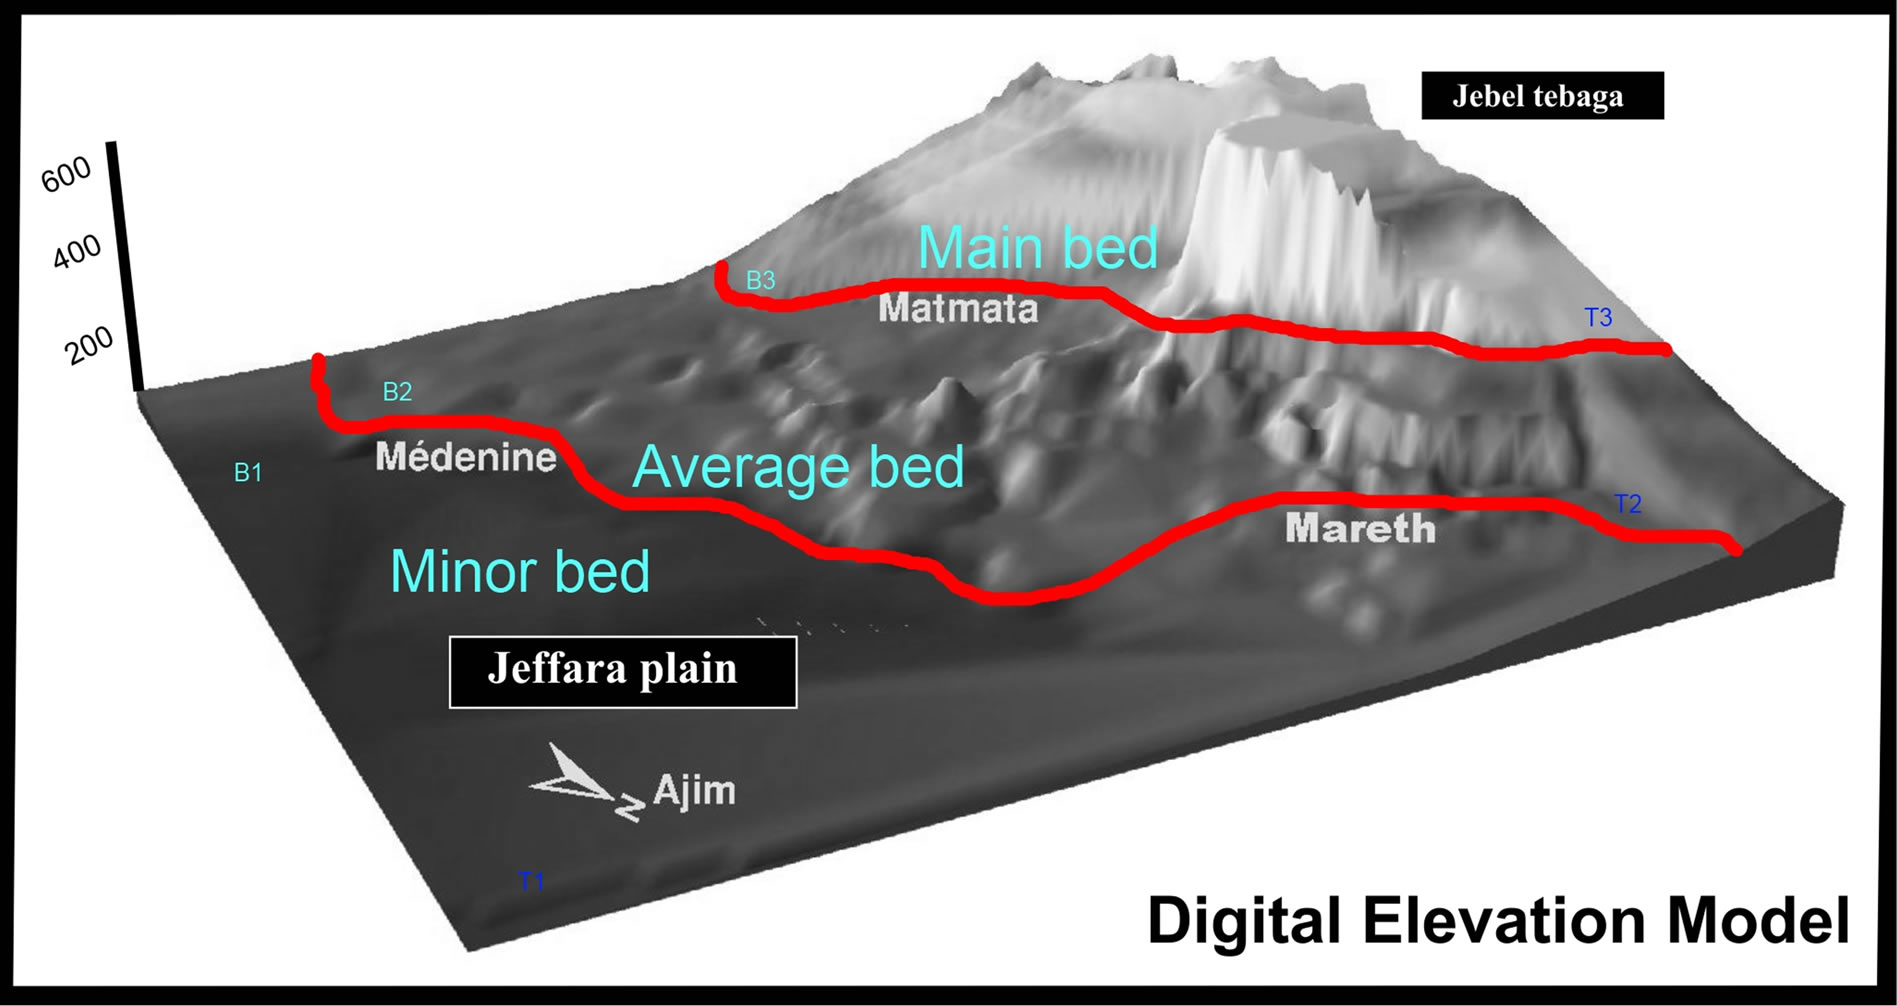
Figure 3. Hydrogeomorphologic classification.
protected sectors. This isn’t applicable in the sector of Zeuss-Koutine. Deep aquifers are always over exploited and will not reach surface even in the years with a high pluviometry [24].
2.3. Choice of a Strategy of Prevention
After having determined the relative importance of the challenges and the economic appreciation of the damage which is associated for them, passage with a true analysis cost benefits, when it was tried, was done on the basis of assumption, whose principal one is that the damage which could be monetized reflect the whole of the impacts of the floods.
Among the costs, must appear the investment costs which reflects the cost of the techniques of preventions but as well they brought up to date costs of maintenance.
3. Results and Interpretation
3.1. DEM-Arc Hydro Tools
The terrestrial reproduction of the forms constitutes to translate, in a plan in 2D topographic surface 3D. The forms of representations of the relief are multiple: dimensioned points, contours, sights in prospect.
The development of the digital cartography and Geographical Information Systems SIG, allowed the creation of a new form of representation of altimetry information under digital format still called Digital Elevation Model of the ground DEM which is characterized by a considerable extensibility and flexibility on the level of its exploitation from which we can derive a multiplicity of products: contours, cards of slopes, exposure or of inter visibility, volumes, sights in prospect…
For hydrological studies of the areas catchment the DEM provides important information at the level of hydrological modeling by the extraction of the new plans of information allowing us having a detailed idea about the hydrographic networks, flows of water and physical characteristics of the basin. Several software SIG was interested in creation of the DEM; in our case we chose ArcGis and its extension Arc Hydro Tools for the development of hydrological model.
Arc Hydro is a data model and toolset for integrating geospatial and temporal water resource information run within ArcGIS geographic information system. Although implemented in a commercial GIS environments.
All the calculations, carried out by the extension Hydro Arc, have as a base a digital elevation model (DEM).
The DEM chosen in this study is that elaborate following the interpolation by triangulation TIN of the vectorized level lines on scale 1/50,000 of the topographic maps of Matmata, Mareth, Ajim and Medenine; on the other hand, its precision doesn’t make it possible to use it in a reliable way, it is for that one selected ace to use in more the DEM of the SRTM with resolution of 30.
This DEM is appeared as a grid whose elements are squares of 30 meters side thus an altitude is defined every 30 meters.
3.2. Hydrologic Modeling: DEM Derivatives
From the altimetry information of the DEM, derivatives maps and information’s will be calculated, to realize a morphological analysis of the study area, by the construction of slope map, charts of orientations and sunning charts of intervisibility, profiles, geological cuts-off and charts of hydraulic installations. Other maps and information have a hydrological interest such as the delimitation of the basins slopes [25], the extraction of subbasin, the automatic generation of the hydrographic network like and we developed other charts of modeling like the direction and accumulation flow.
3.2.1. Slope Map
Measurements of dips are essential data for the geologist and in particular for the structural analyst and for the hydrogeologist. They allow quantifying the geological objects observed on the surface and modeling them.
As a result, the slope map confirms the predominance of platform structure which corresponds to the Djeffra plain, represented by yellow and green color on the map.
3.2.2. Aspect Map
This map shows slope aspect in Zeuss-Koutine basin. It uses different colors to indicate the direction of the steepest slope (Figure 4).
We notice the abundance of the blue sky color, blue dark, orange and red which indicates a NS (North-South) dip direction of the cells of the basin of Zeuss-Koutine. This information is very useful for the determination of the direction of major flow and after the direction of the installations of protection against the rising will be perpendicular to this Major flow direction.
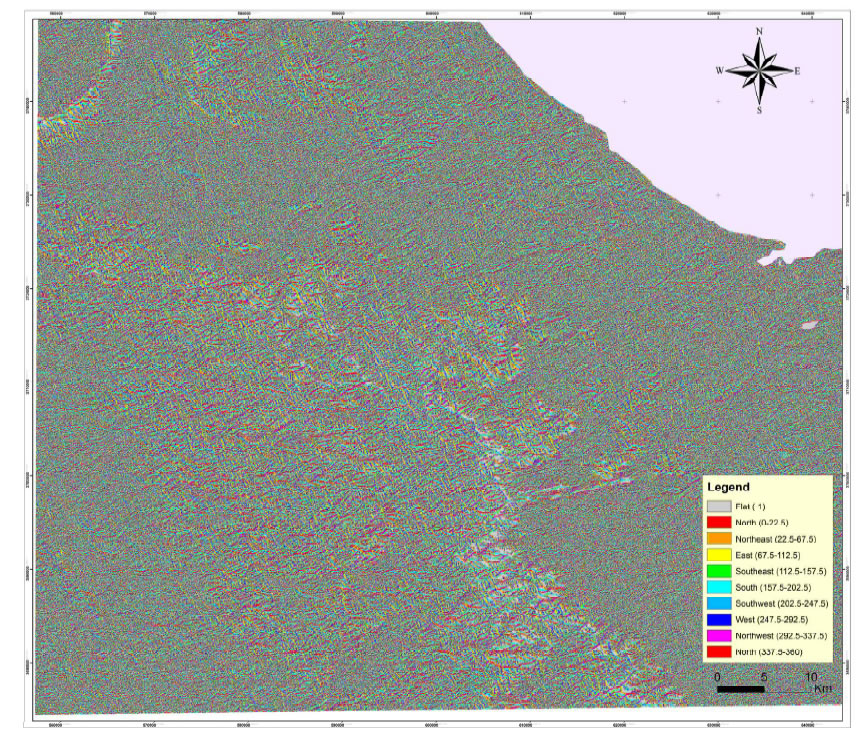
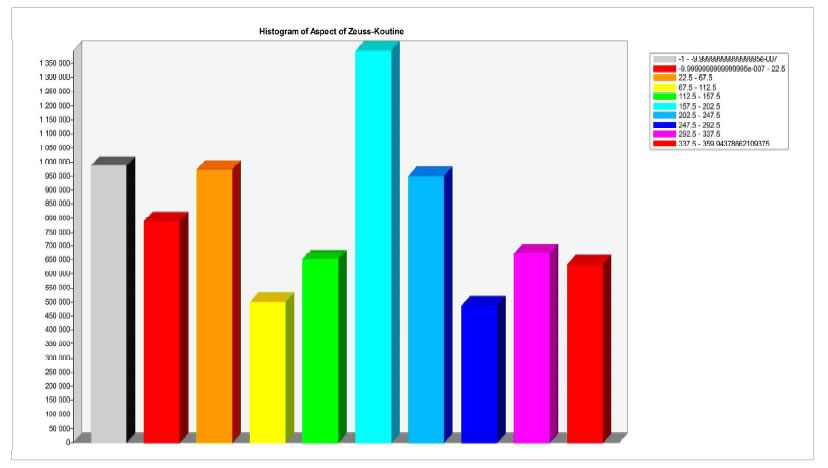
Figure 4. Aspect slope.
3.2.3. Flow Characteristics
The tools of hydrological modeling proposed by spatial analysis make available methods to describe the physical components of a surface or basin.
Adaptation of DEM is a necessary step before hydrologic modeling, the main possibilities are:
- Adaptation of DEM to the actual position of the stream;
- Fill the “holes”.
In this study (Figure 5), we will perform drainage analysis on a Digital Elevation Model DEM (30 m) of Zeuss-Koutine basin and provide a digital representation of watershed characteristics used in hydrologic modeling. The DEM are used to derive several data sets that collectively explain the drainage of a catchment. Raster analysis is performed to create data on DEM Reconditioning, flow direction, flow accumulation, stream definition, stream segmentation, and watershed delineation.
DEM Reconditioning
This function modifies a DEM by imposing linear features onto it (burning/fencing), we have chosen the hydrographic network of Zeuss-Koutine basin like a linear file for this application [26].
Fill Sinks
Among the problems we met for the reproduction runoff Zeuss-Koutine maps, it’s when the cell is surrounded by higher elevation cells, and the water is trapped in that cell and cannot flow. The Fill Sinks function modifies the elevation value to eliminate these problems filling these grids.
Flow Direction
One of the principal parameters which can be extracted is the flow direction whose objective is the creation of a raster of integers to the direction of flow starting from each cell towards its neighbor with the steepest descent which values vary from 1 to 255 [27]. As a result, this chart is explained by the fact that each cell contains the direction (coding of Freeman) of water flow (Chiles J-p.2004).
Using the “Arc hydro” tool, we made the flow map of the study area. The cells flow to their nearest neighbor along 1 of 8 compass directions labeled as East = 1, SE = 2, S = 4, SW = 8, W = 16, NW = 32, N= 64, NE=128. Results were mostly more than 16, which mean a direction North West or North to South or South East... that is to say Jebel Tebbaga and anticlines around to the platform of Jeffara [28].
Flow Accumulation
This function computes the flow accumulation grid that contains the accumulated number of cells upstream of a cell, for each cell in the input grid.
Stream Definition and Stream Segmentation
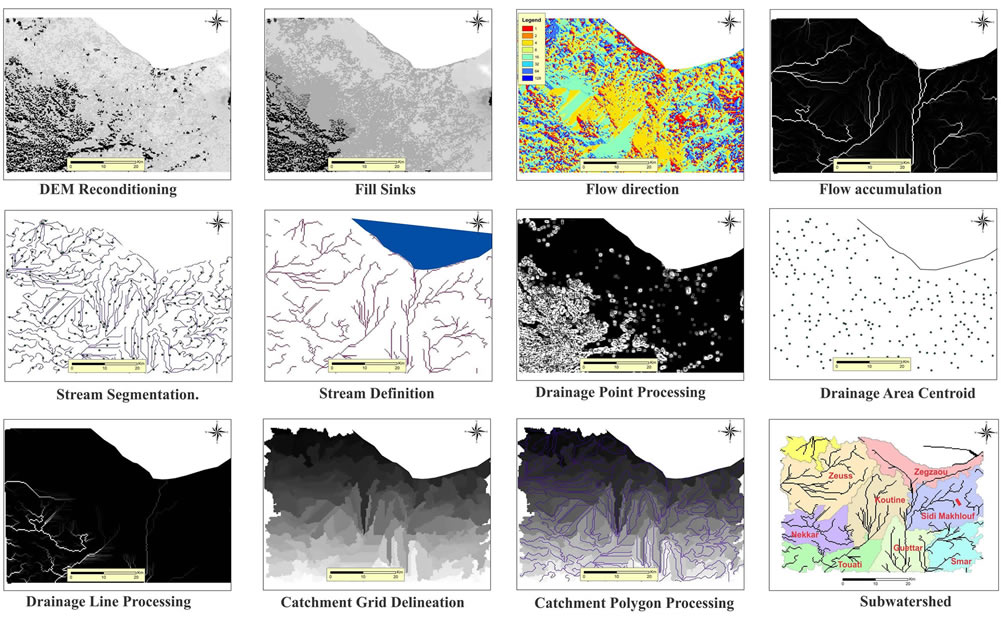
Figure 5. Different maps of flows extracted by Arc Hydro-tools.
With this function we creates a grid of stream segments that have a unique identification.
Drainage Point Processing and Area Centroid
This function allows generating the drainage points associated to the catchments.
This function generates the Centroid of drainage areas as centers of gravity. It operates on a selected set of drainage areas in the input Drainage Area feature class. If no drainage area has been selected, the function operates on all the drainage areas.
Drainage Line Processing
This function converts the input Stream Link grid into a Drainage Line feature class. Each line in the feature class carries the identifier of the catchment in which it resides.
Catchment Grid Delineation
This function creates a grid in which each cell carries a value (grid code) indicating to which catchment the cell belongs. The value corresponds to the value carried by the stream segment that drains that area defined in the stream segment link grid.
Catchment Polygon Processing
This function converts a catchment grid it into a catchment polygon feature.
Subwatershed Delineation
This function allows delineating subwatersheds for all the points in a selected Point Feature Class. Input to the batch subwatershed delineation function is a point feature class with point locations of interest [29]. The Batch Point Generation function can be used to interactively create such a file.
Evacuation Point
The cartography of the points of evacuation helps with determination of the troughs of low pressure constituting of the easily flooded zones (Figure 6).
Stream order (Strashler)

Figure 6. Evacuation point.
The classification of the affluent helps with the determination of the degrees of influence and the contribution of each wadi (ramification) in the formation of the risings (Figure 7).
Generally the branches of greater order such as the wadi of order 4 are the main sources of the risings (Wadi Zeus, Om Zessar, Koutine…) this does not neglect the influence of the other derived wadis [30].
4. Discussion
4.1. Map of Flood Zones and Degree Flood Risk
The use of the SIG for the determination of the geomophometric and physical characteristics of the catchment area of Zeuss-Koutine, starting from the digital elevation model obtained following the digitalization of altitudes, allowed us the mapping of flood zone and degree flood risk. quantify certain physical and hydrological parameters sector of study, per units Nets or GRID or PIXEL, to have an explanation of the phenomenon of flood and its effects and to give scenarios of prevention for the fight against these catastrophes to short and long-term.
The hydrologic modeling within Arc Hydro tools is to represent the physical processes within each catchment of interest so that, when driven by atmospheric forcing (precipitation, temperature) and for known catchment physical characteristics (topography, land cover), the models generate stream flow hydrographs at the catchment outlet that reproduce the corresponding observed hydrographs.
Terrain Preprocessing uses DEM to identify the surface drainage pattern. Once preprocessed, the DEM and its derivatives can be used for efficient watershed delineation and stream network generation.
At the end of this part, the use of tools buffers with a distance of 1000 m and 1500 m and 2000 have allowed
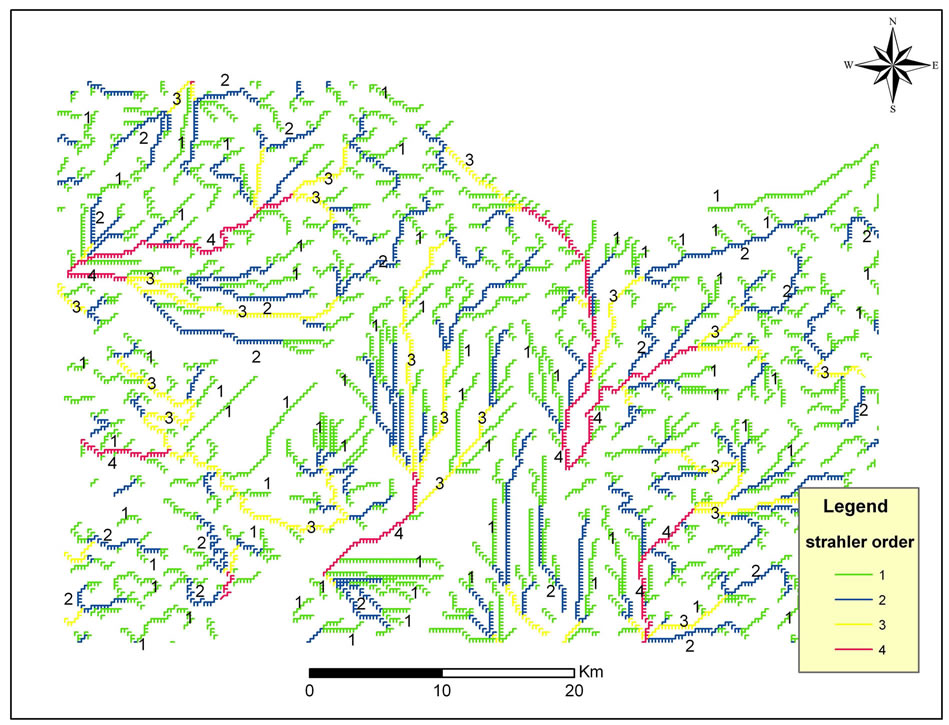
Figure 7. Strashler stream order.
us to classify the degree of intensity of each parameter (Figure 8).
The hydrological modeling of Zeuss-Koutine basin have provided a geomorphological idea of the basin by its subdivision into three bed the minor bed is the most flood zones and the more risky for the flood, then the main sources of flooding are the wadis of Zeuss, and Koutine Om Zessar and the waters become from the Jbel Tebaga in South West.
From the flow direction and accumulation map, we extract information about the mobility of surface water in Zeuss-Koutine.
This mobility is important due to the predominance of the sectors of low altitude (<250 m). All data are then used to build up a vector and GRID news plans of catchments, watershed and drainage lines. With this information, a geometric network is extracted and 9 Subwatershed was generated in the end: Zeuss basin, Koutine basin, Zigzaou basin, Sidi makhlouf basin, Guettar basin, Touati basin, Smar basin and Nekkar basin.
The cartography of the flood zone (Figure 9) with plans of the degree risks of floods translating the intensity of the flood in each sector on the level of ZeussKoutine was deduced following the superposition from all extracted information.
The technique Buffer to different distance (500 m 1000 m - 1500 m - 2000 m - 3000 m); under ArcGIS on the various layers create to us aces allowed after space superposition and intercrossing of:
- To delimit the floodplains
- To chart a plan of degree risk of flood of ZeussKoutine This work enabled us to produce tools of information of basic prevention to fix priorities as regards management of the floods: a chart of the floodplains and prevention plans of the risks.
The cards of the floodplains cover the geographical zones likely to be flooded according to 3 scenarios:
* Flood of weak probability or extreme scenarios of
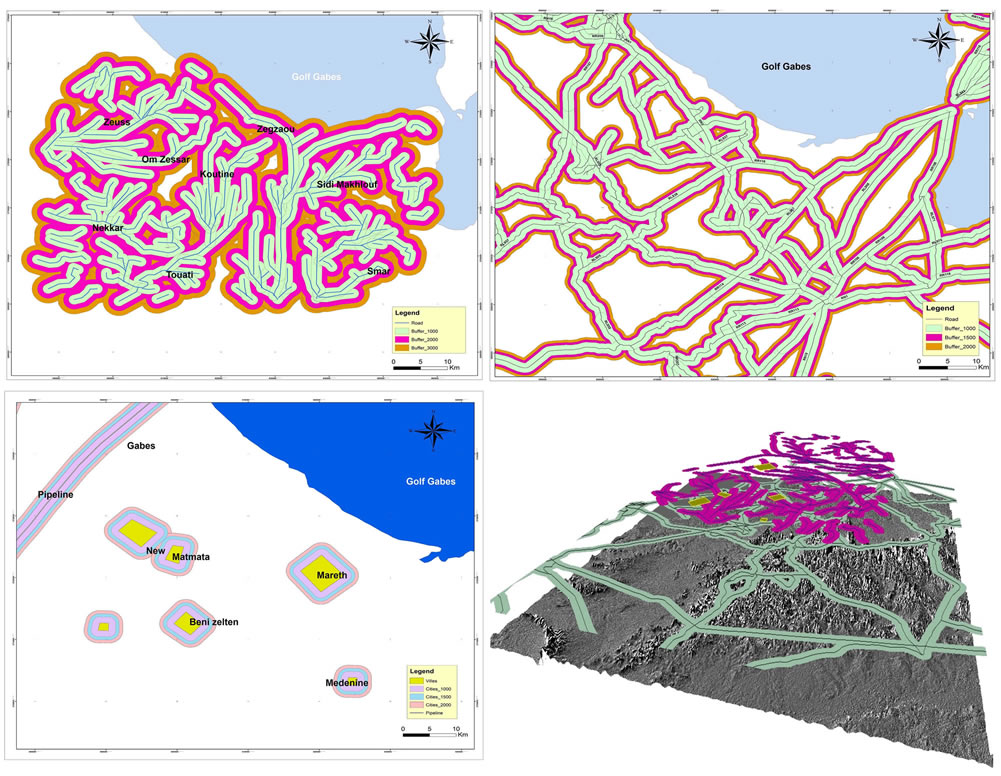
Figure 8. Buffer zone and overlays.
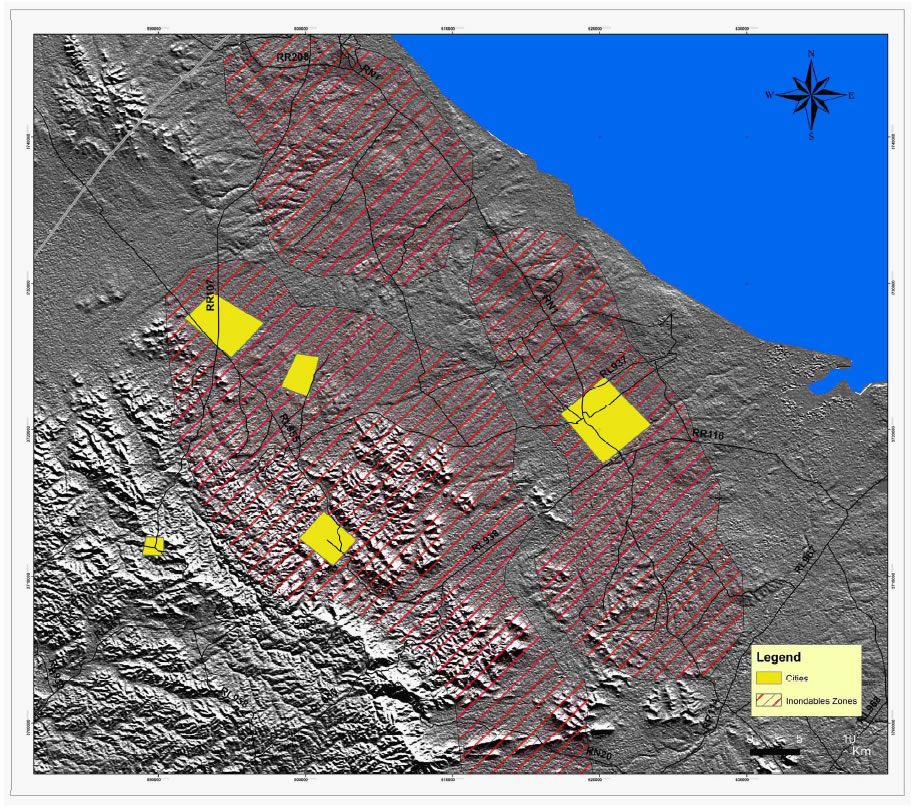
Figure 9. Flood zones.
events* Flood of average probability (correspondent at one period of higher or equal to return hundred years) and* If necessary, high flood probability.
For each scenario, the extent of the flood, the sectors easily flooded, the heights of water (or according to the case the water level) and possibly the current velocity or the flow of the rising, must be represented in carto-graphic form.
The maps of the degree floods risks show the intensity by sector of the potential negative consequences associated with the floods, i.e. saying the number of people and the extent of the goods likely to be affected by the risings, such as for example: agricultural economic activities, surfaces, transport networks. In this study, the calculation is based on the formula lee (2007).
RI = 2RH + SLOPE + RELIEF + 1/2 P 1/2 OS RI = Risk of flooding RH: Drainage P: Permeability OS: Land Use All parameters in the formula must be in RASTER mode to obtain the map of Degree flood risk (Figure 10).
The results obtained show that the small bed or plain of Djeffara is the most easily flooded zone, and the sectors of Mareth and beni zeltene are exposed to the risks of floods. The upstream part of TouatiWadi presents executor probable flood which can be most catastrophic on the area of blessed Zeltene.
In the same way for Wadi Sidi Makhlouf and Oued Nekkar which present a danger to the areas successive of Mareth and Matmata.

Figure 10. Degree flood risk.
4.2. Scenarios and Suggested Solution of Protection
Protection against the floods articulates about three shutters [31]: 1) the distant protection which consist in carrying out dam and lakes; 2) brought closer protection against the flood which includes work of deviation of the wadi and waterways apart from the cities and the urban areas; 3) The cleansing of rain waters inside the urban areas and which consists in carrying out networks of cleansing.
The scenarios of continuation prevention have this job is multiple and alternatives but it is necessary to choose the scenario which is appropriate and which allows:
• To analyze the operation of installations as a preliminary, to guarantee that their operation especially on the geotechnical level [32], will not generate an onaccident.
• The works can modify the perception of the risk on behalf of the residents. On the technical plan, the combination of many installations spatially distributed, and having a whole a local effect of rolling of the flows, must be analyzed on the whole of the catchment area. It is indeed advisable to make sure that the beneficial reduction in the risings obtained in a place will not involve a harmful synchronization elsewhere.
For the case of the basin of Zeuss-Koutine we see that best the solution of prevention against the flood and who aim at reducing the losses, in particular human and to protect the most exposed districts and the agricultural lands from the plain of Djeffara; is the installation of the dams of protection.
The dam of protection against the floods and channeled rivers is defined as a longitudinal work which does not have function to retain water but to prevent its flow. It creates a difference in water level between two parts of the same floodplain and that this difference creates “hydraulic head” which imposes the work on forces against which it must be correctly dimensioned to resist.
The dams are various types:
• Dams of protection against the river, longitudinal floods during water flow;
• Dams of belt in the inhabited places;
• Dams of estuaries and protection against the marine immersions;
• Channeled river shore embankments;
• Linear fill.
The ranking of the works is done according to the dangerousness with gradual obligations (H = plus great height between the top of the work and the original ground on the side of the protected area, P = population maximum residing in protected area plumb with the top):
• Classify A: H >= 1 m and P >= 50,000 inhabitants;
• Classify B: not classified of A and H >= 1 m and 1.000 <= P <= 50,000 inhabitants;
• Classify C: not classified of A and B and H >= 1m and 10 <= P <= 1.000 inhabitants;
• Classify D: either H < 1 m or P < 10 inhabitants.
The dams proposed for the basin of Zeuss-Koutine of study will be second class i.e. The Class B.
4.3. Various Types of Installations (Dams)
The installation of the dams for the prevention against the flood in the basin of Zeuss-Koutine or the Tunisian South generally; suitable technical solutions relating to the clean conditions of the site constitute on which will be realized: nature of the ground, slope of the original ground, surface quality of the ground and impluvium. In other words one can say that from a purely technical point of view the properties and the conditions of the site dictate the nature of the intervention.
The techniques of installation of the dams proposed on the level as of waterway can summarize as follows.
4.3.1. Dry Stone Cords
The dry stone cords consist into cubes of dry stone walls, two or three arranged, built in contours all the way along slope. They are carried out on the slopes upstream of the basins slopes, where the slope is very strong, vegetable cover is generally weak or absent, the streaming and the concentration of water are fast. Their crucial role is to break the speed of streaming of water and to limit its erosive capacity.
4.3.2. Dry Stone Thresholds
They are works carried out in masonries made in dry stone staircase or sometimes using binder’s vegetable in the thalwegs and Chaâbs. They make it possible to reduce the speed of streaming and the retention partial of water and certain sediments.
Manual tabias
They are ground pads made manually by shovel and pick axe. The main aim of the realization of these works is to retain part of surface waters; the rest is evacuated by its outfalls towards the downstream.
Technical tabias
They are bulkier works made downstream from the slopes and transversely gullies. The role is to partially retain runoff and fighting against erosion.
Jessours
They are works made up of a ground pad compacted located in its upstream, it is equipped with pill way of surplus waters in the event of strong risings, this work can be side or central. Other techniques of installation of protection primarily applied to the system aquifers of Zeuss-Koutine can intervene at the time of the prevention such as; works of refills of the aquifers, works of spreading’s of water of raw and wells filtering.
5. Conclusions
At the end of this work and following hydrological modeling carried out on the basin of Zeuss-Koutine, the got results enable us 1) to chart, in a homogeneous way on a whole catchment area, the easily flooded limits like all the natural or artificial elements, which can play a part on flow of the risings. It also appears the limits reached by the large known historical floods. 2) To determine the needs and the actions aiming at minimizing the possible risings and the most effective solution to reduce the damage due to the floods as well as the specific and dimensioned works protection to resist a probable rising. The prevention of the floods thus remains a pressing priority, for that the principles of the dynamic deceleration can be limited as follows:
• To moderate water running out on the slopes, which will delay of as much their arrival with the waterways; this to decrease the peak output and to delay the flows by it on a waterway, by slowing down water before its arrival in the bed, by mobilizing the natural capacities of damping in average bed and major bed, and by temporarily storing part of the volume of the rising in works;
• To reduce their acceleration in the beds of the waterways;
• To support, even restore, connection with the Appendices River and major bed in general; this allows the derivation of part of the flows in believed and the increase in the infiltrations towards the aquifers. This work is addressed particularly to these projects, for which we can still simplify the concept and restrict it with the following technical objectives;
• To make sure that at the level of the area catchment, the implementation of the dynamic deceleration on a set of water ways does not generate one locally unexpected increase in the risks of flood, in particular by recombining of risings out of phase by the works.
As to the maintenance and monitoring of installations and done works, this methodology makes it possible to be freed from knowledge, never exhaustive, of the former risings, by drawing up all the zones likely to be flooded by over flow of waterway.
Thus, the floodplains of the area studied are defined in a homogeneous and perennial way. The corresponding cards make it possible for example to locate the zones of the territory which will be never flooded, therefore on which a sustainable development without risk of flood is possible. These various cards set of themes with alternatives of scales and formats digital GRID present a useful support for the cartography of the zones likely to be flooded and to thereafter meet the various needs for the managers of the territory, and it can be used like a prototype for other sectors of studies. The knowledge of these floodplains is not exhaustive; those which are charted it are as an indication and their limits remain approximate and variable with time.
REFERENCES
- B. Kartic, P. Moumita and B. Dr. Jatisankar, “Application of RS & GIS in Flood Management a Case Study of Mongalkote Blocks, Burdwan, West Bengal,” International Journal of Scientific and Research Publications, Vol. 2, No. 11, 2012, pp. 1-9.
- B. Ben Baccar, “Contribution to the Hydrogeologic Study of the Multi-Layer Aquifer of Southern Gabes Thesis of Third Cycle Doctorate,” University of Southern Paris, 1982, pp. 132-154.
- B. Ayo and B. Ibrahim, “Selection of Landfill Sites for Solid Waste Treatment in Damaturu Town-Using GIS Techniques,” Journal of Environmental Protection, Vol. 2, No. 1, 2011, pp. 1-10. http://dx.doi.org/10.4236/jep.2011.21001
- M. Ben Youssef and B. Peybernes, “New Biostratigraphy of the Lower Cretaceous of Southern Tunisia,” Newspaper of African Earth Sciences, Vol. 5, No. 3, 1986, pp. 217-231. http://dx.doi.org/10.1016/0899-5362(86)90013-8
- C. Bill and R. Simon, “Automated Rig Removal with Bayesian Motion Interpolation,” The Foundry, London, 1998.
- S. Bouaziz, “Study of Breakable Tectonics in Punt Forms and the Saharian Atlas (Meridional Tunisi) Evolution of the Paleo Fields of Constraints and Geodynamic Implications,” Thesis of State FAC Sc Tunis, Tunis, 1995.
- S. Wade, J. P. Rudant, A. M. Dia and J. Kouamé, “Application of Earth Observation Data and GIS to Urban Flood Magement—Case-Study of Saint Louis, Senegal (West Africa),” Abstract United Nations Regional Workshop on the Use of Space Technology for Disaster Management for Africa, Munich, 18-22 October 2004, pp. 221-250.
- R. Derouiche and H. Chaib, “Study by Digital Model of the Impact of Installations on the Refill of the Groundwater of Zeuss Koutine,” General Direction of Resources Water (Direction Générale des Ressources en Eau DGRE), 1997.
- M. Fersi, “Hydrogeological Study of the River of Oum Ezassar in Koutine,” General Direction of Resources Water (Direction Générale des Ressources en Eau DGRE), 1985.
- G. Dawod, M. Mirza and K. Al-Ghamdi, “GIS-Based Spatial Mapping of Flash Flood Hazard in Makkah City, Saudi Arabia,” Journal of Geographic Information System, Vol. 3, No. 3, 2011, pp. 225-231.
- E. Gaubi, “Study of the Piezometry and the Geochemistry of the Groundwater of Zeuss Koutine (Area of Medenine),” Faculty of Sciences of Tunis FST, 1988.
- T. Hatzichristos and M. Giaoutzi, “Landfill Siting Using GIS, Fuzzy Logic and Delphi Method,” International Journal of Environmental Technology and Management, Vol. 6, No. 1-2, 2006, pp. 218-231. http://dx.doi.org/10.1504/IJETM.2006.008263
- F. Kamoun, “The Jurassic Level of the Pilot Tunisian South of the African margin of the Tethys Stratigraphy, Sedimentology and Micropaleontology,” Specialty Thesis, University Paul Sabatier Toulouse III Review of Sciences of the Ground, Vol. 11, 1989, p. 338.
- W. Mamou, “Characteristics and Evolution of the Water Resources of the Southern Tunisia,” State Doctor Thesis, University of Southern Paris, Paris, 1990.
- F. Monat, “Installation of a Geographical Information System (GIS) on the Basin of Merguellil (Tunisia) Training Course of Second Year Report,” Dr. Bernard Jatiskander, Montpellier, 2000.
- Reports (2005-2011) of Drillings of the Groundwater of Zeuss Koutine. DGRE and SONEDE. General Direction of Resources Water (Direction Générale des Ressources en Eau DGRE), pp. 5-7.
- M. Ross and P. Tara, “Integrated Hydrologic Modeling with Geographic Information Systems,” Journal of Water Resources Planning and Management, Vol. 119, No. 2, 1993, pp. 129-140. http://dx.doi.org/10.1061/(ASCE)0733-9496(1993)119:2(129)
- S. Saidi, S. Bouri and H. Ben Dhia, “Groundwater Vulnerability and Risk Mapping of the Hajeb-Jelma Aquifer (Central Tunisia) Using a GIS-Based DRASTIC Model,” Environmental Earth Sciences, Vol. 59, No. 7, 2010, pp. 1579-1588. http://dx.doi.org/10.1007/s12665-009-0143-0
- S. Saidi, S. Bouri, H. Ben Dhia and B. Anselme, “A GIS-Based Susceptibility Indexing Method for Irrigation and Drinking Water Management Planning: Application to Chebba-Mellouleche Aquifer, Tunisia,” Agricultural Water Management, Vol. 96, No. 12, 2009, pp. 1683- 1690. http://dx.doi.org/10.1016/j.agwat.2009.07.005
- P. Santra, U. K. Chopra and D. Chakraborty, “Spatial Variability of Soil Properties and Its Application in Predicting Surface Map of Hydraulic Parameters in an Agricultural Farm,” Current Science, Vol. 95, No. 7, 2008, pp. 937-945.
- A. Sarangi, C. A. Madramootoo and P. Enright, “Comparison of Spatial Variability Techniques for Runoff Estimation from a Canadian Watershed,” Biosystems Engineering, Vol. 95, No. 2, 2006, pp. 295-308. http://dx.doi.org/10.1016/j.biosystemseng.2006.06.002
- H. Yahyaoui, H. Chaieb and Mr. Ouessar, “Impact of Work of Conservation of Water and Grounds on the Refill of the Groundwater of Zeuss-Koutine (Medenine Tunisian South-East),” In: J. Graaff and Mr. Ouessar, Eds., Toilets Harvesting in Mediterranean Zones Year Impact Assessment and Economic Evaluation, Wageningen University, Wageningen, 2002, pp. 71-86.
- H. Yahyaoui and Mr. Ouessar, “Abstraction and Recharge Impacts on the Ground Water in the Arid Regions of Tunisia Case of Zeuss-Koutine Water Table,” UNU Desertification Series, 2000, pp. 72-78.
- H. Yahyaoui, “Hydrogeologic Study of the Ground Water of the Catchment Area of the Rivers of Smar,” General Direction of Resources Water (Direction Générale des Ressources en Eau DGRE), 1999.
- H. Yahyaoui, “Updating Balances of the Deep Groundwaters in the Governorate of Medenine,” General Direction of Resources Water (Direction Générale des Ressources en Eau DGRE), 2000.
- H. Zammit, “Modeling of the Hydrogeology and the Salinity of the Groundwater of Zeuss Koutine,” Ecole des Ingénieurs Tunis ENIT, 2002.
- P. P.Adhikary, H. Chandrasekharan, D. Chakraborty and K. Kamble, “Assessment of Groundwater Pollution in West Delhi, India Using Geostatistical Approach,” Environmental Monitoring and Assessment, Vol. 167, No. 1-4, 2010, pp. 599-615. http://dx.doi.org/10.1007/s10661-009-1076-5
- H. Ben Ouezdou, “Morphological and Stratigraphic Study of the Quaternary Formations of the Gulf of Gabes,” Reviews of Groundwater Science, Vol. 5, No. 4, 1987, pp. 165-166.
- J. P. Dash, A. Sarangi and D. K. Singh, “Spatial Variability of Groundwater Depth and Quality Parameters in the National Capital Territory of Delhi,” Environmental Management, Vol. 45, No. 3, 2010, pp. 640-650. http://dx.doi.org/10.1007/s00267-010-9436-z
- E. Gaubi, “Hydrological Synthesis of the Triassic Sandstone Groundwater (Regions of Medenine and of Tataouine),” Africain Journal Science, Vol. 10, No. 5, 2011. pp. 13-14.
- B. W. Hermant, D. Dibyendu, V. R. Desai, B. Klaus and A. Rafig, “Morphometric Analysis of the Upper Catchment of Kosi River, Using GIS Techniques,” Saudi Society for Geosciences, Vol. 7, No. 6, 2011, pp. 13-14.
- S. Mohan and R. Gandhimathi, “Solid Waste Charactrization and Assessment of the Effect of Dumping Site Leachate on Groundwater Quality: A Case Study,” International Journal of Environment and Waste Management, Vol. 3, No. 1-2, 2009, pp. 65-77. http://dx.doi.org/10.1504/IJEWM.2009.024700