Smart Grid and Renewable Energy
Vol.4 No.2(2013), Article ID:32184,11 pages DOI:10.4236/sgre.2013.42023
Hybrid Power Systems Energy Controller Based on Neural Network and Fuzzy Logic
![]()
Advanced Industrial Diagnostics Centre, School of Engineering, Manchester Metropolitan University (MMU), Manchester, UK.
Email: emad.nat@gmail.com
Copyright © 2013 Emad M. Natsheh, Alhussein Albarbar. This is an open access article distributed under the Creative Commons Attribution License, which permits unrestricted use, distribution, and reproduction in any medium, provided the original work is properly cited.
Received January 29th, 2013; revised February 28th, 2013; accepted March 7th, 2013
Keywords: Artificial Neural Network; Energy Management; Fuzzy Control; Hybrid Power Systems; Maximum Power Point Tracker; Modeling
ABSTRACT
This paper presents a novel adaptive scheme for energy management in stand-alone hybrid power systems. The proposed management system is designed to manage the power flow between the hybrid power system and energy storage elements in order to satisfy the load requirements based on artificial neural network (ANN) and fuzzy logic controllers. The neural network controller is employed to achieve the maximum power point (MPP) for different types of photovoltaic (PV) panels. The advance fuzzy logic controller is developed to distribute the power among the hybrid system and to manage the charge and discharge current flow for performance optimization. The developed management system performance was assessed using a hybrid system comprised PV panels, wind turbine (WT), battery storage, and proton exchange membrane fuel cell (PEMFC). To improve the generating performance of the PEMFC and prolong its life, stack temperature is controlled by a fuzzy logic controller. The dynamic behavior of the proposed model is examined under different operating conditions. Real-time measured parameters are used as inputs for the developed system. The proposed model and its control strategy offer a proper tool for optimizing hybrid power system performance, such as that used in smart-house applications.
1. Introduction
Renewable energy sources have been found to be promising energy sources toward building a sustainable and environment friendly energy economy in the next decade. Among these renewable energy sources, solar and wind energy which are two of the most promising renewable power generation technologies. The growth of PV and wind power generation systems has exceeded the most optimistic estimation. However, geographic and seasonal climatic conditions affect the solar-wind energy output. Therefore, a backup power system is needed to improve the energy supply reliability. Thus, the PEMFC with a reversible energy storage system ideally fulfills the need for any start up power.
However, the price of PEMFC is considerably high and its membrane lifetime is rather short [1]. In addition, the dynamic interaction between the load demand and the renewable energy source can lead to critical problems of stability and power quality that are not very common in conventional power systems. Therefore, managing the flow of energy throughout the hybrid system is essential to increase the operating life of the membrane and to ensure the continuous energy flow.
In the literature, there are a few studies related to energy management of hybrid power system [2]. Among them, Wang and Nehrir [3], proposed a power management strategy for an ac-linked hybrid wind/PV/FC energy system. Ahmed et al. [4], presented a power management strategy which studied power fluctuations in a hybrid PV/wind turbine/FC power system. Onar et al. [5], proposed a power management strategy algorithm which dealt with a hybrid PV/wind/FC power system containing an ultra capacitor bank. However, all of the early mentioned methods have used conventional approaches for controlling hybrid power systems, such as linear PI controller which has afterwards been proven its instability in handling various changes in weather conditions [6,7]. This resulted in developing other approaches led to more robust algorithms with ability to handle various changes dynamically without any major problems; by establishing new management criteria depending upon informational data and the environmental changes.
Moreover, previous studies showed [8,9] that using the artificial intelligence in the hybrid vehicle can control the FC system within a specified high-efficiency region. Hence, this paper presents an adaptive management strategy for power flow in stand-alone hybrid power systems based on fuzzy logic and neural network. The proposed method introduces an online energy management by a hierarchical controller between four energy sources comprises PV panels, wind turbine, battery storage, and PEMFC. The overall aim is to optimize the active power flow between system power sources for different modes of operation, and to maintain the battery state-of-charge (SOC) at a reasonable level. The block diagram of the developed hybrid power system is shown in Figure 1.
The paper is organized as follows: Section 2 presents the dynamic model of the hybrid system. The proposed control structure is addressed in Section 3. Here PEMFC temperature controller based on fuzzy logic is implemented. To demonstrate the effectiveness of the proposed strategy, simulation results are presented in Section 4; and finally, in Section 5, conclusions are given.
2. Dynamic Modeling of Hybrid System
In this section, the dynamic simulation model is described for a hybrid power system consists of a PV panels, wind turbine, PEM fuel cell, lithium-ion (Li-Ion) battery bank, dc-dc and dc-ac converters. The mathematical models describing the dynamic behaviour of each of these components are given below.
2.1. The Photovoltaic Module
The general mathematical model for the solar cell has been studied over the past three decades [10]. The model of PV power plant used in this study is based on the dynamic PV model developed and validated in our previous work [11]. The following equation model the current of the PV cell [11]:
 (1)
(1)
where Igc is the light generated current, Io is the dark saturation current dependant on the cell temperature, q is the electric charge (1.6 × 10⁻¹⁹ C), KB is the Boltzmann’s constant, F is the cell idealizing factor, Tc is the cell’s absolute temperature, vd is the diode voltage, and Rp is the parallel resistance.
2.2. The Wind Turbine
Several studies have been reported regarding to WT and

Figure 1. Block diagram of the proposed system.
wind generators [12]. In this study, the proposed WT model is based on the wind speed versus WT output power characteristics. The output power of the wind turbine is given by [13]:
 (2)
(2)
where Pm is the mechanical output power of the turbine, cp is the performance coefficient of the turbine, β is the blade pitch angle, ρ is the air density, AS is the swept area, and υwind is the wind speed. The performance coefficient of the turbine (cp) can be presented as in Equation (3). This equation based on the modeling turbine characteristics of [13].
 (3)
(3)
where
 (4)
(4)
In this model, whereas the inputs are the wind speed and generator speed, the output is the torque applied to the generator shaft. The permanent magnet dc generator model is designed using the built-in SimPowerSystem library.
2.3. The Proton Exchange Membrane Fuel Cell
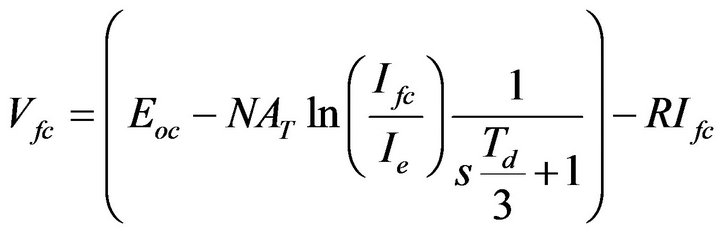
PEMFC is an electrochemical device that converts chemical energy into electrical energy. They show great performance in residential applications due to the low working temperature and fast start-up. The modified PEMFC model used in this study is based on the dynamic PEMFC stack model developed and validated in [14]. The following equation model the voltage of the fuel cell stack [14]:
 (5)
(5)
where Eoc is the open circuit voltage, N is the number of cells, AT is the Tafel slope, Ie is the exchange current, Ifc is the fuel cell current, Td is the response time, and R is the internal resistance.
2.4. The Li-Ion Battery
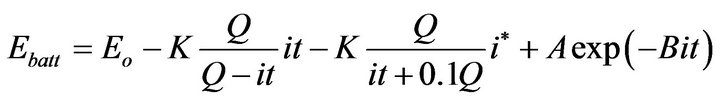
In this section, the mathematical modeling of the Li-Ion battery bank used in the simulation program is introduced. The open voltage source is calculated with a nonlinear equation based on the actual SOC of the battery as follows [15]:
 (6)
(6)
Ÿ During discharge:
 (7)
(7)
Ÿ During charge:
 (8)
(8)
where Ebatt is the no-load voltage, Eo is the battery constant voltage, K is the polarization constant, Q is the battery capacity, it is the actual battery charge, i* is the low frequency current dynamics, A is the exponential zone amplitude, B is the exponential zone time constant inverse (Ah)−1, Vbatt is the battery voltage, and i is the battery current. The main feature of this battery model is that the parameters can easily be deduced from a manufacturer’s discharge curve [15]. The SIMULINK model for the Li-Ion battery has been validated in previous works [15,16].
2.5. The Power Conditioning Units
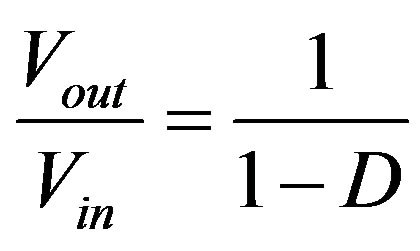
To connect a photovoltaic, wind turbine or PEMFC to an external system, it is necessary to boost their voltage or to increase their number. Therefore, a boost converter is used. A boost converter is a class of switching-mode power supply containing at least two semiconductor switches and at least one energy storage element. In addition, a capacitor is often added to the converter output to reduce the ripple of its output voltage. Equation (9) describes the relation between the input and the output voltage of a boost converter as a function of the duty cycle D:
 (9)
(9)
On the other hand, an ac averaged switched model inverter has been implemented as in [13].
3. Energy Management and Control System
3.1. PV MPPT Based on Neural Network
Tracking the MPP of a photovoltaic array is an essential part of a PV system. As such, many maximum power point tracking (MPPT) techniques have been developed and implemented. Among these techniques, hill-climbing MPPT such as perturb and observe (P&O), which is a simple algorithm that does not require previous knowledge of the PV generator characteristics and is easy to implement with analogue and digital circuits [11]. However, the main problem of this technique can be seen when solar radiation rapidly change. In addition, P&O technique may cause many oscillations around the MPP, and this slows down the response of the system. In this model, intelligent control technique using artificial neural network is associated to an MPPT controller in order to increase the tracking response and consequently increase the tracking efficiency. Figure 2 shows the structure of the proposed PV control system.
The neural network control (NNC) is used to estimate the PV array operating voltage (Vref) which corresponds to Pmax at any given solar radiation and cell temperature. It consists of three layers. The input layer is composed of three nodes in inputs which are: the solar radiation, the cell temperature and the cell’s open circuit voltage at a 25˚C and 1 kW/m2. The hidden layer is composed of four nodes whose activation function is the hyperbolic tangent sigmoid transfer function. The output layer is composed of one node that is the optimum operating voltage whose function of activation is of the linear type. Once the neural network model architecture is defined, data are collected and fed to the model. The network is then trained to recognize the relationships between the input and output parameters. The proposed NNC uses the Levenberg Marquardt (LM) training algorithm [17]. In this algorithm, the interlayer connection weight and the processing element’s thresholds are first initialized at small random values. The network is then presented with a set of training patterns. Each set is composed of three inputs (solar irradiance, temperature, cells open circuit voltage), and one output. The solar irradiance and temperature data are gathered from a 28.8 kW solar power system located on a tower block on campus in MMU, central Manchester [16]. The output or rather the targeted output (ideal Vref) is generated from an applied Matlab code which analyzes the output P-V characteristics of the validated PV model.

Figure 2. The proposed PV control system.
Prior to conducting the network training operation using the LM algorithm, a training set of 2000 cases were obtained from four different PV panels, namely: Lorentz, Sharp’s-NUS0E3E, BP-485J, and Astronergy-CHSM- 6610P. The cell’s open circuit voltage (Voc) is used as a reference variable to select from among the four PV panels. This training data set covers the different solar radiation and temperature conditions that could possibly take place. The training patterns were presented repeatedly to the neural network model and the adjustment was performed after each iteration whenever the network’s output is different from the desired output. This process continues until the mean square error (MSE) converged and is measure at less than 0.01.
3.2. Advanced Fuzzy Energy Distribution Strategy
The energy management strategy (EMS) should determines the split power between the photovoltaic, wind turbine, fuel cell stack and battery while satisfying the load power requirement with respect to dynamic restrictions to the battery and fuel cell stack. The EMS developed in this work is shown in Figure 3.
Frequent power demand variations and unpredictable load profile are unavoidable. Adding to this, the nonlinear subsystems add to the complexity of the structure of hybrid system. Hence, an advance fuzzy expert system according to the weather variations, load demand and SOC is presented. Figure 4 shows the proposed fuzzy expert system.
A fuzzy logic controller (FLC) is used to decide the optimum operation of the PEMFC/battery system. As shown in Figure 3, there are five possible operating modes. When in hybrid mode, PEMFC power changes smoothly so that the FC operating point deviation is minimized.
The battery management system maintains the SOC at a reasonable level (40% - 80%). Also, it protects against voltage collapse by controlling the power level required from the battery (PB) (see Figure 3). An S-R flip-flop type has been used for storing battery status (BS). The power management system controls the reference power of the PEMFC stack (FC_Pref) by splitting the power demand (PL) as a function of the available power of the battery and the PV/WT system (PH) (see Figure 3). The FLC relates the outputs to the inputs using a list of if-then statements called rules. The if-part of the rules describes the fuzzy sets (regions) of the input variables. In this work, the fuzzy variables PH, PL, and SOC are described by fuzzy singleton, i.e. the measured values of these variables are used in the interface process without being fuzzified. Specifically, the fuzzy rules are in the form:
Rule i: IF PH is Ai and PL is Bi and SOC is Ci, THEN FCE is Di and BS is Ei.

Figure 3. Proposed energy management system algorithm.

Figure 4. Proposed fuzzy expert system for EMS.
Where Ai, Bi, and Ci are fuzzy subsets in their universes of discourse, and Di, Ei are fuzzy singletons. Each universe of discourse is divided into three fuzzy subsets: L (Low), M (Medium), and H (High). The fuzzy subsets and the shape of membership function are shown in Figure 5.
These degrees of membership are evaluated to obtain the output controller, and the then-parts of all rules are averaged and weighted by these degrees of membership. The core of the rule set of the fuzzy controller is shown
 (a)
(a)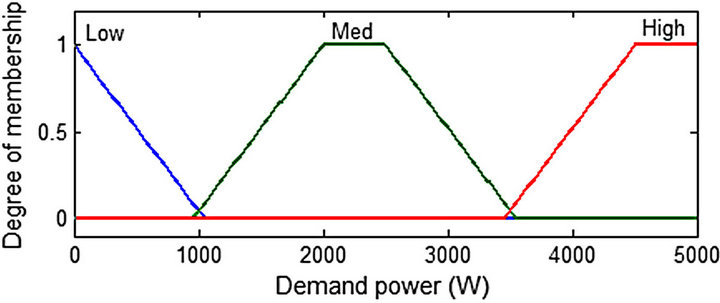 (b)
(b) (c)
(c)
Figure 5. Membership functions of the FLC. (a) PV/WT power; (b) Load demand; (c) Battery SOC.
in Table 1.
3.3. PEMFC: Temperature Controller
The operating temperature of the stack is an important controlled variable, which impacts the performance of the PEMFC. Hence, in order to improve the generating performance of the PEMFC and prolong its life, it must be controlled efficiently. Consequently, in this work, the PEMFC stack model described by Oliver in [14] is modified to include a fuzzy logic temperature controller.
The main function of this control system is to maintain the temperature stable and equal to the stack operating temperature. The FLC is used to control the airflow from the heater and cooler fans, based on the stack temperature. In case of cold start-up, the heater fan (F1) needs to be on; until the stack temperature is equal to the room temperature. On the contrary, if the stack temperature is hot, the cooler fans (F2) speed needs to be at the high level. Triangular membership functions and centroid defuzzification method are adopted. The membership functions are shown in Figure 6.
Table 2 shows the rule base of the FLC.
Over time, the control system calculates the cooling/ heating effect inside the stack, taking into account the thermal isolation and cooling/heating activities. And based on these equations the output temperature will be calculated as follow [18]:
 (10)
(10)
 (11)
(11)
where TA is the ambient temperature, TFC is the FC stack temperature, KT is the thermal isolation multiplier, and KFan is the cooling/heating factor.
4. Simulation and Discussion
4.1. The Evaluation of the Proposed MPPT
Using the 400 cases allocated for the testing set, the modelinput parameters were entered consecutively for each case and a prediction for the optimal Vref was obtained.
The prediction results were then compared with the actual results of the 400 cases. The statistical analysis of these results indicates that the R2 value for the testing set was 0.99. This result demonstrates that the MPPT-NNC model developed in this work can predict the optimal Vref for any trained PV panel with high accuracy. The graphical results of the first 31 cases in the testing set are shown in Figure 7.
Figure 8 compares the optimum power (Pmpp) obtained from the classical P&O algorithm and the proposed ANN.
From Figures 8(a) and (b), it is shown that by using the ANN the optimum power will be steadier and close to the theoretical power when compared to the classical P&O algorithm.
4.2. The Proposed Hybrid System
In the simulation process, the aim is to observe the proposed system behavior under different operating condi-
 (a)
(a) (b)
(b)
Figure 6. Membership functions of the FLC temperature. (a) Stack temperature; (b) Cooling/heating air flow.
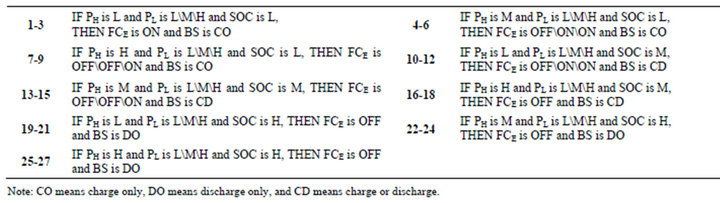
Table 1. Fuzzy logic rules.

Figure 7. Actual and predicted PV operating voltage for the first 31 cases in the testing set.
 (a)
(a) (b)
(b)
Figure 8. Comparing the Pmpp obtained from the classical P&O algorithm and the proposed ANN. (a) Pmpp at different conditions; (b) Pmpp at 400 W/m2, 10˚C (Sharp’s NUS0E3E).

Table 2. FLC rules for the temperature controller.
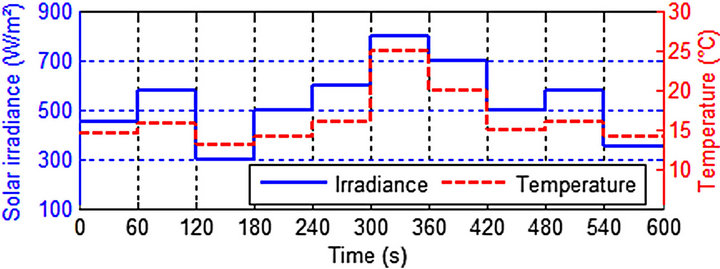
tion. The solar radiation, panel temperature, wind speed and user load profiles are all used to test the performance of the proposed hybrid system model, as shown in Figures 9(a)-(c).
Simulation results are obtained by developing a detailed MATLAB/SIMULINK software package.
The specifications of the renewable power sources used are given in Table 3. The specifications of the LiIon battery and PEMFC stack system are given in Tables 4 and 5. Finally, Table 6 shows the power conditioning units’ parameters include dc-dc and dc-ac converters.
Simulation results are obtained for the time interval between 0 and 600 sec. The power demand profile has a significant effect on determining the EMS. A practical load profile for two family members in resident appli-
 (a)
(a) (b)
(b)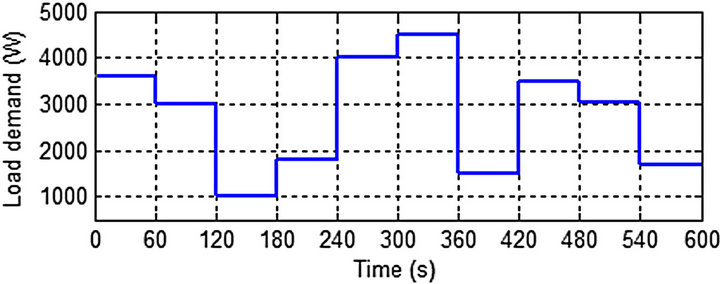 (c)
(c)
Figure 9. (a) Solar radiation and panel temperature profiles; (b) Wind speed profile; (c) Load demand profile.
cation [2] is established, as shown in Figure 9(c). From this load profile it is evident that the average power demand is less than 2.8 kW. However, due to weather condition, the output power of the PV/WT system varies from 1.1 to 3.6 kW, as shown in Figure 10. Therefore, a PEM fuel cell with a reversible ESS was added to the renewable power system. The battery bank system is capable of sustaining the extra load of 1.3 kW for 1 h during peak load demand periods. While, the 6 kW PEMFC can meets the remaining extra power and protect the battery from overcharging.
Moreover, according to the proposed EMS algorithm, battery SOC level is determines the operation of the PEMFC, during peak load demand periods. Therefore in the following subsections two cases have been tested during the simulation. The solar radiation, wind speed and user load profiles are the same for the two cases (see Figure 9).
4.2.1. First Case
The initial SOC of the battery storage is 33.5%. Hence, when the SOC is low (0 - 120 sec), the peak load demand is satisfied by the PEMFC stack, and the extra power will be used to charge the battery (SOC goes high), as shown in Figure 11(a). However, during that time, the PEMFC stack power is very high. Consequently, in order to maintain the stack temperature stable and equal to the stack operating temperature (65˚C), a fuzzy logic temperature controller has been added, as shown in Section 3.3. Figures 11(b) and (c) show the cooling activity and stack temperature during that period. On the other hand, when the SOC is above 42.5%, then the remaining energy is satisfied by either the battery bank or by the hybrid PEMFC/battery system, as shown in Figures 11(a) and (d).
The power met by the battery introduces a current change at the battery bank terminal as depicted in Figure 11(e). When the battery current is positive (time intervals 240 to 360 sec and from 420 to 540 sec), energy is transferred to the load by the battery bank. When the battery current is negative, the battery bank is recharged. Figure 11(f) shows the SOC of the battery during the simulation.
4.2.2. Second Case
The initial SOC of the battery storage is 87%. The system response to changes in solar irradiance and load profile is presented in the following figures. The peak load demand is satisfied by the battery bank as shown in Figure 12(a). During this case the PEMFC is off; since the battery SOC is high. Figure 12(b), shows the variation of

Table 3. PV/WT system specifications.

Table 4. Li-Ion battery parameters.

Table 5. PEMFC stack parameters.

Table 6. Power conditioning units’ parameters.
 (a)
(a) (b)
(b)
Figure 10. (a) Total power of the solar power plant; (b) Total power of the wind turbine.

Figure 11. System response during the first case. (a) Power satisfied by PEMFC; (b) Cooling air flow; (c) PEMFC stack operating temperature; (d) Power satisfied by battery; (e) Battery current change with respect to load profile; (f) Battery SOC.
the battery bank current between positive (discharging) and negative (charging) according to the required load demand. Figure 12(c) shows the SOC of the battery during the simulation.
Consequently, it’s clear that during peak load demand the PV/WT system supplies the available power and the battery bank supplies the remaining extra power (0 - 120 sec, 240 - 360 sec, and from 420 - 540 sec). On the other hand, when the produced power by the PV/WT system is more than the required power of load, and the SOC of the battery is below 80%, the extra power of the PV/WT will be used to charge the battery and the SOC goes high (360 - 380 sec). Otherwise, if the SOC is above 80%, based on the EMS it is not in the safe charge mode. In this case the excess power goes to the grid as shown in Figure 12(d).
The simulated grid side inverter voltage and current waveforms are shown in Figure 12(e). It can be seen that the line current is pure sinusoidal and in phase with the grid voltage.
5. Conclusions
An optimized online energy management based on a hierarchical controller has been implemented for standalone hybrid power systems. The proposed method includes an NNC in the first layer, to achieve the MPP for different types of PV panels. The statistical analysis of the results indicates that the R2 value for the testing set was 0.99. This indicates that the ANN-based model developed in this work can predict the MPP for a PV panel with high accuracy. Moreover, results of the proposed


Figure 12. System response during the second case. (a) Power satisfied by battery; (b) Battery current change with respect to load profile; (c) Battery SOC; (d) Power delivered to the grid; (e) Grid voltage/current waveforms.
NNC shows better transient performance, with low overshoot, compared to the results obtained from literature [2-6].
Simulation results were obtained by developing a detailed dynamic hybrid system model. Real-time measured parameters and practical load profile are used as inputs for the developed management system. It was found that the hybrid topology exhibits excellent performance under various operating conditions, and maintain the SOC between 40% - 80%.
REFERENCES
- Y. Wang, K. S. Chen, J. Mishler, S. C. Cho and X. C. Adroher, “A Review of Polymer Electrolyte Membrane Fuel Cells: Technology, Applications, and Needs on Fundamental Research,” Applied Energy, Vol. 88, No. 4, 2011, pp. 981-1007. doi:10.1016/j.apenergy.2010.09.030
- E. Dursun and O. Kilic, “Comparative Evaluation of Different Power Management Strategies of a Stand-Alone PV/Wind/PEMFC Hybrid Power System,” Electrical Power and Energy Systems, Vol. 34, No. 1, 2012, pp. 81-89. doi:10.1016/j.ijepes.2011.08.025
- C. Wang and M. H. Nehrir, “Power Management of a Stand-Alone Wind/PV/Fuel Cell Energy System,” IEEE Energy Conversion, Vol. 23, No. 3, 2008, pp. 957-967. doi:10.1109/TEC.2007.914200
- N. A. Ahmed, M. Miyatake and A. K. Al-Othman, “Power Fluctuations Suppression of Stand-Alone Hybrid Generation Combining Solar Photovoltaic/Wind Turbine and Fuel Cell Systems,” Energy Conversion and Management, Vol. 49, No. 10, 2008, pp. 2711-2719. doi:10.1016/j.enconman.2008.04.005
- O. C. Onar, M. Uzunoglu and M. S. Alam, “Modeling, Control and Simulation of an Autonomous WT/PV/FC/ Ultra-Capacitor Hybrid Power System,” Journal of Power Sources, Vol. 185, No. 2, 2008, pp. 1273-1283. doi:10.1016/j.jpowsour.2008.08.083
- A. Tofighi and M. Kalantar, “Power Management of PV/ Battery Hybrid Power Source via Passivity-Based Control,” Renewable Energy, Vol. 36, No. 9, 2011, pp. 2440- 2450. doi:10.1016/j.renene.2011.01.029
- W. Zhou, C. Lou, Z. Li, L. Lu and H. Yang, “Current Status of Research on Optimum Sizing of Stand-Alone Hybrid Solar Wind Power Generation Systems,” Applied Energy, Vol. 87, No. 2, 2010, pp. 380-389. doi:10.1016/j.apenergy.2009.08.012
- X. Li, L. Xu, J. Hua, X. Lin, J. Li and M. Ouyang, “Power Management Strategy for Vehicular Applied Hybrid Fuel Cell/Battery Power System,” Journal of Power Sources, Vol. 191, No. 2, 2009, pp. 542-549. doi:10.1016/j.jpowsour.2009.01.092
- C.-Y. Li and G.-P. Liu, “Optimal Fuzzy Power Control and Management of Fuel Cell/Battery Hybrid Vehicles,” Journal of Power Sources, Vol. 192, No. 2, 2009, pp. 525-533. doi:10.1016/j.jpowsour.2009.03.007
- M. G. Villalva, J. R. Gazoli and E. R. Filho, “Comprehensive Approach to Modeling and Simulation of PV Arrays,” IEEE Power Electronics, Vol. 24, No. 5, 2009, pp. 1198-1208. doi:10.1109/TPEL.2009.2013862
- E. M. Natsheh and A. Albarbar, “Photovoltaic Model with MPP Tracker for Stand-Alone/Grid Connected Applications,” IET Conference on Renewable Power Generation, Edinburgh, 6-8 September 2011, pp. 1-6. doi:10.1049/cp.2011.0205
- H. D. Battista, R. J. Mantz and F. Garelli, “Power Conditioning for a Wind Hydrogen Energy System,” Journal of Power Sources, Vol. 155, No. 2, 2006, pp. 478-486. doi:10.1016/j.jpowsour.2005.05.005
- E. M. Natsheh, A. Albarbar and J. Yazdani, “Modeling and Control for Smart Grid Integration of Solar/Wind Energy Conversion System,” IEEE PES International Conference and Exhibition on Innovative Smart Grid Technologies, Manchester, 5-7 December 2011, pp. 1-8. doi:10.1109/ISGTEurope.2011.6162643
- N. M. Souleman, O. Tremblay and L.-A. Dessaint, “A Generic Fuel Cell Model for the Simulation of Fuel Cell Power Systems,” IEEE Power & Energy Society General Meeting, Quebec, Montreal, 26-30 July 2009, pp. 1-8.
- O. Tremblay, L.-A. Dessaint and A.-I. Dekkiche, “A Generic Battery Model for the Dynamic Simulation of Hybrid Electric Vehicles,” IEEE Vehicle Power and Propulsion Conference, Arlington, 9-12 September 2007, pp. 284-289.
- E. M. Natsheh and A. Albarbar, “Solar Power Plant Performance Evaluation: Simulation and Experimental Validation,” Journal of Physics: Conference Series, Vol. 364, No. 1, 2012, pp. 1-13.
- M. Negnevitsky, “Artificial Intelligence: A Guide to Intelligent Systems,” Addison Wesley, Boston, 2004.
- MathWorks, “Documentation Center,” 2012. http://www.mathworks.co.uk/help/stateflow/gs/a-look-at-the-physical-plant.html