Neuroscience & Medicine
Vol.2 No.2(2011), Article ID:5527,7 pages DOI:10.4236/nm.2011.22016
Re-parameterization of the Logistic Model in Assessing Changes in the Baroreceptor Reflex—Logistic Model for Changes in Baroreceptor Reflex
![]()
1Department of Biostatistics, University of North Texas, Fort Worth, USA; 2Department of Integrative Physiology, University of North Texas, Health Science Center, Fort Worth, USA.
Email: Shande.Chen@unt.hsc.edu
Received March 16th, 2010; revised April 16th, 2010; accepted April 25th, 2010.
Keywords: Blood Pressure, Carotid Sinus Pressure, Heart Rate, Mathematical Model, Maximum Gain, Nitroprusside, Operating Range
ABSTRACT
The logistic model is frequently used to describe the nonlinear relationship between systemic arterial pressure (SAP) and carotid sinus pressure (CSP). In this paper, we propose using maximum gain and saturation as parameters in the logistic model. By this method, the estimates and standard errors together with confidence intervals for maximum gain and saturation are direct outputs from the curve fitting, which also makes it easy to perform various hypotheses testing on these quantities. The method is illustrated by real life data from a study on the carotid baroreflex function during infusion of sodium nitroprusside, in which seven healthy, young men who were clinically proved to be free from any disease were studied. Their heart rate, arterial blood pressure and central venous pressure were measured. Neck pressure and neck suction protocol was carried out to selectively elicit changes in CSP and the responsiveness of SAP. Data were analyzed and compare before and after nitroprusside infusion. Our results showed that nitroprusside significantly decreased arterial blood pressure and central venous pressure, and significantly increased heart rate, and significantly augmented maximum gain of the carotid baroreflex function.
1. Introduction
The logistic model is one of the most commonly used parametric models in assessing changes in arterial baroreceptor reflex. The model introduced by Kent et al. in 1972 [1] relates change in carotid sinus pressure (CSP), x, to response of systemic arterial pressure (SAP), which is given by the equation:

where  is the range of y (i.e., ABP responding range),
  is the multiplier in the exponential function,
  is the centering point of x which can elicit equal pressor or depressor response, and
  is the minimum of the function y. The carotid baroreceptor reflex (CBR) gain (or slope) of entire CSP-SAP stimulus-response from the threshold to the saturation point can be determined from the first derivative of the logistic function. Since these parameters or their derivatives have relevant and important meaning in interpreting the carotid sinus baroreflex function, this model has been extensively applied to human carotid baroreflex control of SAP and heart rate (HR) at rest and during physical exercise [2-7].
Generally, the stimulus-response curve of individual subjects has a sigmoid shape, which can be fitted into this four-parameter model. Subsequently, every individual responding range of SAP (A1), i.e., the difference between maximum and minimum response, centering point of CSP (A3) where the maximal slope is located, and the minimum SAP (A4) are determined. Individual maximum gain (Gmax), the largest slope in the logistic curve (when SAP = A3) is derived or calculated from , saturation (Csat) and threshold (Cthr) are defined as
  and
and , respectively. Thus, the operating range of CSP can be calculated from the difference between Csat and Cthr. Then the group data of individual parameters and their derivatives are averaged and compared between different experimental conditions or treatments. However, some subjects, especially from elderly population, cannot produce the typical individual sigmoid stimulus-response curve due to individual variance, despite the fact that the group curves of these subjects show sigmoid shape and can be fitted in to the four-parameter logistic model [7]. Therefore, the present study proposed to fit the logistic model with the group stimulus-response curve [7]. The group parameters
 ,
,  ,
,  and
and  with their standard errors was directly obtained. However, estimated standard errors of their derivatives, such as Gmax, Rop, Csat and Cthr had to be computed by using delta-method.
It is a common practice to report confidence intervals in addition to the point estimates. Therefore, calculating standard errors of the estimates is important [8,9]. Furthermore, testing hypotheses regarding parameters is often needed, e.g., comparing the maximum gains of the two groups. To perform the Wald test also requires standard errors. Since the maximum gain is usually a very important parameter for the SAP-CSP relationship, the logistic model with natural parameters brings computational burdens, especially when many curves need to be fitted. In this paper, we propose directly using maximum gain and saturation as parameters in the logistic model. This alternative parameterization enables the estimated standard errors and confidence intervals for the maximum gain and operation range to be obtained directly from the output of the statistical software. We then fitted two group stimulus-response curves during normotensive control and hypotensive challenge by sodium nitroprusside infusion using this alternative parameterization directly from the output of the statistical software using the Statistical Analysis System (SAS) software PROC NLIN.
2. Methods
2.1. Subjects
Seven healthy, young men (26.4 ± 1.3 yr and 74.6 ± 4.1 kg) participated in the study after having given a written consent that was approved by the Institutional Review Board for Protection of Human Subjects at UNT Health Science Center. All subjects were clinically proved to be free from any disease and had an orientation at the lab to familiarize with the experimental measurements and procedure after having passed a physical examination.
2.2. Measurements
Heart rate (HR) was monitored from a standard lead of electrocardiogram (ECG). Arterial blood pressure (ABP) was determined from an intra-radial arterial catheter interfaced with a monitor (Hewlett-Parkard, Model 78205D/ 7803B). Central venous pressure (CVP) was measured via a double lumen catheter (50 cm, French 5, Cook Critical Care Inc.) placed through the basilica vein with until the tip of the catheter advanced under fluoroscopy(Philips BV22, Eindhoven, Netherlands) at the fourth intercostal space. Both ABP and CVP were continuously monitored via a dual set of pressure transducers (Cobe Inc, Lakewood, CO). The pressure transducers were calibrated before and after each experiment and the reference point of these transducers was set at the subjects’ midaxillary line.
Changes in CSP were elicited by neck pressure (NP) and neck suction (NS) protocol controlled by a custom-made computer software introduced by Pawelczyk and Raven [2]. A train of pulsatile (500 ms) NP and NS from +40 to –65 Torr was delivered to the subject’s neck through a neck chamber that encompassed the anterior 2/3 of the neck [10] when the subject was holding breathing at the end of normal expiration. Delivery of the pulsatile NP and NS was controlled by R wave of ECG with a difference in three consecutive baseline R-R intervals ≤ 100 ms and each pulse of NP or NS 50 ms delivered after the R waves. The neck chamber was vented to atmospheric pressure after each pulsatile NP or NS delivery to avoid resetting of the baroreceptors. At lease three trains of NP and NS stimulus-response curves with correlation coefficient ≥ 0.75 of R-R interval response were collected from each subject in all experimental conditions for assessing CBR function. A ≥ 90 s recovery was interposed between two trains to ensure fully recovery of ABP and HR.
2.3. Procedures
After 30 min of supine rest from instrumentation, HR, ABP and CVP were continuously recorded for ≥1 min. These measurements were obtained as a baseline control. Neck pressure and neck suction protocol was carried out to assess the carotid baroreflex control of HR and ABP. Immediately after the assessment of the baseline carotid baroreflex function, a continuous infusion of sodium nitroprusside was initiated via the CVP catheter and the infusion rate was increased until a decrease in mean arterial pressure (MAP) approximately 10 mmHg was achieved. The infusion rate of nitroprusside was then maintained constant throughout the rest of the experimental protocol. NP-NS protocol was repeated immediately after ≥1 min baseline data collection with nitroprusside infusion.
2.4. Data Analysis
HR, ABP, CVP were compared between baseline control and nitroprusside infusion with paired t-test. Group stimulus-response curves of CBR control of MAP and HR during the control and nitroprusside infusion were assessed using the Kent’s logistic model [1]

the slope of the curve, as a function of x, is computed by the equation

The maximum gain (Gmax), the largest slope in the logistic curve (which occurs at ), is equal to
  (ignore the sign). The saturation (Csat) is defined as
 , the threshold (Cthr) is defined as
 , according to Chen and Chang [11]. The operation range (OR), i.e., the difference between the saturation and threshold, is equal to
 .
.
When the logistic model is fit, the estimates for parameters ,
,  ,
,  and
and  together with their standard errors can be obtained. The estimates for the maximum gain and the operation range can be easily calculated by replacing
  and
and  with their estimates. The estimated standard errors for the maximum gain and the operation range need to be computed by using deltamethod as follows:


 and
and

where  is the Pearson correlation coefficient between
  and
and , and similarly for
 .
.
An alternative is to parameterize the logistic model directly using Gmax and Rop. We can rewrite the logistic equation as
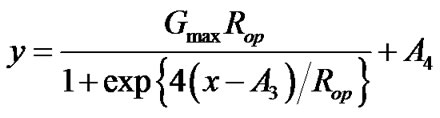 .
.
The meaning of parameters  and
and  remain unchanged. Under this parameterization, the estimates for Gmax and Rop together with their standard errors can be obtained directly from the output, and
 ,
,

 and
and

where  is the Pearson correlation coefficient between
  and
and . A 95% confidence interval for Gmax can be calculated as
 , and similarly for confidence intervals for Rop, Csat and Cthr. With the standard errors, it is easy to perform a z-test to test the difference in the maximum gains (or other parameters) from two groups/conditions. The test statistic is given by

The p-value can be calculated based on the standard normal distribution. The figures were plotted using Sigma Plot software and the data were analyzed using the software SAS with PROC NLIN (see Appendix for the PROCEDURE). Significance level was set at P ≤ 0.05.
3. Results
Infusion of sodium nitroprusside significantly decreased ABP and CVP, and significantly increased HR (Table 1) with a steady-state infusion rate of nitroprusside 125 ± 11 μg/min. Nitroprusside infusion significantly augmented Gmax for both CBR control of MAP and HR, see Figure 1 and Table 2. Furthermore, responding ranges of both MAP and HR (i.e., A1) were significantly increased. However, A3, i.e., the centering point, appeared not statistically different between control and nitroprusside for either MAP or HR.
Under the control, eight observations are used to fit a logistic model related the mean arterial pressure (MAP) with ECSP. The F-test for the overall fitting has a value of 469.45 with 4 and 3 degrees of freedom, which gives a p-value less than 0.0001. The estimates, standard errors and correlation matrix are in Tables 3 and 4. Using the formulas from the delta-method in the previous section, we obtain estimates for Gmax, Rop, Csat and Cthr together with their standard error as in Table 5.
For the logistic model directly using Gmax and Rop, we obtain the estimates and their standard error in Table 6. The 95% confidence intervals for the maximum gain and

Table 1. Hemodynamic data during baseline control and nitroprusside infusion.

Figure 1. Mean arterial pressure and heart rate in response to change in carotid sinus pressure and their derived gain curves. Right and left panels show mean arterial pressure and heart rate (top panels) and their derived gain curves (bottom panels), respectively, during changes in carotid sinus pressure. Nitroprusside infusion significantly displaces mean arterial pressure response curve left-downward and heart rate response curve right-upward (red open symbols and dash lines). However, both gain and operating range of carotid baroreflex control of mean arterial pressure and heart rate both significantly augmented as compared to the control condition (black solid symbols and solid lines).
operation range are directly from the SAS output. The Pearson correlation coefficient between  and
and  is –0.4972883. The results for saturation and threshold from the re-parametrized logistic model are summarized in Table 7. The two methods agree well. The tiny differences are, in general, due to the numerical calculation and convergence criteria.
The MAP under nitroprusside and the HR under the control and under nitroprusside were also fitted. For each fitting, eight observations based on the group means were used. The two methods essentially provided identical results. We list all the results from our proposed parameterization in Table 2.
In fitting the logistic models, we assume that errors are independent. Therefore, it is reasonable to assume that two estimated maximum gains are independent. Thus, z-tests were performed to test whether the maximum gains under control and nitroprusside are different. For MAP, the z-value is 2.743, resulting a p-value of 0.0134,


Table 2. Summaries from the re-parametrized logistic model.

Table 3. Estimates and standard errors from the original logistic model (MAP, control group).

Table 4. Correlation matrix from the original logistic model (MAP, control group).

Table 5. Estimates and standard errors based on the delta-method (MAP, control group).

Table 6. Estimates from the re-parametrized logistic model (MAP, control group).

Table 7. Results for saturation and threshold from the reparametrized logistic model (MAP, control group).
and for HR, the z-value is 7.099, providing a p-value less than 0.0001. For both MAP and HR, the maximum gain is significantly larger after the infusion of nitroprusside.
4. Discussion
We proposed directly using maximum gain and saturation as parameters in the logistic model. By such re-parameterization, the estimates and standard errors for maximum gain and saturation can be obtained directly from outputs of the curve fitting. Though it requires some hand calculation for the saturation and the threshold, the computation for the standard errors is slightly simpler comparing with the model with the natural parameters. The results from the two parameterizations are identical. Thus, as an alternative, the proposed method should be useful in practice. We attach an example SAS code in the Appendix.
Our data suggest that nitroprusside infusion significantly sensitizes the carotid baroreflex function as evidenced by enhanced CBR-MAP and CBR-HR gains (Figure 1). This sensitized carotid baroreflex function is partially attributable to the result of nitroprusside induced relaxation of vascular smooth muscle, which enhances mechanical transmission to the carotid sinus receptors elicited by neck pressure and neck suction procedure. Therefore, given same mechanic stimulus, the carotid baroreceptor is able to transmit greater afferent discharge to the nucleus tractus solitaires and to elicit greater carotid baroreflex responsiveness during nitroprusside infusion than at rest (i.e., control condition). This explains an overall increase in the carotid baroreflex gain during both hypotensive and hypertensive stimuli elicited by neck pressure and neck suction, in addition to the augmented maximal gain.
The other mechanism responsible for the nitroprusside enhanced carotid baroreflex function involves with vasodilation (evident by a significant decrease in arterial blood pressure) and venodilation (evident by a significant decrease in central venous pressure) induced by nitroprusside (Table 1), which diminishes inhibitory vagal afferent influence sent from the aortic arch and cardiopulmonary baroreceptors. This diminished inhibitory afferent discharges from the aortic arch and cardiopulmonary baroreceptors may exert a facilitation modification on the activities at the cardiac center (i.e., the nucleus ambiguus and/or dorsal vagal nucleus) and the vasomotor center (i.e., the rostral ventromedullar nucleus and/or ventromedial meulla) that relays the efferent signals to the heart and blood vessels. This observation seems to be supported by increases in both CBR-MAP and CBR-HR gains during nitroprusside infusion.
This study provides a couple of clinical relevant implications. First, vasodilator agent such as nitroprusside has not only the therapeutic influence of lowering arterial blood pressure, but also facilitatory modification on the carotid baroreceptor activity via improvement of mechanic transmission as a result of relaxation of vascular smooth muscle. Second, unloading of the aortic arch and cardiopulmonary baroreceptors by reduction of central blood volume, i.e., CVP and venous return may further potentiate the carotid baroreflex function during nitroprusside infusion. However, the implications derived from the present study are only limited to young adults without cardiovascular or neurological complication.
In conclusion, the present study proposes a model of using re-parameterization for the estimates and standard errors for maximum gain and saturation. The proposed method makes it easy for more statistical inference on these quantities. By using the SAS code provided, we found that it is easy to apply this method. Our data suggest that nitroprusside infusion can significantly enhance the carotid baroreflex function in young healthy adults. Our data made us understand better about the function of nitroprusside, and suggested that further studies, such for elderly subjects and hypertensive patients, may be needed.
REFERENCES
- B. B. Kent, J. W. Drane, B. Blumenstein B and J. W. Manning, “A Mathematical Model to Assess Changes in the Baroreceptor Reflex,” Cardiology, Vol. 57, No. 5, 1972, pp. 295-310. doi:10.1159/000169528
- J. A. Pawelczyk and P. B. Raven, “Reductions in Central Venous Pressure Improve Carotid Baroreflex Responses in Conscious Men,” American Journal of Physiology, Vol. 257, No. 5, 1989, pp. H1389-H1395.
- J. T. Potts, X. Shi and P. B. Raven, “Cardiopulmonary Baroreceptors Modulate Carotid Baroreflex Control of Heart Rate during Dynamic Exercise in Humans,” American Journal of Physiology, Vol. 268, No. 4, 1995, pp. H1567-H1576.
- J. T. Potts, X. Shi and P. B. Raven, “Carotid Baroreflex Responsiveness during Dynamic Exercise in Humans,” American Journal of Physiology, Vol. 265, No. 6, 1993, pp. H1928-H1938.
- X. Shi, B. H. Foresman and P. B. Raven, “Interaction of Central Venous Pressure, Intramuscular Pressure, and Carotid Baroreflex Function,” American Journal of Physiology, Vol. 272, No. 3, 1997, pp. H1359-H1363.
- X. Shi, J. T. Potts, B. H. Foresman and P. B. Raven, “Carotid Baroreflex Responsiveness to Lower Body Positive Pressure-Induced Increases in Central Venous Pressure,” American Journal of Physiology, Vol. 265, No. 3, 1993, pp. H918-H922.
- X. Shi, F. A. Schaller, N. Tierney, P. Chanthavong, S. Chen, P. B. Raven and M. L. Smith, “Physically Active Lifestyle Enhances Vagal-Cardiac Function but Not Central Autonomic Neural Interaction in Elderly Humans,” Experimental Biology and Medicine (Maywood), Vol. 233, 2008, pp. 209-218. doi:10.3181/0704-RM-106
- “Uniform Requirements for Manuscripts Submitted to Biomedical Journals: Writing and Editing for Biomedical Publication,” International Committee of Medical Journal Editors. http://www.icmje.org/urm_full.pdf.
- D. Moher, K. F. Schulz and D. G. Altman, “The CONSORT Statement: Revised Recommendations for Improving the Quality of Reports of Parallel-Group Randomized Trials,” The Lancet, Vol. 357, No. 9263, 2001, pp. 1191-1194. doi:10.1016/S0140-6736(00)04337-3
- D. L. Eckberg, M. S. Cavanaugh, A. L. Mark and F. M. Abboud, “A Simplified Neck Suction Device for Activation of Carotid Baroreceptors,” Journal of Laboratory and Clinical Medicine, Vol. 85, No. 1, 1975, pp. 167-173.
- H. I. Chen and K. C. Chang, “Assessment of Threshold and Saturation Pressure in the Baroreflex Function Curve: A New Mathematical Analysis,” Japanese Journal of Physiology, Vol. 41, No. 6, 1991, pp. 861-877.
APPENDIX
Example SAS Code for Re-Parameterized Logistic Model
TITLE’ Reparameterization of logistic model—Example (Group Data)’;
DATA LOGISTIC;
INPUT MAP ECSP;
CARDS;
92.9937 59.190
91.9459 71.927
90.3382 80.344
88.3940 89.876
86.9402 104.823
86.0242 119.136
86.0451 134.356
86.2943 147.957
;
ods output CorrB = correlat;
ods output ParameterEstimates = estimate;
PROC NLIN DATA = LOGISTIC;
MODEL MAP = MG*OP/(1 + exp(4*(ECSP – A3)/OP)) + A4;
PARMS MG = 0.21 OP = 36 A3 = 83 A4 = 86;
run;
DATA OPA3;
SET CORRELAT;
IND = 1;
IF PARAMETER = ‘OP’;
RENAME A3 = R_OP_A3;
DROP MG OP A4;
DATA EST0;
SET ESTIMATE;
ORDER = Obs;
DATA EST1;
SET ESTIMATE;
IND = 1;
IF Parameter = ‘OP’;
RENAME Estimate = OP;
RENAME StdErr = OP_SE;
DATA EST2;
SET ESTIMATE;
IND = 1;
IF Parameter = ‘A3’;
RENAME Estimate = A3;
RENAME StdErr = A3_SE;
DATA THRES;
MERGE OPA3 EST1 EST2;
BY IND;
Parameter = ‘Th’;
Estimate = –OP/2 + A3;
StdErr = SQRT(OP_SE**2/4 + A3_SE**2 – OP_SE*A3_SE*R_OP_A3 );
LowerCL = Estimate – 1.96* StdErr;
UpperCL = Estimate + 1.96* StdErr;
ORDER = 6;
DATA SATUR;
MERGE OPA3 EST1 EST2;
BY IND;
Parameter = ‘SA’;
Estimate = OP/2 + A3;
StdErr = SQRT( OP_SE**2/4 + A3_SE**2 + OP_SE*A3_SE*R_OP_A3 );
LowerCL = Estimate – 1.96* StdErr;
UpperCL = Estimate + 1.96* StdErr;
ORDER = 5;
DATA OUTPUT;
MERGE EST0 THRES SATUR;
BY ORDER;
PROC PRINT;
VAR Parameter Estimate StdErr LowerCL UpperCL;
RUN;