Journal of Geographic Information System
Vol.07 No.05(2015), Article ID:60832,9 pages
10.4236/jgis.2015.75043
Evaluating the Role of Shelterbelt in Vegetation Development in a Semi Arid Zone of Yobe State, Nigeria
Bulus Luka Gadiga1, Yakubu Dan2
1Department of Geography, Adamawa State University, Mubi, Nigeria
2Department of Geography, Gombe State University, Gombe, Nigeria
Email: bulga_mi@yahoo.com
Copyright © 2015 by authors and Scientific Research Publishing Inc.
This work is licensed under the Creative Commons Attribution International License (CC BY).
http://creativecommons.org/licenses/by/4.0/


Received 15 August 2015; accepted 27 October 2015; published 30 October 2015
ABSTRACT
This study evaluates the role of shelterbelts on the development and dynamics of vegetation in relation to livelihoods in the study area using geo-information techniques. The study covered the period between 1972 and 2007. The results show that in 1972 vegetation cover in the study area extended over an area of 6955 hectares (i.e. shrubs, grasses and trees) which represents 65% of the area; however there was a decrease in 1986 to an area of 5779 hectares (54%). Despite the establishment of shelterbelt in the area in 1987, the trend did not change. This is obvious in the reduction of vegetation cover between 1986 and 2000 to a total area of 3893 hectares (37%). The vegetation cover further decreased to 2791 hectares (26%) in 2005 and 1659 hectares (16%) in 2007 respectively. The study concludes that the establishment of shelterbelts alone cannot guarantee the success of vegetation cover development in the area without a sustainable plan which recognizes the local communities as critical stakeholders. Thus, variables like population growth and GDP have a role to play in vegetation cover depletion. The study recommends that efforts geared towards enlightenment of the local communities on the need for conservation should be encouraged by Government and Non-Governmental Organisations.
Keywords:
Desertification, Shelterbelts, Vegetation Cover, Vegetation Dynamics, Arid Land

1. Introduction
Desertification is a major threat to the socio-economic development of areas in the arid environment. This is due to the negative ecological impact; it has the ecosystem on which majority of the people living in such areas depended for their livelihood. Desertification, as defined in Chapter 12 (Agenda 21) of Rio declaration on environment and development “is the degradation of the land in arid, semi-arid and sub-humid dry areas resulting from various factors, including climatic variations and human activities” [1] . It reduces the ability of land to support many life forms, limiting biodiversity and constraining socio-economic activities and development. It also stimulates accelerated soil erosion and deposition particularly by wind. Open land with little or no vegetal cover in an arid environment is highly vulnerable to both wind and water erosion [2] . The bare, un-vegetated soils are heated up due to hot and dry condition especially during the dry season, resulting in soil baking. With high evaporation rates, the soils are easily detached and blown or swept away by agents of erosion. In the absence of vegetation, rain water is mainly disposed as runoff as infiltration is minimal. This further constrains the growth and productivity of plants. Even long-lived plants: trees, shrubs and other perennials that would normally survive droughts eventually find survival an insurmountable challenge. The reduction in vegetation cover will finally give way to soil erosion thereby resulting in loss of soil fertility which will lead to further drop in plant productivity [3] . Apart from reduction in plant productivity, other consequences of vegetation depletion are the increase in flash floods, land/mud slide and further degradation of the ecosystem. Vegetation degradation in arid environment is one of the major factors that contribute in the formation of desert conditions. Therefore once this condition is formed, it creates a vicious cycle of continuous degradation. Hence the need to check such degradation of vegetation cover at its infancy before it becomes more difficult to tackle and to restore the environment to a habitable state.
Desertification and drought which are twin ecological problems that affect the livelihood of people living in the arid region of the world are also accompanied by reduction in the natural potential of the land and depletion in surface and ground-water resources. Desertification not only is a feature of natural deserts, but also takes place on land which is exposed to persistent drought and human pressure. In West Africa and particularly in Nigeria, food insecurity associated with desertification is mounting [4] . This is causing significant socio-economic challenges including mass movement of people from arid environment and reduced supply of food as well as disruption in the economic and social activities of people living in semi-arid environment (National Action Plan) [5] .
The need to protect agricultural lands by reducing the adverse effects of desiccating winds in the arid region of Nigeria is an urgent issue, although concerns about this can be traced back to the period described in Stebbing’s report of 1935 [6] [7] . According to that report, the climate of the areas immediately south of the Sahara was becoming drier. Consequently, in order to tackle the problems of desertification, government and international organizations have embarked on various shelterbelt projects in the areas where desertification was identified as a threat.
Increasing agricultural intensity and livestock populations, combined with upsurge in demands for fuelwood in arid and semi-arid region of Nigeria have limited the success of shelterbelt programmes [4] . Cultural practices are strong factors of vegetation decrease. One such practice which is of course also economic is the keeping of large numbers of livestock. The populations of livestock are high generally exceeding the carrying capacity of the land in the arid regions of Northern Nigeria [8] .
Shelterbelts are significant tools for restoring degraded areas particularly those under threat by desertification [9] [10] . They have the potential to improve the microclimate of the area where they are located, raise soil moisture and organic matter, and reduce the effect of desiccating winds by breaking wind speed. Because of their relevance as an ecological tool, government and non-governmental organizations have invested huge resources in their establishment and maintenance to check desert encroachment in Northern Nigeria. However, very few successes have been reported in terms of their survival and impact on the environment. Part of the problem is a poor knowledge on the functioning of shelterbelts in the area owing to the limited capacity for monitoring their performances. The present study attempts to analyze the influence of shelterbelts on the dynamics of vegetation in an arid environment using geo-information techniques.
2. The Study Area
This study was conducted in Yobe State which is one of the highly vulnerable States threatened by desertification. It is a place where huge investment had been expended on shelterbelt projects in order to check the menace of desert encroachment in the area. The selected shelterbelt is located between latitude 12˚58'N and 13˚07'N, and longitude 10˚12'E and 10˚17'E (Figure 1) in Garanda district of Machina Local Government Area of the State. It

Figure 1. The study area.
is located. It is part of the Sahelian region of Nigeria where desertification is threatening the ecology and livelihood of the inhabitants of the area [11] -[13] . Yobe State like other parts of the Sahel savannah has clearly defined wet and dry season largely determined by the properties and movement of the Inter-Tropical Convergence Zone (ITCZ).
The movement of the ITCZ controls the durations and amounts of rainfall received in most parts of West Africa including the study area. The state in general receives between 250 - 500 mm of rainfall in the northern parts lasting for three months and up to 1000 mm in the southern parts spread over 3 to 6 months [13] . Since the last century, there have been more frequent droughts than what historical records indicate. Notable events are the droughts of 1913-14, 1931-32, 1942-43, 1972-73, and 1983-84 [14] . This trend has contributed to the near disappearance of the Lake Chad (e.g. [15] ). The northern parts of Nigeria suffered remarkable drought conditions in the first and second decades of the 19th Century so much so that the Sahara desert expanded significantly into large areas of the Sudan. That trend had continued into most part of the 19th Century [15] . The region received some of its lowest rainfall in 1973 when it had less than 40 per cent of its mean annual rainfall [16] .
The predominant occupation of the people in the area is farming and they engaged in cultivation of crops and rearing of animals. The major crops cultivated in area are millet and beans while the animals reared include cattle, sheep and goats. The activities of the people are directly tied to the land and environmental conditions of the area. Any change in the environmental condition of the area invariably affects the economic activities of the populace.
3. Material and Methods
Data used for this research came from diverse sources. Data on population and GDP were sourced from the World Bank national account data and United Nations statistics division through Index Mundi website (http://www.indexmundi.com/facts/nigeria/gdp-per-capita, http://www.indexmundi.com/facts/nigeria/population).
Satellite imageries were used to generate basic data on the vegetation cover as well as other land uses. The images used for this study are described in the subsections below.
3.1. Satellite Imagery
A variety of remotely sensed images of the site were acquired for the study. These include Landsat MSS (1972), Landsat TM (1986), Landsat ETM+ (2000 and 2005) and ASTER (2007). The images were so selected in part because they were taken in the same season of the year. This was to remove the effect of seasonal variation in vegetation cover (e.g. [17] ). Phenology difference in particular is controlled for in this way [18] -[20] .
The Landsat MSS of 1972 and Landsat TM of 1986 were acquired from Global Land Cover Facility while Landsat ETM+ of 2000 and 2005 were acquired from EROS. The ASTER image was acquired through ITC Netherlands.
3.2. Image Processing and Corrections
Digital image processing was carried out on the extracted area of interest to correct for geometric and radiometric errors in the data. The images were registered to each other using “resampling method” and “dark object subtraction” model of atmospheric correction was used for correction.
Image enhancement was performed on the images in order to improve their interpretability. Colour composite and linear stretch methods of image enhancement were also performed on the various images that were used in the classification. Thus, the bands of Landsat MSS of 1972 used for colour composite are bands 3-2-1. This means that on the RGB colour space, band 3 was on Red, band 2 on Green and band 1 on Blue. This combination produces a False Colour Composite (FCC) image with vegetation appearing as red. As energy in the near infrared region of the electromagnetic spectrum is not used in photosynthesis, vegetation reflects high values in this band depending on the amount of chlorophyll present in the plant.
The bands used for colour composite of Landsat TM of 1986 unlike Landsat MSS with only 4 bands and without a band in the blue region of the electromagnetic spectrum, are bands 4-3-2. Landsat TM has seven (7) bands and the bands are divided as follows; three bands in the visible spectrum (bands 1, 2, and 3), one in the Near-infrared (band 4), two in Mid-infrared (bands 5 and 7) and one in Thermal-infrared (band 6). The same combination of Landsat TM was used on Landsat ETM+ (4-3-2) bands because both sensors have their bands located in the same region of the electromagnetic spectrum except band 8 which is a panchromatic image covering the entire visible region. On the ASTER image, false colour composite was achieved with band 3 on Red, band 2 on Green and band 1 on Blue.
3.3. Image Classification
The “Supervised” classification procedure using Maximum Likelihood algorithm was produced with ERDAS IMAGINE (version 9.2) and visualization was done with ArcGIS (version 9.3) software. Ground truthing was carried out around the shelterbelt site in order to develop image-ground concordance. This yielded land cover maps (Figures 3-7) of the study area for different dates. Post classification method [17] [18] of change detection was used in analyzing the result from the land cover maps. The choice of post classification method of change detection for this study is due to its usefulness in determining possible factors responsible for vegetation change. Another reason for its usage in this study is in line with the suggestions by [18] [21] that when two dates of imagery are separately classified, it minimizes the problem of radiometric calibration between the dates. The procedure adopted for the change detection is presented in Figure 2.
4. Results and Discussions
4.1. Vegetation Dynamics
The results of change detection analysis for the shelterbelt site are presented in Table 1. The analysis shows that the natural vegetation of the area has been converted to other uses mainly to farmlands. In 1972 vegetation in the study area covers an area of 6955 hectares (i.e. shrubs, grasses and trees) which represents 65% and this decreased in 1986 to an area of 5779 hectares (54%). Despite reported increase in rainfall in the year 2000 [6] , the area covered by vegetation has reduced noticeably between 1986 and 2000 to a total area of 3893 hectares (37%). The area covered by vegetation further decreased to 2791 (26%) and 1659 (16%) hectares in 2005 and 2007 respectively.
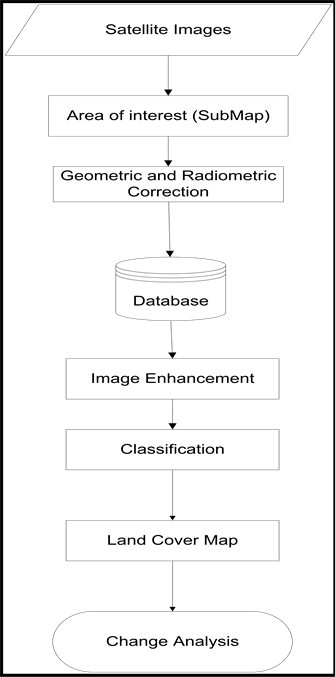
Figure 2. Flow chart of change detection.
Figures 3-7 show the maps of land cover for the area. It is obvious from the results that anthropic factors rather than the establishment of shelterbelts have more influence on the observed vegetation dynamics in the study area. This is evident in the rate at which areas covered by vegetation were shrinking and giving way to other uses. The post classification results from the area show that vegetation cover in the area is decreasing mainly due to expansion of farmland. Despite the establishment of shelterbelt in the area in 1986, vegetation cover has continued to decrease. This cannot be unconnected with the increase in demand for food and other natural resources to sustain the growing human population in the area, which have contributed to vegetation depletion. The high conversion rates of vegetation to other land uses have overshadowed the salient restorative influence of shelterbelts on vegetation development. Shelterbelts are known to provide “safe sites” by sheltering areas on their lee ward side from vagaries of desert condition to a distance of about 10 - 15 times the height of the trees in the belt. The local people in the vicinity of the shelterbelt took advantage of this “safe sites” provided by the trees. They reported that the sheltered side provides conditions for higher yield than areas further away from the shelterbelt [22] . Those “safe sites” provided by the shelterbelt were the areas that suppose to have aided the natural development of vegetation. But due to pressure from human activities (especially, farming and grazing) has resulted in the continuous depletion of vegetation in the area. This was compounded by the difficult environmental conditions in the area. For vegetation to thrive in semi-arid conditions a great deal of efforts in providing water and fencing materials were required, because of the long dry season, which lasts between six and nine months. During this period a lot of pressure comes from domestic animals, which virtually do not allow any green plants especially seedlings that are not poisonous to survive. That is why grass-root participation in any afforestation project in such an environment is important.

Table 1. Classification results of the study area between 1972 and 2007.
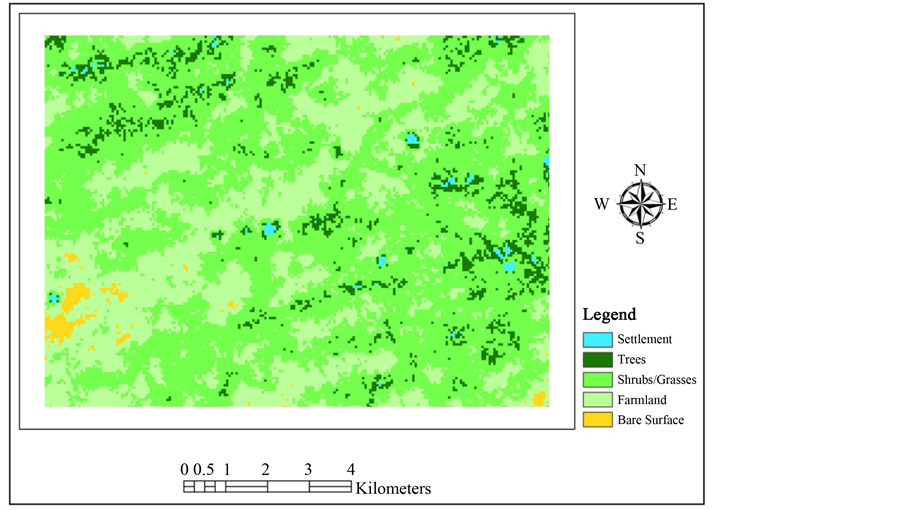
Figure 3. Land cover map in 1973.
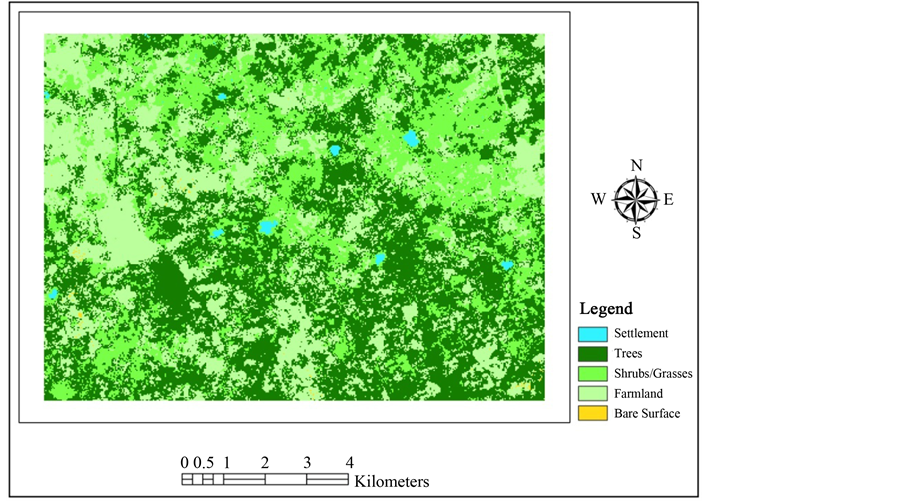
Figure 4. Land cover map in 1986.
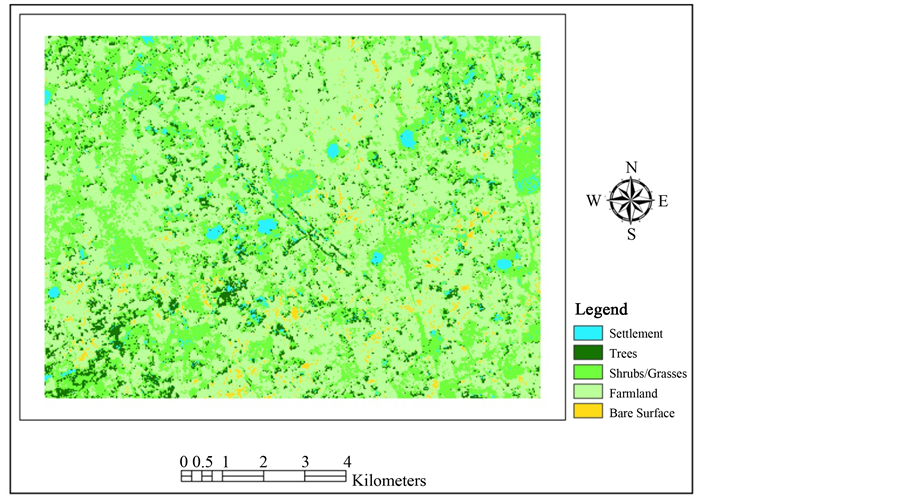
Figure 5. Land cover map in 2000.
4.2. The Influence of Population and GDP on Vegetation Depletion
Figure 8 generally shows that the population of Nigeria has witnessed a steady growth over the years. The population was 60,191,510 in 1972, 88,057,490 in 1986, 123,688,500 in 2000, 139,823,300 in 2005 and increased to 146,951,500 in 2007. This growth in population has resulted in vegetation depletion in the country as reported by [23] . Vegetation depletion especially in the arid environment affects the ecosystem thereby resulting to desertification. Such condition creates a vicious cycle of continuous degradation which has negative effects on lives of the people residing in the area. The country’s GDP per capita has not shown any significant improvement considering the rate of population growth (Figure 8). The standard of living of the people depends

Figure 6. Land cover map in 2005.
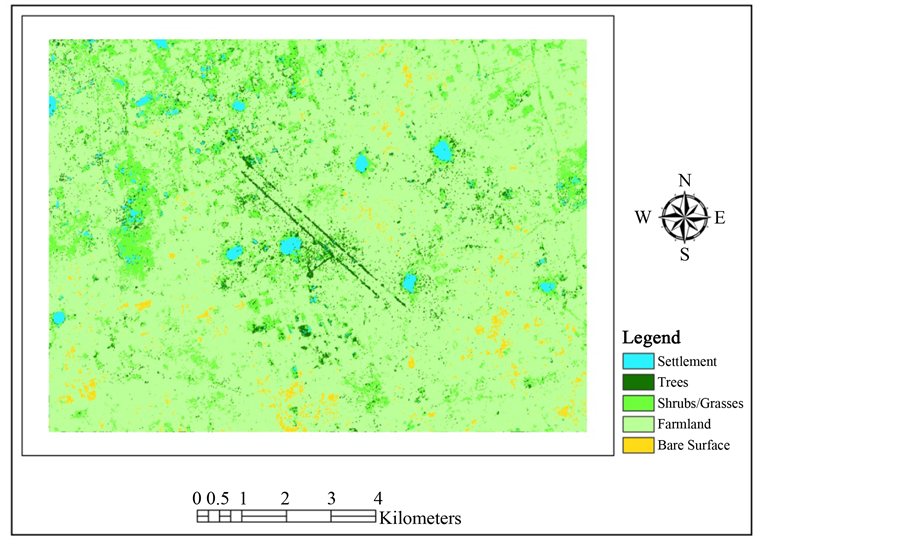
Figure 7. Land cover map in 2007.
on the GDP. And once a country has low productivity (GDP), it will consequently affect the standard of living of the populace which leads to more dependence on land resources. This implies more increase in vegetation degradation thereby sustaining a vicious cycle of poverty. The situation prevailing in the study area has weakened the capability of the people to overcome the existing challenges thus making them more vulnerable to the effect of desertification.
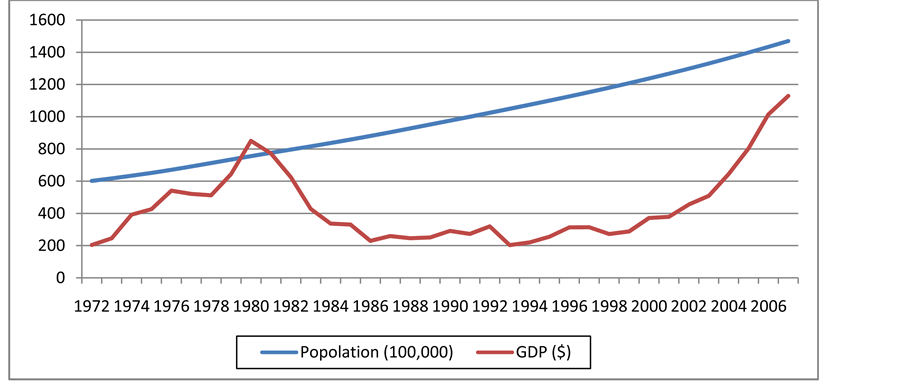
Figure 8. Nigerian mid-year population and GDP per capita (source: World Bank national accounts data and United Nations population division).
5. Conclusions
Shelterbelts if properly managed are vital tool in the fight against desertification. They provide social, economic as well as ecological benefits to people living in their vicinity. These benefits cannot be properly harnessed without sustainable management of the vegetal resources. The study showed that there was steady decrease in vegetation cover of the area in spite of shelterbelt establishment. This can be attributed to increasing pressure from human activities. The major driver of change in the area as revealed by the study was farming activity. This suggests that for any shelterbelt to achieve its objective of restoring the ecological integrity of such an arid environment, efforts must be put in place to restrict exploitation of land resources among others in areas where shelterbelts are established.
The establishment of shelterbelts alone cannot guarantee the success of natural vegetation cover restoration without the involvement of the communities located close to the project sites. Therefore the study recommends that efforts geared towards enlightenment of the local communities on the need for conservation should be encouraged by Government and Non-Governmental Organisations.
Cite this paper
Bulus LukaGadiga,YakubuDan, (2015) Evaluating the Role of Shelterbelt in Vegetation Development in a Semi Arid Zone of Yobe State, Nigeria. Journal of Geographic Information System,07,541-550. doi: 10.4236/jgis.2015.75043
References
- 1. UNICED (1992) Managing Fragile Ecosystems: Combating Desertification and Drought. UN Conference on Environment and Development (Earth Summit), Rio de Janeiro, 3-14 June 1992.
- 2. Cao, Y., Ouyang, Z.Y., Zheng, H., Huang, Z.G., Wang, X.K. and Miao, H. (2008) Effects of Forest Plantations on Rainfall Redistribution and Erosion in the Red Soil Region of Southern China. Land Degradation & Development, 19, 321-330. http://dx.doi.org/10.1002/ldr.812
- 3. Adesina, F.A. (2008) Living in a Severely Altered World. Inaugural Lecture, Obafemi Awolowo University, Ile-Ife, 28 October 2008.
- 4. UNEP (2008) Africa: Atlas of Our Changing Environment. Division of Early Warning and Assessment (DEWA), United Nations Environment Programme (UNEP), Nairobi.
- 5. NAP (2007) Combating Desertification and Mitigating the Effects of Drought in Nigeria. UNCCD, Federal Ministry of Environment, Nigeria.
- 6. Stebbing, E.P. (1935) The Encroaching Desert: The Threat to the West African Colonies. Geographical Journal, 85, 506-524. http://dx.doi.org/10.2307/1785870
- 7. Ojo, G.O.A., Onyewotu, L.O.Z. and Ujah, J.E. (1987) Use and Management of Shelterbelts. In: Sagua, et al., Eds., Ecological Disasters in Nigeria: Drought and Desertification. Proceeding of the National Workshop of FAN, Kano, 9-12 December 1985.
- 8. Mortimore, M. (1983) Livestock Production. In: Oguntoyinbo, J.S., Areola, O.O. and Filani, M., Eds., A Geography of Nigerian Development, 2nd Edition, Heinemann Educational Books, Ibadan.
- 9. Igugu, G.O. and Osemeobo, G.J. (1991) Strategies for Facilitating Shelterbelt Establishment in Nigeria. In: Dada, G.O.B. and Obiaga, P.C., Eds., Development and Management of Forest Resources of the Arid Zone of Nigeria. Proceeding of the 20th Annual Conference of FAN, Katsina, 25-30 November 1990, 198-205.
- 10. Odigie, G.A. and Obiaga, P.C. (1991) Afforestation Strategy for Drought and Desertification Control in Nigeria. In: Dada, G.O.B. and Obiaga, P.C., Eds., Development and Management of Forest Resources of the Arid Zone of Nigeria. Proceeding of the 20th Annual Conference of FAN, Katsina, 25-30 November 1990, 262-269.
- 11. UNESCO (2000) Combating Desertification: Freshwater Resources and the Rehabilitation of Degraded Areas and Drylands. UNESCO-MAB Drylands Series, No 1.
http://unesdoc.unesco.org/images/0012/001276/127651e.pdf - 12. UNDP (2009) Climate Change in African Drylands: Adaptive Livelihood Options. UNDP-UNEP-UNCCD Papers, May 2009. www.undp.org/drylands
- 13. Oruonye, E.D. (2009) Geographical Aspects of Yobe State, Nigeria. Fab Education Books, Jos.
- 14. Odekunle, T.O., Andrew, O. and Aremu, S.O. (2008) Towards a Wetter Sudano-Sahelian Ecological Zone in Twenty-First Century Nigeria. Weather, 63, 66-70.
- 15. Dami, A. (2008) Geographic Information System Based Predictive Study of Environmental Change in the Nigeria’s Section of the Chad Basin. PhD Thesis, Obafemi Awolowo University, Ile-Ife.
- 16. Oguntoyinbo, J.S. (1983) Climate. In: Oguntoyinbo, J.S., Areola, O.O. and Filani, M.A., Eds., Geography of Nigerian Development, 2nd Edition, Heinemann Educational Books, Ibadan, 45-70.
- 17. Pu, R., Gong, P., Tian, Y., Miao, X., Carruthers, R.I. and Anderson, G.L. (2008) Using Classification and NDVI Differencing Methods for Monitoring Sparse Vegetation Coverage: A Case Study of Saltcedar in Nevada, USA. International Journal of Remote Sensing, 29, 3987-4011.
http://dx.doi.org/10.1080/01431160801908095 - 18. Lu, D., Mausel, P., Brondízio, E. and Moran, E. (2004) Change Detection Techniques. International Journal of Remote Sensing, 25, 2365-2401. http://dx.doi.org/10.1080/0143116031000139863
- 19. Mas, J.F. (1999) Monitoring Land-Cover Changes: A Comparison of Change Detection Techniques. International Journal of Remote Sensing, 20, 139-152. http://dx.doi.org/10.1080/014311699213659
- 20. Singh, A. (1989) Digital Change Detection Techniques Using Remotely-Sensed Data. International Journal of Remote Sensing, 10, 989-1003. http://dx.doi.org/10.1080/01431168908903939
- 21. Coppin, P., Jonckheere, I., Nackaerts, K., Muys, B. and Lambin, E. (2004) Digital Change Detection Methods in Ecosystem Monitoring: A Review. International Journal of Remote Sensing, 25, 1565-1596. http://dx.doi.org/10.1080/0143116031000101675
- 22. Gadiga, B.L. (2012) The Functioning of Shelterbelts in Soil and Floristic Restoration in the Sudano-Sahelian Region of Yobe State. PhD Thesis, Obafemi Awolowo University, Ile-Ife.
- 23. FAO (2005) Assessment of the National Forest Programmes in Nigeria.
http://www.fao.org/DOCREP/005/AC918E/AC918E02.htm