Engineering
Vol.10 No.08(2018), Article ID:86683,30 pages
10.4236/eng.2018.108039
Effect of Inoculation on Phase Formation and Indentation Hardness Behaviour of Zr47.5Cu45.5Al5Co2 and Zr65Cu15Al10Ni10 Bulk Metallic Glass Matrix Composites
Muhammad Musaddique Ali Rafique
Eastern Engineering Solutions LLC, Detroit, MI, USA

Copyright © 2018 by authors and Scientific Research Publishing Inc.
This work is licensed under the Creative Commons Attribution International License (CC BY 4.0).
http://creativecommons.org/licenses/by/4.0/


Received: July 7, 2018; Accepted: August 13, 2018; Published: August 16, 2018
ABSTRACT
Bulk metallic glass matrix composites have emerged as a new potential material for structural engineering applications owing to their superior strength, hardness and high elastic strain limit. However, their behaviour is dubious. They manifest brittleness and inferior ductility which limit their applications. Various methods have been proposed to overcome this problem. Out of these, introduction of foreign particles (inoculants) during solidification has been proposed as the most effective. In this study, an effort has been made to delimit this drawback. A systematic tale has been presented which explains the evolution of microstructure in Zr47.5Cu45.5Al5Co2 and Zr65Cu15Al10Ni10 bulk metallic glass matrix composites with varying percentage of ZrC inoculant as analysed by secondary electron, back scatter electron imaging of “as cast” unetched samples and indentation microhardness testing. Secondary electron imaging of indents was also performed which shows development of shear transformation zones at edges of square of indents. Mostly, no cracking was observed, few cracks bearing Palmqvist morphology were witnessed in samples containing lower percentage of inoculant. A support is provided to hypothesis that inoculations remain successful in promoting phase formation and crystallinity and improving toughness.
Keywords:
Inoculation, Crystallinity, Phase Formation, Toughness

1. Introduction
Bulk metallic glass matrix composites [1] [2] [3] have emerged as a potential material of future [4] bearing superior properties of strength [5], hardness [6] [7] [8] [9] [10] and elastic strain limit [11] [12] [13] which place them in an unique position in structural material family [14] [15]. Various applications have been proposed which make use of their superior properties [13]. These include, targets of high speed moving projectiles [16] (such as wipple shield of international space station [11] [17] [18]), drill bits, parts of earth moving machinery [19], shape memory alloys [20] [21], and parts in cryogenic applications (such as gears of outer and deep space missions) [22] [23] [24]. Various studies have been reported which shed light on different aspects of their manufacturing [12] [25] [26] and microstructural development [27] [28] [29] [30]. These include observations under abrasion corrected transmission electron microscopy [31], synchrotron light [32] [33] [34] [35] and in-situ studies [36] [37] [38] [39] but none have been made on the detailed use of more recent and advanced electron back scattered diffraction. Only three notable studies have been recently reported [40] [41] [42] but they are only qualitative and are limited by mere generalised phase identification. This is a new and unique technique which has been reported as complimentary to transmission electron microscopy [43] [44]. It has unique ability to identify [45] and map crystallinity in materials [46] [47] [48] [49]. It not only can generate diffraction patterns (kikuchi lines) but can efficiency map and compare presence of different phases (of distinct crystal structure) [50] in a bulk of material with existing crystal structures in international crystallographic diffraction database. This is a very good aspect which can be used efficiency to determine different properties of material [49] [51]. With the help of energy dispersive X-ray spectroscopy (EDS) detector, it can also generate map of crystal structure of individual elements which can help identify their nature and microstructural features (e.g. primary, secondary and tertiary dendrite arm spacing) [43] [52]. It also generates pole figures and grain size histograms which again can be used to determine mechanical properties of material. In present study, which is part one of two-part study, author aims to bridge this gap. A detailed secondary electron and back scatter electron imaging study of as cast inoculated wedge shape samples at three positions of wedge (tip, middle and widest portion), and secondary electron imaging study of indents produced by microhardness testing is carried out whose results are presented. Emphasis is laid on explaining phase formation, evolution and plasticity of as cast inoculated Zr based bulk metallic glass matrix composites. These studies are aimed at explaining and understanding phenomena of nucleation and growth in these alloys as a function of percentage of inoculant and cooling rate while later varies with change of point of observation along wedge [11]. This is first of its kind of study in this field which make use of carefully selected inoculants [53] [54] to promote crystallinity, phase formation and increase toughness.
2. Experimental Procedure
Metallographic sample preparation: Two types of Zr based bulk metallic glass matrix composites namely Zr47.5Cu45.5Al5Co2 and Zr65Cu15Al10Ni10 are produced by vacuum arc melting button furnace and suction casting. These are subsequently cut by Struers abrasive cut off wheel with coolant flow. Then they are mounted in 25 grams Stycast epoxy resin with 25 grams Buehler conductive filler. Mounts are cured at room temperature for 8 hours. Once cured, they are placed in Thermolyne Type 48,000 furnace at 50˚C for 2 hours to harden final epoxy. Cured mounts were subsequently subjected to grinding and polishing. Grinding was done using silicon carbide papers. Manual grinding was done starting with papers of 120 to 240 grit with about 20 - 30 seconds on each grit. After this grinding was done on 400, 600, 800 and 1200 grit papers and then, polishing was performed. It was done using 9 µm, 3 µm and 1 µm Diamond Duo polishing solution using a Struers automatic rotating disc polisher for 5 minutes on each grit.“Plan” wheel was used for 9 µm polishing, “Dac” wheel for 3 µm polishing, and “Nap” wheel for 1 µm polishing. Final polishing was done by employing 0.04 µm colloidal silica solution for 5 minutes on “Chem” wheel. Secondary and back scatter electron microscopy: Secondary and back scatter electron microscopy of as cast inoculated samples was performed on Amray 1810 SEM. Microscope was equipped with Lanthanum Boride (LaB6) filament and operates at maximum cathode voltage of 30 KV. Sample was placed in chamber at a vacuum of 10−6 mbar created by diffusion pump connected to it. Secondary electron imaging was performed by collection of electrons at secondary electron (Everhart Thornley type) collecting detector. Back scatter electron imaging was carried out by manipulation of operating voltage and use of pseudo voltage controller. This voltage controller shifts the voltage such that deeper penetration is achieved, and scattered electrons give information about compositional contrast. Working distance was maintained at 25 mm. Indentation microhardness testing: Indentation hardness was performed on Shimadzu HMV—2T microhardness tester equipped with digital camera and operated via Computer Assisted Measurement System (C.A.M.S) software from Newage testing instruments. ASTM standard E384 was used for Vickers hardness testing while ASTM E140 was used for conversion and measurement of readings of test. Load applied was 500 grams for 15 seconds using diamond Vickers indenter. Impressions were manually read by adjusting cross wires and hardness values were obtained by computation of formula in software. After measuring hardness, indents were imaged using thermally assisted schottkey type field emission gun operated high vacuum FEI scanning electron microscope at Institute of Materials Science, University of Connecticut, Storrs.
3. Results and Discussion
3.1. Secondary Electron and Back Scatter Electron Imaging
Secondary electron and back scatter electron imaging [55] is carried out to determine phase formation and evolution with the change of percentage of inoculants. Images can be grouped into categories based on how the evolution is observed? Below, a detailed tale of their evolution is described in both type of model alloys (that is Zr47.5Cu45.5Al5Co2 and Zr65Cu15Al10Ni10). Emphasis is laid on explaining type, and morphology (size and shape of CuZr B2 phase in Zr47.5Cu45.5Al5Co2, β-Zr and Cu2Zr [55] and Zr2Cu [56] in Zr65Cu15Al10Ni10). A little light is also shed on explaining topography of microstructures. A considerable change in microstructure is observed as depicted by increased percentage (volume fraction) of crystal phase evolving out of liquid in background of glassy matrix. A change in morphology (size and shape) is also observed which can be attributed to inoculation treatment (availability of predominant heterogenous nucleation sites, nucleation at them and growth), cooling rate (amount/quantity of heat extracted), rate of heat transfer, diffusion, point of observation and mode of imaging (secondary electron or back scatter electron). Distribution of phases in bulk volume is also an important parameter and effort is made to explain its importance as well. All these parameters are shown to bear importance in explaining the overall crystallinity and increased toughness in these metal matrix composites.
Zr47.5Cu45.5Al5Co2 Bulk Metallic Glass Matrix Composites
Although, six phases have been identified and reported in literature in this type of alloy, only two (namely simple cubic spheroidal CuZr B2 [57], and brittle Al2Zr fcc [27]) have been predominantly explored and will be reported here as well. Others have been reported to have similar or near similar structure to simple cubic, fcc or bcc but exist as off shoots of main features (spheroid or dendrite).
Evolution of microstructure (phase formation and development) is reported as a function of percentage of inoculant added. Secondary and back scatter electron imaging is performed on all samples in all three areas of sample (i.e. tip, middle and wider portion of wedge). It is hypothesized and observed experimentally that size, shape, morphology and count (number density and volume fraction) of phases changes with percentage of inoculant. With increasing percentage, a tendency of decrease in size (finer grain size) while increase in number density is observed and reported. This is due to availability of more nucleation sites and quick solidification rate which tends to fill up liquid space more rapidly. This is also in direct agreement with tendency of inoculants to provide sites of heterogeneous nucleation in parallel to homogeneous nucleation thus promoting nucleation and growth of primary phase precipitates.
Each figure is explained step by step below;
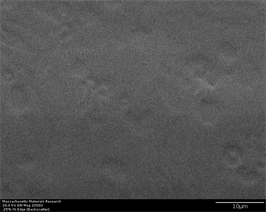
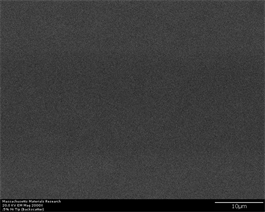
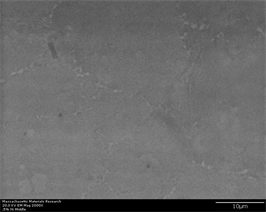
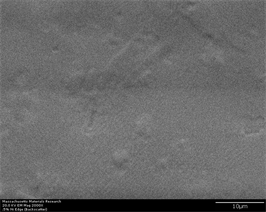
Figures 1(a)-(d) represents base alloy (native alloy) with zero percentage of inoculants. This is Zr47.5Cu45.5Al5Co2 alloy which is predominantly reported to carry CuZr B2 phase [27] [29] [31] [57] - [69]. This appears as spheroids nucleating from background of rapidly cooling glassy liquid. In secondary electron images, this can be observed as light regions while glassy matrix is appearing as dark grey areas present in all interdendritic space. Back scatter imaging (Figure 1(d)), generates images based on compositional contrast in which spheroids are imaged relative to glassy matrix based on how their compositional differ. This can easily be seen spread all across the volume of sample. At tip, almost no crystals appear because of presence of highest possible cooling rate there which suppresses kinetics while as we move away from tip to wider portion of wedge, an
 (a)
(a)
 (b)
(b)
 (c)
(c)
 (d)
(d)
Figure 1. (a)-(d): Zr47.5Cu45.5Al5Co2, inoculant = zero%.
increased percentage of crystallinity tends to appear. In this particular sample which does not have any percentage of inoculant, this phenomenon can be directly linked with cooling rate and rate of heat transfer. Crystals tends to get finer and smaller as area of interest move away from tip. Considerable percentage of crystals tends to appear at a point 2/3rd from tip and this prevails till widest portion.
As percentage of inoculant increase from zero to 0.25% (Figures 2(a)-(f)), crystallinity starts appearing in this alloy. This is depicted by observation of small crystals all throughout the volume of material. This is bench mark of central point of nucleation and growth observed in this alloy. Effect of inoculation shows its effect in the form of appearance of crystals even at tip where there is maximum cooling rate. These crystals have small size while they are uniformly distributed throughout the volume. Their small size is manifestation of high cooling rate observed in this region which suppresses growth. They tend to appear as spheroids and tend to adapt spheroid to plate like morphology with higher aspect ratio. Glass again tends to appear as continuous network in three dimensional interdendritic space. This network appears as dark areas in secondary electron images. As the area of interest moves away from tip to middle portion of wedge, a growth phenomenon is observed. Size of crystals tends to become large while their morphology tends to develop into sphere from spheroid (which is most widely reported morphology of this phase). A continuous long dendrite
 (a)
(a)
 (b)
(b)
 (c)
(c)
 (d)
(d)
 (e)
(e)
 (f)
(f)
Figure 2. (a)-(f): Zr47.5Cu45.5Al5Co2, inoculant = 0.25%.
is also observed on the left side of micrograph which is proposed to have fcc crystal structure [27] (as revealed by EBSD study described elsewhere). Further, as the area of interest moves towards the widest portion of wedge, more prominent growth of earlier nucleated crystals is observed. Size of crystals tends to become large while they tend to coalesce into a large mass with grains diffusing into each other. This is typical manifestation of growth phenomena observed in widest region of wedge. Back scatter image (Figure 2(f)) also shows same phenomena in terms of compositional contrast.
As the percentage of inoculant increases to 0.5% (Figure 3(a)-(f)), more prominent crystals tend to appear in all regions of wedge. First, it is manifested by well-developed spheroids which are larger in size as compared to crystals appearing in same region at 0.25% inoculant. Large size and well-developed
 (a)
(a)
 (b)
(b)
 (c)
(c)
 (d)
(d)
 (e)
(e)
 (f)
(f)
Figure 3. (a)-(f): Zr47.5Cu45.5Al5Co2, inoculant = 0.50%.
spheroidal morphology is due to proper diffusion and ample time allowed for growth to occur. As the area of interest moves away from tip, crystals are observed in the form of precipitates having well rounded spheroidal morphology. Size of crystals also gets large and at points they tend to diffuse into each other eliminating interdendritic space indicating grain boundary diffusion [70] [71]. Long dendrites which were observed at 0.25% have now developed in to well defined individual needle like crystals extending throughout volume of sample. They have different crystal structure than spheroidal B2 and have different hardness than B2. They are proposed to carry structure of Al2Zr and are prominently fcc in nature [27]. They are proposed to have been formed because of compositional variance which arises during solidification of multicomponent alloys. At same magnification, at widest portion of wedge, spheroids tend to appear in large size and needle like phase have been shown to grow into large size tree like shape. A drastic change in size of crystals is observed when percentage of inoculant increases to 0.75% (Figure 4(a)-(f)). Their size decreases in three regions of wedge whereas their amount (count/number density) increases. This trend has increasing inclination as area of interest moves from tip to wider portion of wedge. This partly can be attributed to two reasons; (a) increasing percentage of inoculant provide more nucleation sites thus increase their number density while (b) at the same time, it accelerates nucleation and growth process superimposed with high cooling rate exerted by wedge shape of casting. All these factors result in overall large number of fine size crystals. Yet another reason may be attributed to melting and casting practice itself. Alloys containing 0.75% and 1% inoculants are casted by another operator with different skill, melt
 (a)
(a)
 (b)
(b)
 (c)
(c)
 (d)
(d)
 (e)
(e)
 (f)
(f)
Figure 4. (a)-(f): Zr47.5Cu45.5Al5Co2, inoculant = 0.75%.
control, inoculation and casting practice on a different day. A master alloy of Copper and Zirconium was first developed which was subsequently mixed with weighed amount of other alloying elements in vacuum arc melting and suction casting button furnace. This may have exerted a different mixing and homogenization effect than previous set of alloys in which all elements were heterogeneously mixed with each other prior melting. It can also be seen that irregular shape B2 crystals appear in microstructure. It is evident again from microstructures that, insufficient mixing, homogenization and compositional adjustment is causing for evolution of improper microstructure. Size of crystals increase from approximately 1.5 µm to 3.5 µm wide to 7 µm long as point of observation moves from middle of wedge to widest portion of wedge. They are shown to possess high aspect ratio which again may be attributed to alloying, melting and casting practice. This same trend is carried in alloys with 1% inoculant (Figure 5(a)-(g)). However, a slightly better morphological evolution is witnessed as the percentage of inoculant is sufficient to trigger enough nucleation followed by growth. Once again, almost no crystallinity is witnessed as alloy is cooled abruptly in tip region of sample. However, as the area of interest moves away from tip, sufficient amount of small crystals starts appearing. These are manifested by change of contrast in secondary as well as back scatter electron images. A small impurity is also observed in the middle of sample imaged at widest portion of wedge. This impurity is also evident in case of back scatter images taken in same region at same magnification. However, its exact nature and crystal structure needs to be identified at higher magnification or with advanced crystallographic techniques such as transmission electron microscopy or electron back scatter diffraction which may identify and ascertain whether it is impurity or new phase having a unique crystal structure which is formed at the center of other well-defined crystal structure (such as cubic B2) and provide a site for heterogeneous nucleation because it is nucleated at foreign particle? Recently, a report has been published on a similar study in which another type of inoculant is shown to act as site for heterogeneous nucleation at the center of β-Ti grains in Ti based alloys [72]. Similar investigation on present alloys at lower magnification and at quick EBSD scans is conducted by author and described elsewhere. A trend of crystals to transform into more pronounced and profound spheroidal shape of cubic B2 phase can also be observed at widest portion of wedge. Size of crystals increase from approximately 2 µm to 5 µm as point of observation moves from middle of wedge to widest portion of wedge. Once again, this abnormality may be attributed to poor melting and casting practice and improper alloy adjustment and melt in homogenization.
3.2. Zr65Cu15Al10Ni10 Bulk Metallic Glass Matrix Composites
Second alloy which was investigated in present study is Zr65Cu15Al10Ni10 alloy. This is hypoeutectic type alloy which have more than 50% Zr. This is reported to have well defined β-Zr phase nucleating from liquid background which
 (a)
(a)
 (b)
(b)
 (c)
(c)
 (d)
(d)
 (e)
(e)
 (f)
(f)
 (g)
(g)
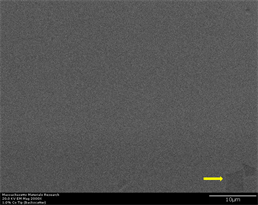
Figure 5. (a)-(g): Zr47.5Cu45.5Al5Co2, inoculant = 1.0%. (g) EDS point elemental analysis of a phase in 1% cobalt sample in a region close to tip (indicated by yellow arrow). Analysis clearly shows phase rich in Zirconium which may have been a region of segregation or unmelted inoculant itself (Hint: Inoculant has same crystal structure as that of major element in base alloy) [53] [54].
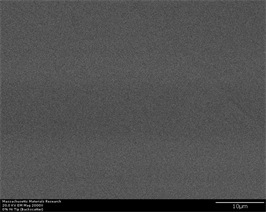
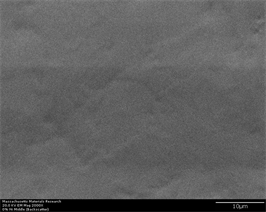
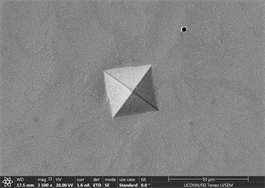
transforms to glass upon rapid cooling. Another phase which is reported to have been formed is Zr2Cu. This has tetragonal crystal structure and may have long plate like shape with high aspect ratio [56]. Figure 6(a)-(f) represents secondary electron and back scatter electron micrographs of this alloy without any inoculants. It can be easily observed that this alloy does not show any crystallinity at
 (a)
(a)
 (b)
(b)
 (c)
(c)
 (d)
(d)
 (e)
(e)
 (f)
(f)
Figure 6. (a)-(f): Zr65Cu15Al10Co10, inoculant = zero%.
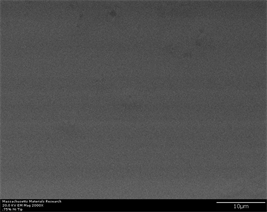
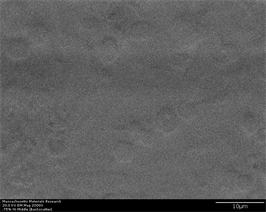
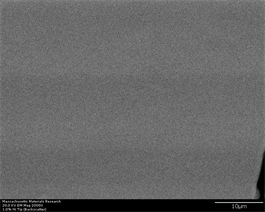
tip region. However, this trend changes as point of observation moves from tip to wider portion of sample. This is manifested by appearance of structural in homogeneity or disorder in alloys. This can be attributed to onset of crystallization. At a certain point, away from tip, certain type of precipitation starts happening. Since, β-Zr phase appearing in these alloys is reported to have plate like morphology, this appearance of structural disorder gives a measure that precipitation of this phase has just started from liquid. As we move further towards wider portion of sample, alloy tends to exhibit streaks of β-Zr phase in the background of liquid. These appear in the form of “river like” or “flower like” pattern which again is manifestation of precipitation and hence crystallinity. Once again, two more points having darker color are indicative of equiaxed grain formed exactly at the spot where there are inoculants. Same is observed in back scatter images and are clear manifestation that certain areas exist at which compositional contrast is maximum. This is another reinforcing evidence that inoculation is effective technique in improving the efficiency of grain refinement process.
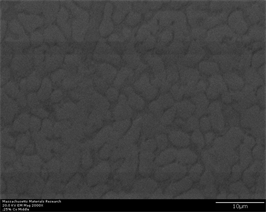
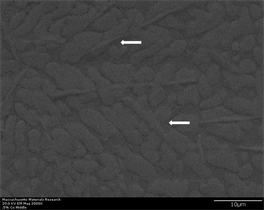
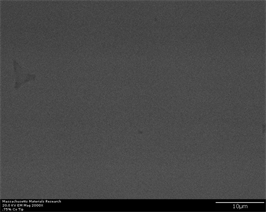
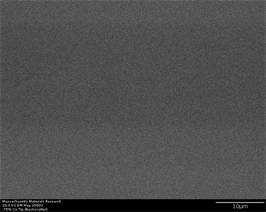
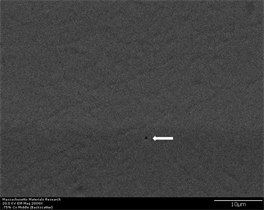
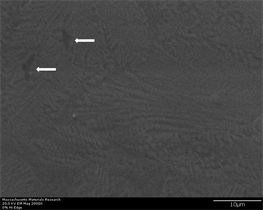
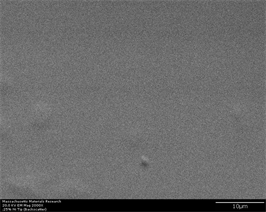
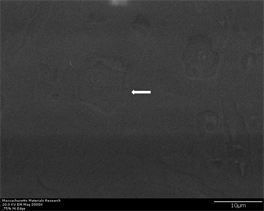
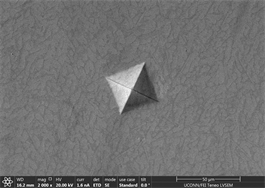
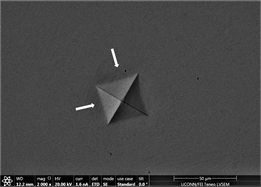
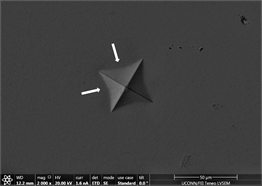
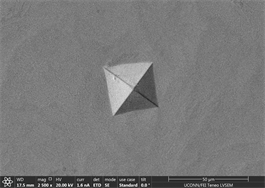
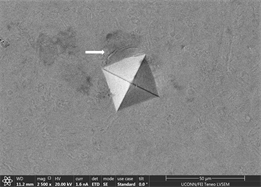
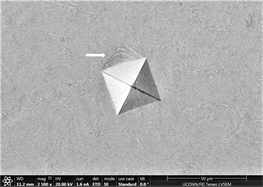
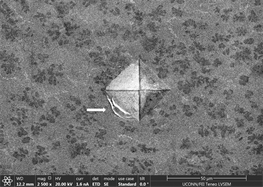
As percentage of inoculant increase from zero to 0.25%, a progressive trend of increase in number of crystals is observed in all three regions of casting (Figure 7(a)-(f)). Majority of portion at tip region of casting consists of monolithic (100%) glass. Only five crystals seem to appear in this area whose presence is indicated by white arrows. These seem to be formed as a result of compositional difference/contrast appearing due to poor or improper casting practice itself (as explained earlier), liquid-liquid transition [32] [73] [74], any phase separation [75] and cooling rate. These may be attributed to onset of crystallization. These
 (a)
(a)
 (b)
(b)
 (c)
(c)
 (d)
(d)
 (e)
(e)
 (f)
(f)
Figure 7. (a)-(f): Zr65Cu15Al10Co10, inoculant = 0.25%.
become more prominent in back scatter electron imaging due to very nature of technique itself which promotes/enhances areas where one element is rich in percentage as compared to other. However, this contrast is very poor as only very little percentage of inoculant is present. Size of crystals on average range from 2.8 µm to 6.2 µm. Secondary electron images at middle portion of this sample show profound dark and light color areas. These typically represent areas of distinct nucleation and growth. Phase nucleated in this area is β-Zr [76] [77] which may also be identified by its geometrical shape which has plate like morphology. Since the phase is still in its nucleation stage and does not show profound growth before it is confronted with high cooling rate which suppress kinetics, its shape is an intermediate of shape of fully grown phase. This is more evidently observed in back scatter images of this sample in same area of interest. Image showing protrusions in two-dimensional space are indicative of compositional contrast and point towards onset of nucleation and growth phenomena. In fully grown condition, it evolves in the form of dendrite or well defined flower like pattern/morphology [78]. Size of minutely appearing crystals range from 2 µm to 5.8 µm with high aspect ratio perpendicular to melt flow direction. Orientation of crystals in this direction is also indicative of preferential heat transfer. Finally, as point of interest moves towards widest portion of wedge (Figure 7(e) and Figure 7(f)), well defined long plate type β-Zr crystals are observed [78]. It can easily be observed that these are outcome of growth of crystals observed in previous region. This happens, as there is ample time for growth in this region of casting which promotes their morphological development. Alongside, these β-Zr crystals, small to medium sized crystals having hexagonal basal plane structure are also observed. These resemble Cu2Zr with P63/nmc symmetry [55]. Exact nature of these crystals is under investigation and will be described by detailed electron back scatter diffraction (EBSD) study.
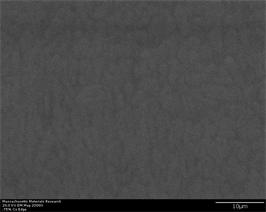
Progressively, as the percentage of inoculant increase till 0.5%, a continuous trend of phase evolution is observed (Figure 8(a)-(f)). This is attributed to nucleation phenomena occurring at more points indicating towards their enhanced nucleation density which ultimately contribute towards higher number density of crystalline phase. A slight morphological contrast is observed in images taken at tip region (Figure 8(a) and Figure 8(b)). This is not a conclusive proof that increased percentage of inoculant has started to show its effect towards providing more nucleation sites. This is retrospectively proved by images taken in back scatter mode in which virtually no crystallinity is observed. However, as the point of observation moves away from tip towards the wider portion of sample, evidence of nucleation starts appearing. However, there is not enough growth and slight nucleation is observed to occur forming grain boundaries. Some hexagonal crystals are observed to form in lower left-hand side of (Figure 8(c)) but still, their morphological development is not complete. This is retrospectively confirmed by images taken in back scatter mode which clearly show phase formation. Size of crystals range from 2.4 µm to 2.8 µm and their shape is mostly
 (a)
(a)
 (b)
(b)
 (c)
(c)
 (d)
(d)
 (e)
(e)
 (f)
(f)
Figure 8. (a)-(f): Zr65Cu15Al10Co10, inoculant = 0.50%.
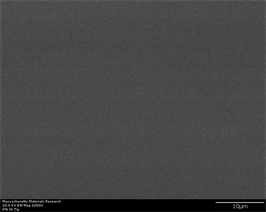
hexagonal but in very early stage of their formation. At widest portion of wedge, β-Zr crystals are observed to appear. However, astonishingly, their shape is large as compared to phases appearing in same region at 0.25% inoculant. A trend of increase in their number density was expected but this proved out to be false. This may be attributed to more time allowed for diffusion to occur which may have assimilated prior nucleation sites at one point resulting in one large size grain. However, only two large grains of this type are observed in area of interest thus cannot be accounted as prominent phenomena. Small to medium size crystals of hexagonal shape are also observed and their presence is again proved by back scatter images. Partially, observance of these abnormal structures is manifested by old microscope itself. Images of indents taken with new thermally assisted shottckey type field emission microscope show clearer and distinct phase formation with morphology (described in next section). Small blurry regions in between nucleating phases are indicative of development of intermetallic phase whose characterization is still pending [78]. With the increase of inoculant percentage to 0.75%, profound crystallinity starts appearing even at tip region (Figure 9(a)-(f)). This can be easily observed in both secondary and back scatter electron images. In field of view, only six crystals are observed out of which two are observed to evolve with hexagonal crystal structure while others are shown to possess elongated structure which is typical of β-Zr crystals. Their well-defined appearance in background of glassy matrix can be witnessed in middle and widest portion of wedge. Both types of structures i.e. hexagonal and β-Zr crystals are clearly visible in abundance in field of view in the middle of sample (Figure 9(c) and Figure 9(d)) while well-defined and large size hexagonal
 (a)
(a)
 (b)
(b)
 (c)
(c)
 (d)
(d)
 (e)
(e)
 (f)
(f)
Figure 9. (a)-(f): Zr65Cu15Al10Co10, inoculant = 0.75%.
crystals are observed in wider portion of sample. Once again, increase in their size may be attributed to ample time available for diffusion in this region which not only promotes growth of one crystal but may also lead towards emergence of multiple crystals into a large one by dissolution of grain boundaries into each other. Emergence of these hexagonal structures may also be attributed to increased toughness due not only to their evolution but their growth in wider regions which provide sites to hindrance of motion of shear bands (explained in next section). As the percentage of inoculant increase to 1.0%, similar type of trend is observed in which almost no crystallinity is observed at tip and appreciable amount of it starts appearing as point of observation in a field of view is moved away from tip towards the inside of wedge (Figure 10(a) and Figure 10(b)). Once again, not enough crystallinity is observed as point of observation is moved to middle but few hints of formation of crystals starts appearing in this region. However, as point of view moves away from this further towards widest part of specimen (Figure 10(e) and Figure 10(f)), visible hexagonal type crystals are witnessed. Once again, their size is large as compared to their quantity. This may again be attributed to diffusion which might have happened in this region which not only allowed individual crystal to develop but also became the reason of grain boundary dissolution resulting in emergence of one large grain than a lot of small ones. This is not desired situation and become the reason of decrease in hardness of material without increasing its toughness. “River like” or “flower like” pattern is again observed which may be attributed to onset of nucleation or metal flow pattern in mold cavity. This again is confirmed by compositional contrast observed in adjacent back scatter images in which areas of higher or lower atomic weight generates a contrast. This is typically related to earlier witnessed nature (Zr2Cu) of these precipitating crystals [56]. Size of these crystals range from 2.8 - 4 µm which again is in direct relation with decreased strength.
3.3. Indentation Hardness Testing
Although known, measured and used as quantification criterion for a very long time [79] [80] [81] [82], still there are some unanswered questions when measurement of hardness comes to bulk metallic glasses and their composites [7] [8] [9] [83]. Various experimental (manual, instrumented [84], micro [85] [86] and nano [87] [88]) and simulation [89] [90] strategies have been proposed, tried and tested on these materials but still, there is insufficiency about effective application of hardness testing on bulk metallic glass matrix composites. In context to present study, one of biggest questions is how much yield strength [91], ductility [8] [92] [93] [94] and fracture toughness [95] [96] has been caused by the effect of inoculation and how can this be quantitatively measured by indentation hardness testing? In present study, an effort has been made to address this gap. Hardness of these alloys was measured using Vickers hardness testing method. ASTM standard E 384 is adopted to measure the values. Imaging of Vickers hardness indents is carried out in secondary electron mode and using
 (a)
(a)
 (b)
(b)
 (c)
(c)
 (d)
(d)
 (e)
(e)
 (f)
(f)
Figure 10. (a)-(f): Zr65Cu15Al10Co10, inoculant = 1.0%.
Everhart-Thornley detector. Three indents were taken at three different points in an area close to widest portion of wedge. Consequently, one image of each indent was taken. Images were taken at an accelerating voltage of 20 kV with current of 1.6 nA at magnification of 2000 - 2500x. Before describing images one by one, certain machine parameters and their control casted an effect on final image quality which is described below; Voltage: The voltage at which microscope was operated yielded very little surface information because of absence of edge effect and tendency of image to become transparent. It is advisable to operate microscope at lower voltage with “in lens” secondary electron detector. Unfortunately, this type of imaging was not available in laboratory in given time and only Everhart-Thornley type detector could be utilized. Depth profiling: Another problem encountered was inability of Everhart Thornley type detector to image thin layers, contamination marks and depth profiling. This can be clearly seen in the images taken by this type of detector at high voltages. No clear edge effect is observed and even indent portion of specimen looked flat to surface. Unfortunately, this remained a bottleneck during these set of experiments. Charging: Another big problem which took a lot of microscope time and generated falsified images was charging. As the voltage is increased to higher values to take advantage of edge effect while using Everhart-Thornley detector, non-conducting surfaces at or near sample gets charged and sample becomes transparent due to increased penetration depth. This is another reason to keep operating voltage low both in case of Everhart-Thornley and in-lens detectors. Shadow generation: Everhart-Thornley detector generates shadow at lower collector bias voltage. On the other hand, one of biggest advantages of Everhart Thornley detector is it is excellent to image fracture surfaces and cracks. This can be easily seen by fine imaging of shear transformation zones and cracks originating from edge of indents. All these factors collectively contribute towards the deterioration of image and must be taken into account to ensure good image quality.
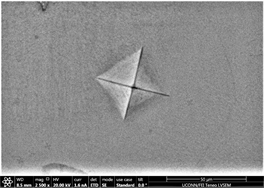
Figures 11(a)-(c) are images of indents in Zr47.5Cu45.5Al5Co2 samples with 0.25% inoculant. It can be easily seen that indents are uniform at edges with no evidence of bulging or blurring. A slight hint of surface roughness (onset of palmqvist cracking [96]) is observed along the lower lip of indents which is indicative that samples are hard enough to resist indentation. This also indicates that there is not enough toughness in material. No evidence of development of shear transformation zone is witnessed around indents which indicates that material is still hard enough with no toughness. There is no evidence of inward movement or flow of material which is good indicator in predicting elastic behavior of material. This also indicates that there is no recoil in material with removal of indenter. Size of CuZr B2 phase can also be seen that it is very small and is not fully grown. It has nucleated and is uniformly dispersed all through out the glassy matrix but still is not large enough in size. Similar type of behavior is observed in other two indents. Figures 11(d)-(f) show images of indents with 0.5% inoculant. As shown in previous study [11], these are the best samples indicating an optimum percentage of inoculant. There is no evidence of cracking, bulging, inward movement of material or development of shear transformation zone in an area of stress concentration. However, like previous samples, there is slight movement of material around lower lip of Figure 11(e)-(f). This again can be attributed to onset of cracking and indicates that material still has not developed optimum toughness. Size of precipitates can also be more clearly observed as compared to previous images taken by old microscope with LaB6 filament and these are found to be slightly larger than those observed at 0.25% inoculant. Figures 12(a)-(c) are of material with 0.75% inoculant. These images clearly show development of softness and onset of ductility. Clear depressions can be observed around indents which eventually lead to inward material flow as
 (a)
(a)
 (b)
(b)
 (c)
(c)
 (d)
(d)
 (e)
(e)
 (f)
(f)
Figure 11. (a)-(c): Indents Zr47.5Cu45.5Al5Co2, inoculant = 0.25% ; (d)-(f): Indents Zr47.5Cu45.5Al5Co2, inoculant = 0.50%.
the indent is removed. There is no evidence of development of plastic or shear transformation zones. It is also difficult to measure distance between cross wires because of the shaping of material. Not enough precipitation can be seen in background of material due to poor imaging practice adopted and time constraint. Finally, Figures 12(d)-(f) are from material with 1% inoculant. These images are indicative of development of enough toughness. It can clearly be seen that with the application of force, material tends to flow outward but due to its intrinsic nature, it tends to develop areas of stress concentration which clearly leads to development of shear transformation zones and shear band confronts hurdle to its motion. This is very good indicator that material is plastic and has developed enough toughness. No inward material flow is witnessed which is sign of absence of material recoil. These observations prove the effectivity of inoculation in increasing ductility and toughness. This is also consistent with earlier studies. Size of precipitates is also large enough and are well developed to offer
 (a)
(a)
 (b)
(b)
 (c)
(c)
 (d)
(d)
 (e)
(e)
 (f)
(f)
Figure 12. (a)-(c): Indents Zr47.5Cu45.5Al5Co2, inoculant = 0.75%; (d)-(f): Indents Zr47.5Cu45.5Al5Co2, inoculant = 1.0%.
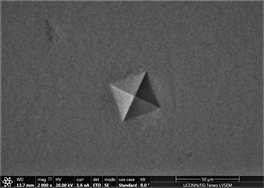
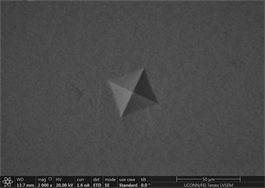
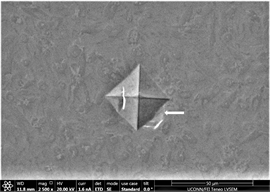
enough resistance to motion of shear bands and promote crystallinity and toughness. It also leads to assumption that material will show cup and cone type ductile fracture if subjected to standard tensile testing. Similarly, images of indents of Zr65Cu15Al10Ni10 were taken and a near similar behavior was observed. Figures 13(a)-(c) show images of material with zero percentage of inoculant. It can be clearly seen that material is extremely brittle. Visible Palmqvist cracks were observed alongside the periphery of indents. These cracks are clear indication of brittle nature of material. However, geometry of indents is well defined. Neither, there is any outward or inward motion of material nor any bulging or depression. There are no visible precipitates in glassy matrix which again supports the hypothesis that material is brittle in the absence of any inoculants. As indentation is performed on other samples, a trend of increase in toughness is observed which is observed in images taken. Figures 13(d)-(f) are images of material with 0.25% inoculant. It can be easily observed that there is change in
 (a)
(a)
 (b)
(b)
 (c)
(c)
 (d)
(d)
 (e)
(e)
 (f)
(f)
Figure 13. (a)-(c): Indents Zr65Cu15Al10Co10, inoculant = 0 %, (d)-(f): Indents Zr65Cu15Al10Co10, inoculant = 0.25 %.
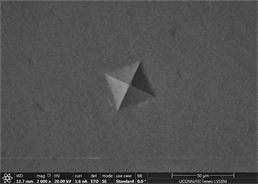
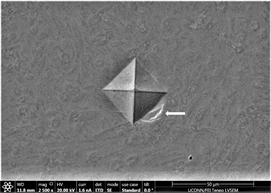
crack morphology, size and type. With increase of percentage of inoculants, crack tends to be wider, well dispersed and in Figure 13(d) there is marked evidence of stress concentration [97] [98] [99]. Size of precipitates originating in the background has also increased from almost zero to 2.6 µm on average. Geometry of indents remains well defined square base. As percentage of inoculant increases to 0.5%, a difference in shape and size of indent is observed which can be seen in subsequent images Figures 14(a)-(c). Material tends to show a balance of strength and toughness as it is indented. Indent tends to maintain its square base with little or no onset of cracking, bulging, depression or outward material flow. However, a marked effect of stress concentration can be seen in Figure 14(c). This is good indication that material has started to show ductility. Contrast observed on micrographs taken is due to overcharging. This also deteriorates the background. Long black irregular continuous streaks on the surface of sample in Figure 14(a) are due to some organic or inorganic material left after
 (a)
(a)
 (b)
(b)
 (c)
(c)
 (d)
(d)
 (e)
(e)
 (f)
(f)
Figure 14. (a)-(c): Indents Zr65Cu15Al10Co10, inoculant = 0.5%; (d)-(f): Indents Zr65Cu15Al10Co10, inoculant = 0.75%.
grinding and polishing. These streaks have also been observed in previous images taken with old microscope and similar reason could be ascertained to this. Dark spot in upper left quarter of Figure 14(b) is indication of presence of some surface inclusion or impurity. Nature, type and size of crystals can also be more clearly observed in glassy background. As the percentage of inoculant increases to 0.75%, an effect similar to the one observed at same composition in Zr47.5Cu45.5Al5Co2 alloys is witnessed (Figures 14(d)-(f)). That is; material tends to exhibit softness after reaching an optimized value of hardness. This is also consistent with phenomena of threshold proposed by author in a previous unpublished study. Amount and size of precipitates also tends to decrease, with size reaching average minimum of 0.8 µm. It was extremely difficult to get good images as sample show ample charging. A considerable amount of pin holes or porosity is observed in image (Figure 14(e)). Some of the reason attributed to it could be mal practice of melting and casting setup, poor control of casting
 (a)
(a)
 (b)
(b)
 (c)
(c)
Figure 15. (a)-(c): Indents Zr65Cu15Al10Co10, inoculant = 1.0%.
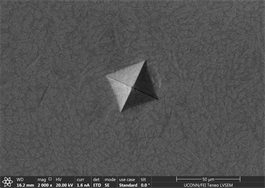
conditions or fatigue of operator. Finally, as the percentage of inoculant increase to 1% maximum, development of proper, distinct and well-defined stress concentration zones is observed (Figures 15(a)-(c)). These are markedly observable in a matrix background consisting of medium size precipitates nucleating from glassy background. A trend of development of these areas to Palmqvist [96] type cracks can also be observed. Their size ranges from 7.6 - 8.2 µm. These are very god indication that considerable amount of plasticity has developed without cracking. On average, size of individual precipitates ranges from 2.8 - 7.8 µm. Overall observance of pattern developed around indents are good hopeful indication of promotion of crystallinity and toughness.
4. Conclusions
Following conclusions could be drawn from present study;
1) ZrC is tested and found to be an effective inoculant to increase ductility, and toughness while maintaining high strength in Zr47.5Cu45.5Al5Co2 and Zr65Cu15Al10Ni10 bulk metallic glass matrix composites.
2) Improvement in ductility and toughness is clearly witnessed with increase in crystallinity (measured by semi quantitative analysis) as affected by increased percentage of inoculant.
3) Development of stress concentration zones around indents leading to formation of shear transformation zones (STZ) are good indicator that inoculation was effective in overcoming the barrier of poor ductility and toughness.
4) It is also observed experimentally that inoculation has a certain minimum threshold value (0.5%) till which it shows its maximum effectivity (increase in toughness) and beyond which a balance, decrease and then increase in toughness is observed.
Some of future work includes; quantitative metallography of phases, measurement of indentation fracture toughness from crack length, etching and once again scanning electron microscopy of inoculated samples.
Acknowledgements
Author would like to thank untiring, timely and above average support of Mr. Jeremy Gonzales, Mr. Kevin Pelletier, Mrs. Margaret Carlson and Dr. Fahmida Hossain, Massachusetts Materials Research Inc. Worcester, MA in sample preparation, microhardness testing and conducting scanning electron microscopy, Dr. Steven L. Suib and his graduate student Mr. Zachary Tobin, Institute of Materials Research, University of Connecticut, Storrs, CT in conducting scanning electron microscopy of microhardness indents, Dr. Daniel East (CSIRO) for vacuum arc melting and suction casting of samples and round the clock availability of Prof. Dr. Milan Brandt on telephone for discussions, directions, support, patience and guidance. Author would also like to hank administrative personal (Mrs. Lina Bubic) of School of Engineering and finance team of School of Graduate Research, RMIT University for providing administrative and financial support throughout my research work.
Conflicts of Interest
The authors declare no conflicts of interest regarding the publication of this paper.
Cite this paper
Rafique, M.M.A. (2018) Effect of Inoculation on Phase Formation and Indentation Hardness Behaviour of Zr47.5Cu45.5Al5Co2 and Zr65Cu15Al10Ni10 Bulk Metallic Glass Matrix Composites. Engineering, 10, 530-559. https://doi.org/10.4236/eng.2018.108039
References
- 1. Hays, C.C., Kim, C.P. and Johnson, W.L. (2000) Microstructure Controlled Shear Band Pattern Formation and Enhanced Plasticity of Bulk Metallic Glasses Containing in situ Formed Ductile Phase Dendrite Dispersions. Physical Review Letters, 84, 2901-2904. https://doi.org/10.1103/PhysRevLett.84.2901
- 2. Hofmann, D.C., et al. (2008) Designing Metallic Glass Matrix Composites with High Toughness and Tensile Ductility. Nature, 451, 1085. https://doi.org/10.1038/nature06598
- 3. Choi-Yim, H. and Johnson, W.L. (1997) Bulk Metallic Glass Matrix Composites. Applied Physics Letters, 71, 3808-3810. https://doi.org/10.1063/1.120512
- 4. Jiang, J.-Z., et al. (2015) Low-Density High-Strength Bulk Metallic Glasses and Their Composites: A Review. Advanced Engineering Materials, 17, 761-780. https://doi.org/10.1002/adem.201400252
- 5. Zhai, H., Wang, H. and Liu, F. (2016) A Strategy for Designing Bulk Metallic Glass Composites with Excellent Work-Hardening and Large Tensile Ductility. Journal of Alloys and Compounds, 685, 322-330. https://doi.org/10.1016/j.jallcom.2016.05.290
- 6. Si, J.J., et al. (2015) Cr-Based Bulk Metallic Glasses with Ultrahigh Hardness. Applied Physics Letters, 106, 251905. https://doi.org/10.1063/1.4923210
- 7. Ramamurty, U., et al. (2005) Hardness and Plastic Deformation in a Bulk Metallic Glass. Acta Materialia, 53, 705-717. https://doi.org/10.1016/j.actamat.2004.10.023
- 8. Keryvin, V., Hoang, V.H. and Shen, J. (2009) Hardness, Toughness, Brittleness and Cracking Systems in an Iron-Based Bulk Metallic Glass by Indentation. Intermetallics, 17, 211-217. https://doi.org/10.1016/j.intermet.2008.08.017
- 9. Narayan, R.L., et al. (2010) On the Hardness and Elastic Modulus of Bulk Metallic Glass Matrix Composites. Scripta Materialia, 63, 768-771. https://doi.org/10.1016/j.scriptamat.2010.06.010
- 10. Pan, X.F., et al. (2005) Vickers Hardness and Compressive Properties of Bulk Metallic Glasses and Nanostructure-Dendrite Composites. Journal of Materials Research, 20, 2632-2638. https://doi.org/10.1557/JMR.2005.0328
- 11. Rafique, M.M.A. (2018) Production and Characterization of Zr Based Bulk Metallic Glass Matrix Composites (BMGMC) in the Form of Wedge Shape Ingots. Engineering, 10, 31. https://doi.org/10.4236/eng.2018.104015
- 12. Inoue, A., et al. (2015) Production Methods and Properties of Engineering Glassy Alloys and Composites. Intermetallics, 58, 20-30. https://doi.org/10.1016/j.intermet.2014.11.001
- 13. Rafique, M.M.A. (2018) Modelling and Simulation of Solidification Phenomena during Additive Manufacturing of Bulk Metallic Glass Matrix Composites (BMGMC)—A Brief Review and Introduction of Technique. Journal of Encapsulation and Adsorption Sciences, 08, 50. https://doi.org/10.4236/jeas.2018.82005
- 14. Ashby, M.F. and Greer, A.L. (2006) Metallic Glasses as Structural Materials. Scripta Materialia, 54, 321-326. https://doi.org/10.1016/j.scriptamat.2005.09.051
- 15. Telford, M. (2004) The Case for Bulk Metallic Glass. Materials Today, 7, 36-43. https://doi.org/10.1016/S1369-7021(04)00124-5
- 16. Lee, H., et al. (2014) Hypervelocity Impact Phenomenon in Bulk Metallic Glasses and Composites. Advanced Engineering Materials, 16, 85-93. https://doi.org/10.1002/adem.201300252
- 17. Fecht, H.-J. and Wunderlich, R.K. (2017) Fundamentals of Liquid Processing in Low Earth Orbit: From Thermophysical Properties to Microstructure Formation in Metallic Alloys. JOM, 69, 1261-1268. https://doi.org/10.1007/s11837-017-2417-4
- 18. C., H.D., et al. (2015) Hypervelocity Impact Testing of a Metallic Glass-Stuffed Whipple Shield. Advanced Engineering Materials, 17, 1313-1322. https://doi.org/10.1002/adem.201400518
- 19. Choi, H., et al. (2007) Tribological Behavior of the Kinetic Sprayed Ni59Ti16Zr20Si2Sn3 Bulk Metallic Glass. Journal of Alloys and Compounds, 434-435, 64-67.
- 20. Hofmann, D.C. (2010) Shape Memory Bulk Metallic Glass Composites. Science, 329, 1294-1295. https://doi.org/10.1126/science.1193522
- 21. Gargarella, P., et al. (2013) Ti-Cu-Ni Shape Memory Bulk Metallic Glass Composites. Acta Materialia, 61, 151-162. https://doi.org/10.1016/j.actamat.2012.09.042
- 22. Hofmann, D.C., et al. (2016) Castable Bulk Metallic Glass Strain Wave Gears: Towards Decreasing the Cost of High-Performance Robotics. Scientific Reports, 6, Article ID: 37773.
- 23. Hofmann, D.C., et al. (2017) Optimizing Bulk Metallic Glasses for Robust, Highly Wear-Resistant Gears. Advanced Engineering Materials, 19, Article ID: 1600541.
- 24. Li, H., et al. (2006) Compressive Behavior of a Zr-Based Metallic Glass at Cryogenic Temperatures. Advanced Materials, 18, 752-754. https://doi.org/10.1002/adma.200501990
- 25. Inoue, A., Zhang, T. and Makabe, E. (1998) Production Methods of Metallic Glasses by a Suction Casting Method. Google Patents.
- 26. Inoue, A. and Takeuchi, A. (2011) Recent Development and Application Products of Bulk Glassy Alloys. Acta Materialia, 59, 2243-2267. https://doi.org/10.1016/j.actamat.2010.11.027
- 27. Jiang, S.-S., et al. (2018) A CuZr-Based Bulk Metallic Glass Composite with Excellent Mechanical Properties by Optimizing Microstructure. Journal of Non-Crystalline Solids, 483, 94-98. https://doi.org/10.1016/j.jnoncrysol.2018.01.006
- 28. Abdeljawad, F., Fontus, M. and Haataja, M. (2011) Ductility of Bulk Metallic Glass Composites: Microstructural Effects. Applied Physics Letters, 98, Article ID: 031909. https://doi.org/10.1016/j.actamat.2012.02.017
- 29. Liu, Z., et al. (2012) Microstructural Tailoring and Improvement of Mechanical Properties in CuZr-Based Bulk Metallic Glass Composites. Acta Materialia, 60, 3128-3139.
- 30. Rafique, M.M.A., Qiu, D. and Easton, M. (2017) Modeling and Simulation of Microstructural Evolution in Zr Based Bulk Metallic Glass Matrix Composites during Solidification. MRS Advances, 2, 3591-3606.
- 31. Seo, J.W. and Schryvers, D. (1998) TEM Investigation of the Microstructure and Defects of CuZr Martensite. Part II: Planar Defects. Acta Materialia, 46, 1177-1183. https://doi.org/10.1016/S1359-6454(97)00334-0
- 32. Zu, F.-Q. (2015) Temperature-Induced Liquid-Liquid Transition in Metallic Melts: A Brief Review on the New Physical Phenomenon. Metals, 5, 395-417.
- 33. Guo, G.-Q., et al. (2015) Detecting Structural Features in Metallic Glass via Synchrotron Radiation Experiments Combined with Simulations. Metals, 5, 2093-2108.
- 34. Guo, G.-Q., et al. (2015) How Can Synchrotron Radiation Techniques Be Applied for Detecting Microstructures in Amorphous Alloys? Metals, 5, 2048-2057.
- 35. Michalik, S., et al. (2014) Structural Modifications of Swift-Ion-Bombarded Metallic Glasses Studied by High-Energy X-Ray Synchrotron Radiation. Acta Materialia, 80, 309-316. https://doi.org/10.1016/j.actamat.2014.07.072
- 36. Pekarskaya, E., Kim, C.P. and Johnson, W.L. (2001) In Situ Transmission Electron Microscopy Studies of Shear Bands in a Bulk Metallic Glass Based Composite. Journal of Materials Research, 16, 2513-2518. https://doi.org/10.1557/JMR.2001.0344
- 37. Zhang, Q., Zhang, H., Zhu, Z. and Hu, Z. (2005) Formation of High Strength In-Situ Bulk Metallic Glass Composite with Enhanced Plasticity in Cu50Zr47:5Ti2:5 Alloy. Materials Transactions, 46, 730-733. https://doi.org/10.2320/matertrans.46.730
- 38. Bai, J., et al. (2015) Temperature Dependent Dynamic Flow Behavior of an In-Situ Ti-Based Bulk Metallic Glass Composite. Materials Science and Engineering: A, 627, 21-26. https://doi.org/10.1016/j.msea.2014.12.100
- 39. Qiao, J.W., et al. (2013) A Tensile Deformation Model for In-Situ Dendrite/Metallic Glass Matrix Composites. Scientific Reports, 3, Article No. 2816.
- 40. Booth, J., Lewandowski, J. and Carter, J. (2014) EBSD Analysis for Microstructure Characterization of Zr-Based Bulk Metallic Glass Composites. Microscopy and Microanalysis, 20, 852-853.
- 41. Yeh, M.-C., et al. (2017) The Microstructure of Zr-Based Bulk Metallic Glass and Glass Matrix Composite. Journal of Materials Science and Engineering B, 7, 135-141.
- 42. Chen, T.-H. and Tsai, C.-K. (2015) The Microstructural Evolution and Mechanical Properties of Zr-Based Metallic Glass under Different Strain Rate Compressions. Materials, 8, 1831-1840.
- 43. Borrajo-Pelaez, R. and Hedström, P. (2018) Recent Developments of Crystallographic Analysis Methods in the Scanning Electron Microscope for Applications in Metallurgy. Critical Reviews in Solid State and Materials Sciences, 43, 455-474. https://doi.org/10.1080/10408436.2017.1370576
- 44. Avishai, A., et al. (2013) Transmission EBSD-Bridging the Gap between SEM and TEM. Microscopy and Microanalysis, 19, 694-695.
- 45. El-Dasher, B. and Deal, A. (2009) Application of Electron Backscatter Diffraction to Phase Identification. In: Electron Backscatter Diffraction in Materials Science, Springer, Berlin, 81-95.
- 46. Zhou, W. and Wang, Z.L. (2007) Scanning Microscopy for Nanotechnology: Techniques and Applications. Springer, New York.
- 47. Michael, J. (2002) Electron Backscatter Diffraction in the SEM: A Tutorial. Microscopy and Microanalysis, 8, 724-725.
- 48. Britton, T.B., et al. (2016) Tutorial: Crystal Orientations and EBSD—Or Which Way Is Up? Materials Characterization, 117, 113-126.
- 49. Schwarzer, R.A., et al. (2009) Present State of Electron Backscatter Diffraction and Prospective Developments. In: Electron Backscatter Diffraction in Materials Science, Springer, Berlin, 1-20.
- 50. Schwarzer, R.A. (2000) Automated Electron Backscatter Diffraction: Present State and Prospects. In: Electron Backscatter Diffraction in Materials Science, Springer, Berlin, 105-122.
- 51. Field, D. (2005) Improving the Spatial Resolution of EBSD. Microscopy and Microanalysis, 11, 52-53.
- 52. Aboki, T.A. (2013) Development of Fe-B Based Bulk Metallic Glasses: Morphology of Residual Phases in Fe50Ni16Mo6B18Zr10 Glass. Metals, 3, 159-177. https://doi.org/10.3390/met3020159
- 53. Kelly, P. and Zhang, M.-X. (1999) Edge-to-Edge Matching—A New Approach to the Morphology and Crystallography of Precipitates. Materials Forum.
- 54. Kelly, P.M. and Zhang, M.-X. (2006) Edge-to-Edge Matching—The Fundamentals. Metallurgical and Materials Transactions A, 37, 833-839. https://doi.org/10.1007/s11661-006-0056-4
- 55. Gargarella, P., et al. (2014) Phase Formation and Mechanical Properties of Ti-Cu-Ni-Zr Bulk Metallic Glass Composites. Acta Materialia, 65, 259-269. https://doi.org/10.1016/j.actamat.2013.10.068
- 56. Cheng, J.L. and Chen, G. (2013) Glass Formation of Zr-Cu-Ni-Al Bulk Metallic Glasses Correlated with L→Zr2Cu+ZrCu Pseudo Binary Eutectic Reaction. Journal of Alloys and Compounds, 577, 451-455. https://doi.org/10.1016/j.jallcom.2013.06.126
- 57. Liu, J., et al. (2010) In Situ Spherical B2 CuZr Phase Reinforced ZrCuNiAlNb Bulk Metallic Glass Matrix Composite. Journal of Materials Research, 25, 1159-1163. https://doi.org/10.1557/JMR.2010.0138
- 58. Song, K.K., et al. (2013) Correlation between the Microstructures and the Deformation Mechanisms of CuZr-Based Bulk Metallic Glass Composites. Materials Characterization, 3, Article ID: 012116.
- 59. Biffi, C.A., Figini Albisetti, A. and Tuissi, A. (2013) CuZr Based Shape Memory Alloys: Effect of Cr and Co on the Martensitic Transformation. Materials Science Forum.
- 60. Wu, D.Y., et al. (2016) Glass-Forming Ability, Thermal Stability of B2 CuZr Phase, and Crystallization Kinetics for Rapidly Solidified Cu-Zr-Zn Alloys. Journal of Alloys and Compounds, 664, 99-108. https://doi.org/10.1016/j.jallcom.2015.12.187
- 61. Gammer, C., et al. (2017) Influence of the Ag Concentration on the Medium-Range Order in a CuZrAlAg Bulk Metallic Glass. Scientific Reports, 7, Article No. 44903.
- 62. Ding, J., et al. (2014) Large-Sized CuZr-Based Bulk Metallic Glass Composite with Enhanced Mechanical Properties. Journal of Materials Science & Technology, 30, 590-594. https://doi.org/10.1016/j.jmst.2014.01.014
- 63. Song, G., et al. (2017) Martensitic Transformation in a B2-Containing CuZr-Based BMG Composite Revealed by in Situ Neutron Diffraction. Journal of Alloys and Compounds, 723, 714-721. https://doi.org/10.1016/j.jallcom.2017.06.270
- 64. Liu, Z.Q., et al. (2014) Microstructural Percolation Assisted Breakthrough of Trade-Off between Strength and Ductility in CuZr-Based Metallic Glass Composites. Scientific Reports, 4, Article No. 4167.
- 65. Song, K.K., et al. (2011) Strategy for Pinpointing the Formation of B2 CuZr in Metastable CuZr-Based Shape Memory Alloys. Acta Materialia, 59, 6620-6630.
- 66. Song, K. (2013) Synthesis, Microstructure, and Deformation Mechanisms of CuZr-Based Bulk Metallic Glass Composites.
- 67. Seo, J.W. and Schryvers, D. (1998) TEM Investigation of the Microstructure and Defects of CuZr Martensite. Part I: Morphology and Twin Systems. Acta Materialia, 46, 1165-1175.
- 68. Pauly, S., et al. (2010) Transformation-Mediated Ductility in CuZr-Based Bulk Metallic Glasses. Nature Materials, 9, 473-477.
- 69. Schryvers, D., et al. (1997) Unit Cell Determination in CuZr Martensite by Electron Microscopy and X-Ray Diffraction. Scripta Materialia, 36, 1119-1125.
- 70. Christian, J.W. (2002) The Theory of Transformations in Metals and Alloys. Elsevier Science, New York.
- 71. Porter, D.A. and Easterling, K.E. (1992) Phase Transformations in Metals and Alloys. 3rd Edition (Revised Reprint), Taylor & Francis, Abingdon-on-Thames.
- 72. Qiu, D., et al. (2018) Refining As-Cast β-Ti Grains through ZrN Inoculation. Metallurgical and Materials Transactions A, 49, 1444-1449.
- 73. Lan, S., et al. (2016) Structural Crossover in a Supercooled Metallic Liquid and the Link to a Liquid-to-Liquid Phase Transition. Applied Physics Letters, 108, Article ID: 211907.
- 74. Wei, S., et al. (2013) Liquid-Liquid Transition in a Strong Bulk Metallic Glass-Forming Liquid. Nature Communications, 4, Article No. 2083.
- 75. Chang, H.J., et al. (2010) Synthesis of Metallic Glass Composites Using Phase Separation Phenomena. Acta Materialia, 58, 2483-2491.
- 76. He, G., et al. (2003) Novel Ti-Base Nanostructure-Dendrite Composite with Enhanced Plasticity. Nature Materials, 2, 33-37.
- 77. Zhang, L., et al. (2016) Negentropic Stabilization of Metastable β-Ti in Bulk Metallic Glass Composites. Scripta Materialia, 125, 19-23.
- 78. Zhang, L., et al. (2018) Developing β-Type Bulk Metallic Glass Composites from Ti/Zr-Based Bulk Metallic Glasses by an Iteration Method. Journal of Alloys and Compounds, 740, 639-646.
- 79. Avner, S.H. (1974) Introduction to Physical Metallurgy. McGraw-Hill, New York City.
- 80. Heine, R.W., Loper, C.R. and Rosenthal, P.C. (1955) Principles of Metal Casting. McGraw-Hill, New York City.
- 81. Smith, W.F. and Hashemi, J. (2003) Foundations of Materials Science and Engineering. McGraw-Hill, New York City.
- 82. Callister, W.D. and Rethwisch, D.G. (2010) Materials Science and Engineering: An Introduction. John Wiley & Sons, Hoboken.
- 83. Li, W.H., et al. (2006) Instrumented Indentation Study of Plastic Deformation in Bulk Metallic Glasses. Journal of Materials Research, 21, 75-81. https://doi.org/10.1557/jmr.2006.0037
- 84. Schuh, C.A. and Nieh, T.G. (2004) A Survey of Instrumented Indentation Studies on Metallic Glasses. Journal of Materials Research, 19, 46-57. https://doi.org/10.1557/jmr.2004.19.1.46
- 85. Subhash, G. and Zhang, H. (2007) Shear Band Patterns in Metallic Glasses under Static Indentation, Dynamic Indentation, and Scratch Processes. Metallurgical and Materials Transactions A, 38, 2936-2942. https://doi.org/10.1007/s11661-007-9315-2
- 86. Zhang, H., et al. (2005) Investigation of Shear Band Evolution in Amorphous Alloys beneath a Vickers Indentation. Acta Materialia, 53, 3849-3859. https://doi.org/10.1016/j.actamat.2005.04.036
- 87. Schuh, C.A., et al. (2003) The Transition from Localized to Homogeneous Plasticity during Nanoindentation of an Amorphous Metal. Philosophical Magazine, 83, 2585-2597. https://doi.org/10.1080/1478643031000118012
- 88. Trelewicz, J.R. and Schuh, C.A. (2007) The Hall-Petch Breakdown in Nanocrystalline Metals: A Crossover to Glass-Like Deformation. Acta Materialia, 55, 5948-5958. https://doi.org/10.1016/j.actamat.2007.07.020
- 89. Zhao, D., et al. (2017) Investigation on Hardening Behavior of Metallic Glass under Cyclic Indentation Loading via Molecular Dynamics Simulation. Applied Surface Science, 416, 14-23. https://doi.org/10.1016/j.apsusc.2017.04.125
- 90. Wu, C.-Y., Wang, Y.-C. and Chen, C. (2015) Indentation Properties of Cu-Zr-Al Metallic-Glass Thin Films at Elevated Temperatures via Molecular Dynamics Simulation. Computational Materials Science, 102, 234-242. https://doi.org/10.1016/j.commatsci.2015.01.045
- 91. Zhang, H.W., et al. (2006) Evaluation of Hardness-Yield Strength Relationships for Bulk Metallic Glasses. Philosophical Magazine Letters, 86, 333-345. https://doi.org/10.1080/09500830600788935
- 92. Chen, M. (2008) Mechanical Behavior of Metallic Glasses: Microscopic Understanding of Strength and Ductility. Annual Review of Materials Research, 38, 445-469. https://doi.org/10.1146/annurev.matsci.38.060407.130226
- 93. Guo, H., et al. (2007) Tensile Ductility and Necking of Metallic Glass. Nat Mater, 6, 735-739. https://doi.org/10.1038/nmat1984
- 94. Magagnosc, D.J., et al. (2013) Tunable Tensile Ductility in Metallic Glasses. Scientific Reports, 3, 1096. https://doi.org/10.1038/srep01096
- 95. Zameer Abbas, S., Ahmad Khalid, F. and Zaigham, H. (2016) Indentation and Deformation Behavior of FeCo-Based Bulk Metallic Glass Alloys. Materials Science and Engineering: A, 654, 426-435. https://doi.org/10.1016/j.msea.2015.12.048
- 96. Zameer Abbas, S., Ahmad Khalid, F. and Zaigham, H. (2017) Indentation Fracture Toughness Behavior of FeCo-Based Bulk Metallic Glass Intrinsic Composites. Journal of Non-Crystalline Solids, 457, 86-92. https://doi.org/10.1016/j.jnoncrysol.2016.11.022
- 97. Packard, C.E. and Schuh, C.A. (2007) Initiation of Shear Bands Near a Stress Concentration in Metallic Glass. Acta Materialia, 55, 5348-5358. https://doi.org/10.1016/j.actamat.2007.05.054
- 98. Pampillo, C.A. (1972) Localized Shear Deformation in a Glassy Metal. Scripta Metallurgica, 6, 915-917. https://doi.org/10.1016/0036-9748(72)90144-5
- 99. Greer, A.L., Cheng, Y.Q. and Ma, E. (2013) Shear Bands in Metallic Glasses. Materials Science and Engineering: R: Reports, 74, 71-132. https://doi.org/10.1016/j.mser.2013.04.001