Journal of Geoscience and Environment Protection
Vol.09 No.03(2021), Article ID:107789,52 pages
10.4236/gep.2021.93007
Linear Global Temperature Correlation to Carbon Dioxide Level, Sea Level, and Innovative Solutions to a Projected 6˚C Warming by 2100
Thomas F. Valone
Integrity Research Institute, Beltsville, USA

Copyright © 2021 by author(s) and Scientific Research Publishing Inc.
This work is licensed under the Creative Commons Attribution International License (CC BY 4.0).
http://creativecommons.org/licenses/by/4.0/


Received: October 13, 2020; Accepted: March 14, 2021; Published: March 17, 2021
ABSTRACT
Too many climate committees, conferences, articles and publications continue to suggest a one and a half (1.5˚C) to two degrees (2˚C) Celsius as an achievable global limit to climate changes without establishment of any causal link to the proposed anti-warming mechanism. A comprehensive review has found instead that observationally informed projections of climate science underlying climate change offer a different outlook of five to six-degree (5˚C - 6˚C) increase as “most accurate” with regard to present trends, climate history and models, yielding the most likely outcome for 2100. The most causative triad for the present warming trend from 1950 to the present is identified in this paper: 1) the tripling (3×) of world population; 2) the quadrupling (4×) of carbon emissions; and 3) the quintupling (5×) of the world energy consumption. This paper presents a quantitative, linear global temperature correlation to carbon dioxide levels that has great predictive value, a short temporal feedback loop, and the finding that it is also reversible. The Vostok ice core temperature and CO2 values for the past 400,000 years, with past sea level estimates have produced the sufficiently evidential “Hansen’s Graph”. Detailed analysis results in an equation for global average temperature change and an indebted, long-term sea level rise, from even a 20 ppm of CO2 change above 290 ppm, commonly taken as a baseline for levels before 1950. Comparison to the well-known 800,000 year old Dome C ice core is also performed. The best-performing climate change models and observational analysis are seen to project more warming than the average model often relied upon. World atmosphere, temperature, and sea level trends for 2100 and beyond are analyzed. A laboratory experiment proves the dramatic heat-entrapment capability of CO2 compared to pure air, which yields insights into the future global atmospheric system. Policy-relevant climate remediation, including gigaton carbon capture, zero and negative emissions and positive individual action, are reviewed and updated, with recommendations.
Keywords:
Climate Change, Global Warming, Global Cooling, Average World Temperature, Thermal Forcing, Carbon Dioxide, PETM, Carbon Emission, Carbon Capture and Storage, Carbon Sequestration, Heat-Trapping

1. Introduction
This paper is an extension of the work originally presented at the IEEE International Symposium on Technology and Society (ISTAS) in 2019 (Valone & Panting, 2019). This extended work includes educational slides used at ISTAS and most recently at COFE12 (https://www.integrityresearchinstitute.org/cofe.html) which present a compelling case for the irrefutable necessity of carbon capture and storage (CCS) at the gigaton level, based on the record-breaking emissions amount already in the atmosphere. Rather than the extremely conservative estimates proposed elsewhere (COP24, 2018; Lawton, 2019b; Masson-Delmotte et al., 2018; U.S. Global Change Research Program, 2018; UN Environment, 2018; Le Page, 2017), the “most likely” trend is reviewed (Carnegie Institution for Science, 2017) and the most practical global solution or “vaccine” for a stabilization and even reversal of our contagious hothouse disease is presented. Anthropogenic fossil fuel carbon emissions and emission rates are now both increasing annually in several major countries in the world at an accelerated rate. As will be seen, the levels also surpass what the earth as seen in the past 400,000 years (Climate Change, n.d.) as well as exceeding the maximum CO2 levels ever reached in the past 800,000 years (Lüthi et al., 2008) that is therefore comparable to the PETM of 55 million years ago. The unmitigated growth of carbon emissions worldwide reached a record 37 billion tons of CO2 (in one year) at the end of 2018, with the U.S, India and China leading the increase (Dennis & Mooney, 2018). The total carbon emission growth in 2017 was only 1.7 percent while carbon growth rate for 2018 shown in Figure 1 increased 2.7 percent. As for China, coal accounts for about 60 percent of China’s total energy consumption (Dennis & Mooney, 2018). Though the COVID-19 event has temporarily put a dent in rising carbon emissions, experts believe the anticipated rebound will make up for all of the lost carbon emissions ground in only the next few of years. Figure 2 shows a recent segment of the world’s steadily increasing, heat-trapping, atmospheric CO2 record through NOAA’s Earth System Research Laboratory at the Hawaiian Mauna Loa Observatory since 1959. The monthly values are seen in Figure 2 as seasonally oscillating red dots with dashes in between. The black dotted line with the square symbols represents the averaging correction for the seasonal cycle. The latter is determined as a moving average of seven adjacent seasonal cycles centered on the month to be corrected, except for the first and last three and one-half years of the record, where the seasonal cycle has been averaged over the first and last seven years, respectively. The amount of CO2 emissions from fossil fuel burning comes from the Open-source Data Inventory for Anthropogenic CO2 (ODIAC) and is based on economic data. Most of the emissions are in the Northern Hemisphere (NOAA, 2021-d).

Figure 1. Global carbon dioxide emissions have quadrupled since 1950 (Dennis & Mooney, 2018).

Figure 2. NOAA global CO2 records from Hawaii (NOAA, 2021-a).
2. Temperature and Carbon Dioxide Levels in Earth’s History
Not only does such increasing carbon pollution stay in the atmosphere about 100 years (CO2 from early Model T Fords still lingers in the air today) but as a major greenhouse gas, there is overwhelming evidence that it directly relates to the documented global temperature increase (Hansen, 2010). This can be further corroborated with the historical records of carbon dioxide from the Antarctic Dome C ice core analysis of air bubbles, going back, as far as 800,000 years (800 kY) (Lüthi et al., 2008).
Figure 3 shows the cumulative gigatons (109 tons) of carbon from fuels already burned, known reserves, and future emissions of oil, gas, and coal. A valuable equivalent relationship of 1 ppm of CO2 added to the atmosphere is equal to an additional 2.12 billion tons of carbon, or times 3.67 to equal about 7.77 billion tons of CO2 (Hansen, 2018). CO2 is well-known to be a long wavelength-trapping hothouse gas that absorbs heat (Fischer, 2011). “Scientists use air trapped in the ice to determine the CO2 levels of past climates, whereas they use the ice itself to determine temperature. But because air diffuses rapidly through the ice pack, those air bubbles are younger than the ice surrounding them” and therefore, can affect the perceived time correlation (Ferguson, 2013).
Energy consumption globally shown in Figure 4 is the main driver of the

Figure 3. World cumulative fossil fuel emissions (Glikson, 2013).

Figure 4. Global energy demand, quintupled since 1950, is 90% fossil-fueled (Ritchie & Roser, 2020).
exponential increase in emissions (Climate Change, n.d.). Besides matching the temperature changes closely, one major fact seen in Figure 4 is the maximum atmospheric concentration of carbon dioxide over the past 420,000 years. The CO2 levels clearly have never exceeded 300 ppm worldwide even through four ice ages.
However now, late in the Holocene, global CO2 level has pushed upwards past 410 ppm as seen in Figure 5 even a couple of years ago in the summer months (NOAA, 2021-b).
To give us a broader picture of the temperature variations over the past 500 million years, Figure 6(e) illustrates the present (human-dominated) Holocene epoch previously mentioned and Figure 6(d) shows the Pleistocene epoch (Bredenberg, 2012). Moving to the present, Figure 6(e) is a plot on a logarithmic scale with the most recent data points in the Holocene epoch on the right, showing the remarkably fortuitous temperature stability of the past 10,000 years and a projection of almost +5˚C (9˚F) for 2100 (second red dot on top). Figure 6(b) further illustrates the important Paleocene-Eocene Thermal Maximum (PETM) event that is the closest comparison with what we will face into the 22nd century after we reach 800 ppm of CO2, unless drastic action is taken to create gigaton carbon capture (see Section 9 and Figure 22, Figure 23).
Focusing in from Figures 6(a)-(e) toward the most recent thousands of years, Figure 7 presents a plot of the temperature and CO2 data from air bubble analysis of the Vostok Station Antarctica ice core. In 1999, the Vostok ice core 420,000-year record of carbon dioxide was published by Petit et al. (1999). Figure 7 therefore is a definitive graph of atmospheric carbon dioxide and global temperature (Celsius = Centigrade) based on deuterium concentration in the ice

Figure 5. Sixty years of Global CO2 levels, 1958 to 2018 (NOAA, 2021-b).

Figure 6. (a)-(e) Geological epochs and earth atmospheric temperature (˚C, ˚F vs. 1960-1990 avg.) (Bredenberg, 2012).
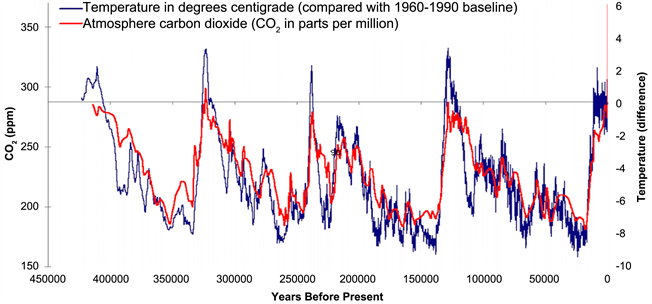
Figure 7. CO2 and temperature over past 420,000 years (Watts & Pacnik, 2012).
core in the vicinity of air bubbles that are sampled for CO2 levels. Furthermore, it can be examined closely for the previously noted leading temperature which is followed by a remarkably close, matching trend in CO2 at a later date in time. However, the opposite is also true: red-lined CO2 also occurs prior to the blue temperature trend line implying causality as it entrains temperature levels that rise or fall in synchrony with its heat-trapping ability. Therefore, paleoclimatology teaches us that a significant forward and reverse temporal correlation between atmospheric temperature and CO2 levels is apparent in the past and probably very useful in managing earth’s future. In other words, whichever variable changes first, the other will invariably follow in the same direction in a proportional manner which is quite astonishing and suggestive of a global warming remedy (Watts &Pacnik, 2012). Note the red CO2 line on the far right of Figure 7, shooting up at the “0” Years Before Present is projecting an inconvenient, corresponding +6˚C temperature for the future earth’s atmosphere, that will inevitably be realized by the turn of the century or very early in the 22nd century, as a consequence of a “business as usual” scenario.
Such a tight correlation of the abovementioned two variables can be understood scientifically in terms of climate forcing or thermal forcing that generates a real motive force, the same way a mechanical force causes an object to move. This positive climate or radiative forcing involves shifting the balance, due to an increase in heat-trapping gasses (often labeled “GHG” for “Green House Gasses”), such that the world gains heat and the climate warms (Figure 8). As the climate warms, the earth will emit more infrared (IR) radiation to space, as a response to the radiative forcing. This extra energy exchange is quantified in watts per meter squared (W/m2) entering the globe near the top of the atmosphere until a new equilibrium level is achieved between energy gained and lost at the top of the atmosphere. In the meantime, the earth is now experiencing wider swings (system oscillations) of hot and cold weather than ever before, as global warming continues its upward trend. As early as 1967, climate models were linking increases in atmospheric CO2 to global temperature (Manabe & Wetherald, 1967).
An important corroboration that refutes arguments from climate denialists is seen in Figure 8, since it is from a separate ice core of Antarctica, the Dome C, that stretches back to 800 kY from the present. The Figure 8 graph includes all three major GHG (CH4, NO2, CO2) forcing agents. Here again is the remarkably close correlation that is undeniable between the GHG energy density (green) in watts per square meter (W/m2) and the global temperature (red). It can be reasonably expected that as the green line (right side) launches into the 4 W/m2 region far above previous levels for the 2000 “Date” in Figure 8, the global temperature (left side) will follow the same pattern to an equivalent level in a short amount of time. Here the ratio of temperature and forcing is about 1.5˚C to each W/m2 reaching the top of the atmosphere. According to the ordinate axis in Figure 8, this GHG climate forcing level on the far-right side of the graph independently corresponds to a global temperature of 6˚C on the far-left side of the graph (OSS Foundation, 2021). How scientists and the public could have overlooked this accurate, historic 800 kY recorded correlation, which is a priceless, quantitative prediction of future global warming is perplexing and unexplainable.
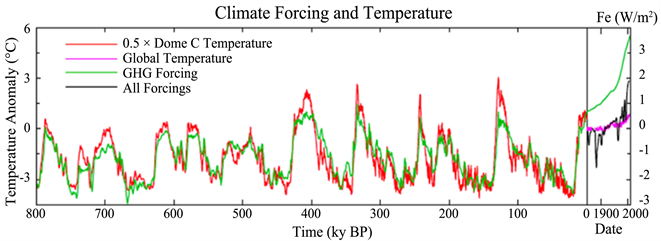
Figure 8. Climate forcing (W/m2) of CH4, N2O, CO2 and Global temperature (from Dome C ice core data) for the past 800,000 years (OSS Foundation, 2021).
3. Three-Variable Proportional Equation for Temperature, Carbon Dioxide, Sea Level
Figures 9(a)-(d) is the best compilation, provided by James Hansen from NASA Goddard Institute for Space Studies in 2006, including the off-the-chart famous “hockey stick” data point of 377 ppm (labeled “CO2 level”) in 2006, up to past 410 ppm in 2019. The CO2 data point in question is significantly far above the highest point in Figure 9(d) and also above the graph in Figure 7, equaling a huge 45% increase in worldwide carbon dioxide levels since 1850 (Bowen, 2006). All three Figure 7, Figure 8 and Figures 9(a)-(d) are in agreement with the
 (a)
(a) (b)
(b) (c)
(c)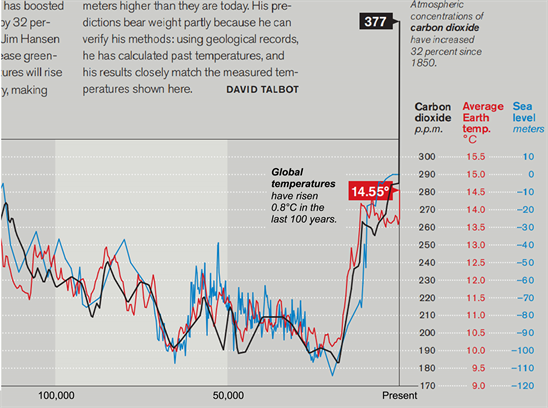 (d)
(d)
Figure 9. (a) “Hansen Graph”—Average global CO2, temperature and sea level data compared to year 1900 baseline (14.55˚C) from 400 kY to 300 kY BCE; (b) “Hansen Graph”—Average global CO2, temperature and sea level data from 300 kY to 200 kY BCE (black = CO2, red = temp, blue = sea level); (c) “Hansen Graph”—Avg. global CO2, temperature and sea level data from 200 kY to 100 kY BCE—ice ages decline to lowest levels in midpoints of 9(a-c) except for 9(d); (d) “Hansen Graph”—Global CO2, temperature, and sea level data compared to year 1900 baseline (14.55˚C). Note: CO2 at 377 ppm in 2006 but higher than all CO2 levels (Bowen, 2006).
same temperature projections of a corresponding 6˚C temperature increase for 2100 seen in Figure 11, Figure 15 and Figure 16. Hansen at the Goddard Institute of Space Studies used the 1999 Vostok data, to add temperature data with calculated historic sea levels, along with concurrent carbon dioxide levels for the same period, matching maximum and minimum level perhaps in order to provide a similar visible range of the three variables on the same graph.
Thus, Figures 9(a)-(d) is composite of a further development of an entrainment correlation between temperature and GHG forcing, since sea level also shows a tight correlation to both variables (https://www.integrityresearchinstitute.org/climatechart.pdf). Massachusetts Institute of Technology (MIT) is credited with the editorial choice of the Technology Review journal to include the Figure 10 table of data points for the three variables (CO2, temperature, sea level) from Figures 9(a)-(d). It is quite rare that such a table of data points is included in journal articles anymore but here it was essential for conveying the exacting relationship between the three variables. Figure 10 offers such an unexpectedly linear, proportional relationship of the three variables (carbon dioxide, temperature, sea level) with whole numbers, in black, red, and blue, that the table data can be converted into an equation and thereby create a “Key” to Figures 9(a)-(d). Thus, a compact form of Figures 9(a)-(d) and Figure 10 can be expressed, after due examination of the three columns, in a convenient three-variable Equation (1), using real values for the variables, such that if ∆C is a negative change hopefully in our near future, ∆T and ∆S will follow since they are equal to a negative number.
(1)
where ∆C is the +/− change in CO2 in ppm, with a corresponding ∆T in degrees Celsius, and ∆S being sea level in meters. This becomes very analytical with the (before 1950) historically stable, assumed “zero values” of So = 0 m, Co of 290 ppm, and To = 15˚C from Hansen’s Figure 10, we find that putting those ∆ values

Figure 10. Hansen’s data table accompanying Figures 9(a)-(d) (Bowen, 2006).
in Equation (1), the next scaling point for the Y-axis has a linear limit. This author has determined that Equation (1) can be reliably applied for a limited extrapolated range, up to around 500 ppm, where it begins to diverge. Equation (2) represents a more convenient precise form of Equation (1), also expressed as a “Key” with conversion terms equaling each other as Hansen found in Figure 10. Therefore, a composite graph and composite equation resulting from Figures 9(a)-(d) and 10 can be drawn to compress the data into a compact form of Equation (2), for a proportional variable change. This author also calls attention to the explicit +/− sign, gleaned from the Figures 9(a)-(d) graphs, which signals the secret of reversing global warming:
(2)
Such a composite form of Figures 9(a)-(d) and 10 is presented in Figure 11, which was initially created in 2006, faithfully representing the information conveyed by Hansen and the Vostok record. Note that global sea level rise has a maximum value based on the total amount of land-locked glacial ice and has never been higher than 10 meters above present level in the past 400,000 years. Temperature rise is also expected to become less linearly dependent on CO2 as the rise surpasses +10˚C perhaps but may not have a maximum. This graphic of the “Great Acceleration” of climate change has been updated on the Integrity Research Institute’s website, which consolidates and annotates Figures 9(a)-(d) (Valone, 2019).
4. Prophetic 1988 NASA Paper Announced the Greenhouse Effect
Recently called the most accurate 30-year climate projection that any climatologist
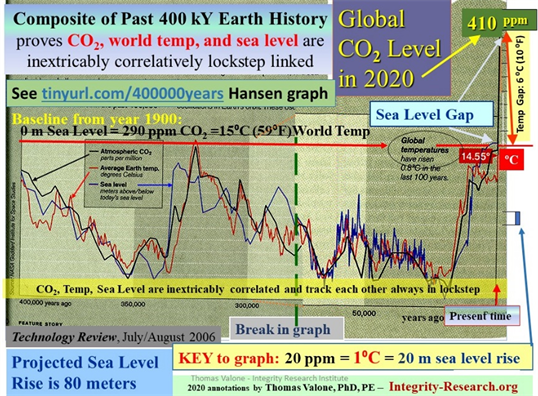
Figure 11. Annotated analytical update of Hansen graph for 2019 (Valone, 2019).
has achieved, Dr. James Hansen’s famous paper of 1988, was the first to contain predictions of a global “greenhouse effect” from a 3-D model developed on the supercomputers at NASA Goddard Institute for Space Studies but using the onerous phrase “climate forcing” (Hansen, 1988). Since such a concept was not yet accepted by the public, the paper was shunned by academic critics and Hansen was declared to be “wrong” by most of the media at the time. However, analyzing Hansen’s projection reproduced in its original form in Figure 12 from that 1988 paper (Figure 3(a), p. 9247), we easily discover a high degree of accuracy for temperature prediction, with the benefit of present-day global temperature reports. The three lines for Hansen’s data projections are Scenario A with an upper -о- line, B being the middle line -∆-, and C with -□- in the lower line of Figure 12, with Scenario B found to be right on target for 2019. In Figure 13, a 2018 evaluation of Hansen’s 1988 paper offered some averaging information and comparative climate modeling. This 2018 report, thirty years after Hansen’s original projections, show that his orange, middle line of Scenario B to be the most accurate prediction of the rise in global temperature in 2018 (Gavin, 2018). We find that most sources agree that the earth has reached a 1.2˚C increase in worldwide average temperature from the 1950-1960 baseline.
Therefore, an updated assessment actually vindicates Hansen’s Scenario B projection to 2019 in Figure 12, which provided ample motivation for this present author’s review. Hansen’s courageous 1988 paper is the major reason for publication of this review paper in 2019, in honor of Hansen’s pioneering accuracy in the highly controversial science of climatology and temperature projection three decades ago. Even more impressive is Figure 14, an astonishing projection to 2060 by Hansen, from the 1988 article (Figure 3(b), p. 9247), though

Figure 12. Original Hansen temperature projection to 2019 (Hansen, 1988).

Figure 13. 2018 evaluation of Hansen’s projection (Gavin, 2018).

Figure 14. Original Hansen temperature projection to 2060 (Hansen, 1988).
it was more speculative during that era, by calculating such large future temperature change for way in the future, based on Scenario A. However, Hansen’s graph in Figure 14 is presently more likely with today’s climate predictions than any other previously cited climate reports, matching business-as-usual climate projections, with no reductions, e.g., IPCC RCP 8.5 (Riahi et al., 2011). The most realistic climate models today agree with Hansen’s 1988 projection to 2060.
5. Climate Model Comparisons with Hansen
Global temperature also is a fundamental climate metric highly correlated with sea level, which implies that keeping shorelines near their present location requires keeping global temperature within or close to its preindustrial Holocene range. However, global temperature excluding short-term variability now exceeds +1˚C relative to the 1880-1920 mean and annual 2018 global temperature was almost +1.3˚C, which is right on the mark with Hansen’s Scenario A or B in Figure 12 for 2019.
It has been shown, as Hansen points out, “that global temperature has risen well out of the Holocene range and Earth is now as warm as it was during the prior (Eemian) interglacial period, when sea level reached 6 to 9 meters higher than today. Further, earth is out of energy balance with present atmospheric composition, implying that more warming is in the pipeline … [and] the growth rate of greenhouse gas climate forcing has accelerated markedly in the past decade” (Hansen et al., 2017).
Probably the most provocative and disturbing for any audience is a composite temperature trend graph which “reduces uncertainty” (says Nature’s editorial introduction) in Figure 15. The best performing models are shown in dark red, projecting above 5˚C. Climate models generally agree that greenhouse-gas emissions will continue to raise global temperatures, but the amount of warming predicted varies considerably. To narrow the field of probability, Patrick Brown and Ken Caldeira at the Carnegie Institution for Science in Stanford, California, assessed a plethora of current climate models. They found that some models

Figure 15. Global temperature projected to 2100 with recent journal corroboration (Brown & Caldeira, 2017).
more accurately simulate the amount of radiation entering and leaving the atmosphere, a flow known as Earth’s energy budget, than others (Nature, 2017).
The team combined a number of models but reduced the influence of those that less realistically represent the energy budget. It predicts at least a five degree (5˚C) increase by 2100 (red line) with an uncertainty range that reaches 6˚C. Much is known about the present exponential trend in temperature up to 2020 but with Brown and Caldeira’s integrated approach, the climate models are merged to include “observationally-informed projections” up to 2100. Thus, an averaging or median is achieved that statistically ensures high reliability and assurance of accuracy (Brown & Caldeira, 2017). Though it has been subject to a few online climate denialists, the majority of reviewers have embraced Brown and Caldeira’s conclusions, which, as seen from ice core data, is more consistent with the integrated relationship between CO2 and global temperature in the earth’s past. A summary (2017) YouTube video by coauthor Patrick Brown, and https://patricktbrown.org/, provide additional support for their Nature article. These findings are a rude awakening. The extreme conditions which we know are inherent in such a five to six degrees (5˚C - 6˚C) increase have been well documented over ten (10) years ago. A National Geographic 90-minute online video is one of the best, starting with the usual 15˚C baseline which was the stable global average up until around 1980. “But what if the global temperature increased by another degree? According to Mark Lynas, author of Our Final Warning: Six Degrees of Climate Emergency, the changes would no longer be gradual. Greenland’s glaciers and some of the lower lying islands would start to disappear. At 3°C higher the Arctic would be ice-free all summer, the Amazon rainforest would begin to dry out and extreme weather patterns would become the norm. An increase of 4°C would see the oceans rise drastically. Then comes the twilight zone of climate change, if the global temperature rises again by another degree. Part of once temperate regions could become uninhabitable, while humans fight each other for the world’s remaining resources. The sixth degree is what is called the doomsday scenario as oceans become marine wastelands, deserts expand and catastrophic events become more common (National Geographic, 2020).”
6. Earth’s Giant Ice Sheets Are Melting
At least one-third of the Himalayan glaciers, among the world’s most vital water resources, are projected to melt by the end of this century even if the most ambitions steps to halt global warming are achieved, according to a 2019 report. Furthermore, nothing major can apparently be done to impact global greenhouse gas emissions in just a few decades, unless very aggressive carbon capture and storage (CCS) is implemented in the hundreds of gigaton range (see Section 11.4). Therefore, glacier melting is projected to continue at the present pace which will cause the loss to rise to two-thirds of all Himalayan glaciers by 2100. Mass emigration from India as a result of such an environmental stress from the Himalayan region cannot be underestimated (Subramanian, 2019). This conclusion assumes a business-as-usual trend will continue worldwide.
Arctic sea ice (Figure 16) has also been undergoing a steady decline (12.8%/ decade) since the middle of the last century and monitored by satellite starting in 1979 (Arctic Sea Ice Minimum, 2019). Based on an assessment of the subset of models that most closely reproduce the climatological mean state and 1979 to 2012 trend of Arctic sea ice extent, a nearly ice-free Arctic Ocean in September before mid-century is likely with high GHG emission scenarios. The total volume of ice in September, the lowest ice month, declined by 78 percent between 1979 and 2012, the record low year, according to an analysis by the University of Washington in Seattle, Pan-Arctic Ice Ocean Modeling and Assimilation System, a top source for tracking ice volume. Furthermore, Veerabhadran Ramanathan, at the Scripps Institution of Oceanography, states that entirely ice-free summers, could add another half-degree Celsius (0.9 degrees Fahrenheit) of warming on top of whatever else the planet has experienced by that time. This is a well-known phenomenon that a dark, blue ocean will absorb twice as much sunlight as a white, ice-covered Arctic ocean (Mooney, 2018).
Arctic land-based permafrost also holds more than twice as much carbon in its frozen “permafrost” soil as earth’s atmosphere and is already melting as temperature rises, releasing its trapped carbon. In one 2015 summer, over nine (9) million hectares of forest in Alaska’s and Canada’s Arctic region burned, which set a record. Studied by the Woods Hole Research Center in Falmouth, Massachusetts, destabilizing the soil with such fires and creating microponds, the fires thawed permafrost in a wild zigzag pattern to over a meter deep, releasing locked

Figure 16. Arctic Sea ice loss from 8 down to 5 million square kilometers (Arctic Sea Ice Minimum, 2019).
methane (Kintisch, 2015). In 2018, sixty wildfires raged in the Swedish Arctic Circle after a hot, dry summer. This appears to be a trend as more and bigger blazes are reported in other far northern regions like Greenland, Alaska, Siberia, Ukraine, and Canada. Furthermore, 2017 was the worst fire year in Europe’s history, causing destruction to thousands of hectares of forest and cropland in Portugal, Spain and Italy, as late as November (Watts, 2018). In 2019, New Zealand reported record wildfires burning for over a month, covering more than 2300 hectares (5700 acres) with a 25-kilometer perimeter, with the evacuation of thousands of residents (Lyons, 2019). As this paper in being submitted, a combined area in California from three separate fires, said to be the “size of Delaware” is burning out of control (NPR report, 8/28/20).
As to the Antarctic continent, which holds the most land-locked ice in the world, the West Antarctic Ice Sheet is the focus of attention for the world’s climatologists. So far, Antarctica has lost over 3 trillion (1012) tons of ice in the past quarter century but has tripled its ice loss in the past decade, according to a recent study (Rice, 2018).
Figure 17 brings the Antarctic facts into more clear focus with a 21st century graph of the Antarctic ice sheet loss in gigatonnes (109) of mass (1 U.S. ton = 0.907 metric “tonne”) from the Australian Academy of Science who are the closest to the South Pole activity. Professor Matt King and his colleagues at the Academy compare this with the entire ice sheet estimate of about 25 quadrillion tonnes (25 × 1015 tonnes) (King & Allison, 2019).
Besides the tripling of ice loss in Antarctica cited above for recent years, Antarctica has sextupled its ice loss (about six times) since the 1970s, according to new research. This recent finding shows that a new extraordinary phenomenon of exponentially increasing ice loss rate is taking place on the southern continent, which will be the only heat sink left on earth after 2060 or so. From 40 billion tons loss per year on average during the 1980s, Antarctica rose to between

Figure 17. Antarctic ice sheet loss (Thousands of gigatons) (Ice Sheets, n.d.).
219 and 252 billion tons per year after 2009. All of its major ice sheets have been studied and reported to be “alarmingly vulnerable” (Mooney & Dennis, 2019).
To complete the picture of earth’s major ice sheets, we examine Greenland’s land-locked ice mass variation since 2002 with the precision of NASA’s Gravity Recovery and Climate Experiment (GRACE) satellites, with more expected from GRACE Follow-On (mid-2019). Note that major “land-locked” glaciers occur primarily in Greenland and Antarctica which are the only glaciers that can contribute to sea level rise, once they melt and flow into the ocean, slide into the ocean while still frozen, or simply break off of an ice shelf that may be suspended over seawater.
Greenland’s ice mass variation since 2003 is seen in Figure 18, which holds the second largest store of land-locked ice in the world. The seasonal variations are clearly seen, similar to the seasonal variations in carbon dioxide recordings of Figure 2, yielding one more connection between CO2 and temperature. A major reason for including Greenland’s ice loss is that upon comparison to Figure 17, it becomes abundantly clear that Greenland is losing twice as much ice mass as Antarctica, in the same time frame (Ice Sheets, n.d.). Such a major influx of fresh water from Greenland into the Atlantic Ocean, with less density than salt water, has also been connected to the decrease in flow of the North Atlantic Conveyor System (NACS) by about 20% in the past few decades. This has major implications for Scandinavia which, along with the UK, receives returning NACS warm sea water current northward from the Mediterranean. Ironically, if the NACS slows down much more, which in all probability it will with present GHG emission trends, the Scandinavian countries may experience a short term cooling trend as the rest of the world continues to rise in average temperature, since there will be a deprivation of the warm northward NACS current to Scandinavia, until global temperature rise dominates. Greenland has also made the

Figure 18. Greenland’s recent ice mass loss (gigatonnes) (Ice Sheets, n.d.).
news recently because rain-associated melting became twice as frequent in summer and three times as frequent in winter, for the past several years. “Rain now seems to account for 28 per cent of the [Greenland’s] ice sheet melt (Vaughan, 2019).”
All of the ice sheet data above brings home the extreme heat increase which the three major glacial ice masses are experiencing presently. This scientific information should serve to counter much of the public disbelief that exists today in regards to the effect of a single 1˚C average increase in temperature globally, since the rapid increase in ice loss has accelerated in the past few decades at the same time this thermal forcing has occurred. Confronting the climate denialist problem and a general lack of comprehension of the impact of several degrees Celsius of temperature increase is a serious problem (Beyond Belief with George Noory, 2019). In 1967, Manabe and Wetherald published the first accurate climate model ever. Analyzing absorptivity and albedo, they predicted a 2˚C increase as CO2 levels double but regretted that ice sheet modeling was uncertain (Siegel, 2017). Today, the ice sheet modeling has improved but apparently requires continual updating by close monitoring of the actual amount of accelerated melting such as in Greenland, and calving of ice shelves such as in West Antarctica.
It is an honor to cite the pioneering work of James Hansen, who in 1988 stated that human-made climate change was real and who was the first climate scientist to publicly state, “the greenhouse effect is here,” besides “climate forcing” and then several years later, publishing the “Hansen Graph” in 2006 (Figures 9(a)-(d)) with a surprisingly linear table of historic global temperature, CO2, and sea level values (Figure 10), so future trends of all three can easily be extrapolated and calculated, based on the past correlations between these climate variables.
7. Atmospheric Carbon Dioxide Levels Projected to 2100
A frequent question, often asked by the public, is whether CO2 emissions are going to level out or reach a “peak” soon? The 9th UN Emissions Gap Report (UN Environment, 2018) states there is “no sign of peaking” and emphatically issues a warning that carbon emissions are actually increasing. In Figure 19, the A2 line for CO2 levels is “business as usual” and most likely by economists and policy makers, according to the University of Washington (Battisti, 2011). It is estimated that humans have emitted about 550 gigatonnes of carbon (multiply by 3.67 for CO2 gas amount) from 1870-2013 (Levin, 2013). In addition to this global atmospheric volume of human-created CO2, the world presently adds more than 35 gigatons of CO2 emissions each year to the atmosphere, which stays there for at least a century or more (CBS News, 2012). All three recent climate reports cited earlier acknowledge the Paris limits are not happening (UNEP, 2018; NCA4, 2018; COP24 KATOWICE, 2018). No major country seems willing to reverse its long-standing use of fossil fuels with a carbon tax, even if the entire tax goes to funding more renewable energy.

Figure 19. Carbon dioxide projection models to 2100 (Battisti, 2011) (ppm).
As global energy demand from a growing world economy and related carbon emissions keep increasing (2.3% last year), as they are projected to do, a compounding factor is the need for extra heating and cooling in regions hit by the predicted oscillations in the earth’s climate as it seeks a new equilibrium level (Temple, 2019). The residential cooling problem is also a contributor to global warming with window AC units set to more than triple by 2050. “RMI.org estimates that the amount of energy that will be required to power the new 4.5 billion window air conditioners expected by 2050 is equivalent to the current electricity demand of the United States, Germany and Japan combined. Growth in the demand for air conditioning is already outpacing growth in solar power, with new residential air conditioning units worldwide consuming approximately 100 GW of energy in 2017, compared to 94 GW of new solar energy generation” (McKenna, 2018).
Besides HFCs from leaking AC units and methane from various sources, including vast regions of tundra permafrost, the single most important and most potent driver of global warming is still dominated by the manmade CO2 level worldwide that is rapidly increasing in rate and quantity. The proof of it is the intrinsic nature of the infrared absorption bands of carbon dioxide gas. However, a simple demonstration of its heat absorption capacity is warranted and quite convincing for all of those readers who may still doubt the atmospheric sensitivity to the specific carbon dioxide concentrations cited in this paper, in parts per million (ppm).
8. Carbon Dioxide Heat Entrapment Demonstration
The infrared absorption bands of CO2 may be difficult to understand. Therefore, in one case, researchers used an infrared (IR) camera attached to glass chamber slowly filling with CO2 gas. With a candle flame used to trigger an image on the infrared camera, sufficient CO2 gas in the glass chamber between the gas and the camera literally absorbed all of the IR emission from the candle, making the burning candle “disappear from view” as the CO2 absorbs all of the IR heat. This visual demo is on YouTube.
Similarly, in another case, a more simplified demonstration of CO2 gas heat absorption capacity has been done with two soda bottles, as in Figure 20. One bottle (#1 on right) is half filled in equal volumes with air and water while the other (#2 on left) is the same but two Alka Selzer tablets are dropped in it to produce some CO2 gas.
A 1 kW spotlight is shown on both bottles equally and the Bottle #2 heats up faster and maintains a higher temperature than the air-filled Bottle #1 (Christensen, 2011). In Figure 20 and Figure 21, it can be seen the air bottle reaches 35.1˚C after an hour but the CO2 gas bottle more slowly reaches a hotter, stable level of 44.0˚C, which is about nine degrees C higher than the irradiated air bottle, proving the heat-trapping property of a significant amount of CO2 mixed with air. The spectral absorption lines of CO2 gas, which can be shown to correlate exactly with the IR emission spectra, cause this dramatic result, trapping the heat rays in Bottle #2 that normally would pass right through air with hardly any interaction or absorption.
Figure 21 shows the results of 60 minutes exposure to a steady 1 kW spotlight input to two 20˚C ambient bottles of air (bottom curve) and CO2 gas (top curve). This simple experiment proves the dramatic heat absorption property of CO2 gas where the air bottle levels out quickly to 35.1˚C but the CO2 gas bottle reaches a


Figure 20. Carbon dioxide experiment setup.


Figure 21. Temperature (˚C) vs. time (minutes) (Christensen, 2011).
steady 44.0˚C at least 20 minutes later. Figure 21 therefore demonstrates the same delay in the earth’s atmosphere which thermodynamically reacts to an increase in CO2 as the temperature attempts to reach a new equilibrium point. Our earth’s previous stable average temperature of 14.5˚C (Figures 9(a)-(d)) was the equilibrium leveling point for 290 ppm of CO2 and the steady solar influx, for thousands of years. However, in the 20th century, the Industrial Age carbon emissions became an increasing, upward slope burden for the earth’s atmosphere to find an equilibrium temperature level as in Figure 21, which takes more time.
Figure 22 is the geologists’ view of the finite amount of time (only about one century) for the global system to balance the input solar absorption (radiative forcing) with output heat radiation. Since the earth’s atmospheric system is so large (estimated at 4 billion cubic kilometers by a difference in two spheres), there is a significant delay of just over one hundred years in the earth’s comparable upward slope of the heat absorption curve to reach a comparable leveling off which would signify an equilibrium level of a system-wide temperature. However, humans worldwide now seem more determined than ever to dramatically increasing global CO2 levels rather than stopping at a certain CO2 partial pressure to allow the earth’s temperature to level off and thereby exhibit a corresponding equilibrium level of input and output heat. Regarding Figure 22, Solomon explains, “After emissions cease, the temperature change approaches equilibrium with respect to the slowly decreasing carbon dioxide concentrations” which she calls “irreversible climate change” (Solomon et al., 2009). This is based on a 7 billion ton carbon (25 gigatons of CO2) annual emissions in 2009

Figure 22. Solomon projection of temperature based on 2009 “7 Gt/yr carbon” (25 Gt/yr CO2 emissions) as compared to 2020 which are averaging 35 Gt/yr (Solomon, Plattner, Knutti, & Friedlingstein, 2009).
which has increased to a 35 gigaton CO2 level annually a decade later, so the leveling off of a long term temperature is more realistically projected to be around 6˚C, as seen elsewhere in this review, and expected to last thousands of years before decreasing to present day levels.
9. Projected Global CO2 Levels as Compared to History
To no one’s surprise anymore, the present global warming trend is manmade. However, the cause can be more precisely traced causatively to the human population levels of the earth, who are now pumping up the CO2 level worldwide at a rate that averages about 100 ppm increase every twenty (20) years for the foreseeable future. If we allow business as usual (A2 line in Figure 19) to continue for decades to come, the earth easily surpasses 800 ppm around 2100 (A2 yellow star in Figure 23) and even 1000 ppm of CO2 soon after into the 22nd century, with worldwide cognitive impairment of human abilities to be expected, as shown in office and classroom studies published on the National Institutes of Health sites (Allen et al., 2016; Satish et al., 2012). The increasing rate of CO2 buildup is not only traced to the world’s population level but can be compared to world population growth. As the world population will quadruple by 2100 (Figure 24) from its previous mid-century level of 2.5 billion to more than 11 billion (Roser, 2019), so the CO2 level worldwide seems to be headed for a tripling from the 290 ppm mid-century baseline to approach 850 ppm around 2100, as its energy consumption quintuples from its mid-century level. The notable difference being the rate of growth. While the world population rate of growth reached a peak of 2.1% around 1975 and has decreased ever since, the world’s population has therefore slowed down in its growth, with a projected leveling out by 2100 around 11 billion people (Figure 24).
In comparison, the carbon emission rate of growth continues to increase

Figure 23. University of Washington composite CO2 computer models extrapolating to 2100, where A2 is the top yellow star “business as usual” reaching 800 ppm by 2100, surpassing B1 “utopia” and even A1B (red star) to match the PETM level over 50 million years ago (Climate Change Lecture Notes, 2011).

Figure 24. World population growth rate (Red line) and total population (Blue shaded area) (Roser, 2019).
(Figure 25), which is even more disconcerting since statistically, no decrease in the emission quantity can be expected at any time this century, until the peak of CO2 emission rate is reached first, just like the world population graph of Figure 24. Since the population graph of Figure 24 clearly shows the rate of growth

Figure 25. Rate of growth of worldwide atmospheric carbon dioxide at 3.0 ppm/year in 2017 and continuing to increase its average (mean) CO2 emission rate, statistically indicating that no immanent peaking in the global carbon dioxide levels are expected this century (NOAA, 2021-c).
peak preceding the leveling out of the magnitude of population by over a century, the CO2 emission graph, by systems theory, can be expected to follow a similar trend: once the CO2 emission rate reaches a peak and starts to descend, then the experts can project a leveling out of the magnitude of the CO2 emissions to occur about a century later as well. This conclusion is incontrovertible and unavoidable. Insights into the cause of the world population spike since 1950 can be gleaned from the 2020 release of the PBS.org video, “The Man Who Tried to Feed the World” which is a story of Dr. Norman Borlaug, the Father of the Green Revolution, also available to rent from Amazon. Dr. Borlaug said he gave the world about 20 to 30 more years when he invented hybrid wheat and other grains that were so prolific and drought resistant that he saved about 1 billion people in India and elsewhere from starvation. However, though he hoped the world would find a solution to the population problem, it had the opposite effect, as we have seen.
The earliest father of climate change, Nobel Prize winner Svante Arrhenius, published a paper in 1896 after studying the earth’s ice age history and the effect of accumulated CO2 level to temperature. His conclusion was that if the CO2 level doubled, the global temperature would go up by about 5 to 6˚C (Sample, 2005). Today, his prediction is heralded as matching the business as usual projections but as we have seen from the Hansen analysis, this temperature projection has been linked to a 410 ppm concentration which is quite short of doubling the CO2 level back in 1896.
The carbon emission growth rate seen in Figure 25 needs to stabilize by leveling out and decreasing, as the population growth rate did fifty years ago, for there to be any realistic projection for the world’s atmospheric CO2 leveling out into the next century where it may finally reach a peak. The question can be asked, “Has the earth ever experienced similar carbon dioxide levels as we expect by 2100 from Figure 19?” As a matter of fact, as seen in the composite Figure 23 from the University of Washington, a complete study of the Paleocene-Eocene Thermal Maximum (PETM) historic precedent has been published, among other recent confirmations (Battisti, 2011).
Not only does Figure 23 show the approximate magnitude of the carbon dioxide increase expected by 2100 for the A2 “business as usual” scenario, which is most likely, but the left side of Figure 23 extrapolates to several million years ago: “Eocene Period 50 million years ago—palm trees flourished in Wyoming and Antarctica was a pine forest—crocodiles lived in the Arctic—deep ocean temperature was 55˚F (today it is ~35˚F)—sea level was at least 300 feet higher than today and the difference in global temperature from our baseline of 15˚C is an additional 15˚C yielding a new average of around 30˚C (86˚F).” Note: this is ten degrees (10˚C) higher than the 5˚C increase predicted from Brown and Caldeira (Figure 15) and Hansen (Figure 14).
There are numerous educational videos with detailed reviews of the PETM on YouTube, such as from BBC Radio (Bragg, 2017) and a very popular, ten-minute PBS-TV summary (with 2.5 million views) (Eons, 2018). Referring back to Figure 6, one can see the PETM peak between the “Pal” and Eocene epochs on the graph. It is important to note that during the geologically short PETM period of about 200 kY, the earth’s atmosphere was gaining CO2 at a rate of about 1.7 billion tons (gigatons) per year by the best estimates, compared to almost 40 billion tons worldwide per year today at our present rate, which is out of control apparently.
The upshot of the PETM period was a 5000 billion ton (5 trillion ton or 5 teraton) increase in carbon dioxide worldwide in a few millennia, which is comparable to the present accumulation rate of excess global atmospheric CO2 just by 2100 (40/yr × 80 yrs = 3 teraton) with a rough estimate of the annual increase we are pumping into the earth’s atmosphere presently on top of the amount already added to the atmosphere from the start of the Industrial Age (about 1 teraton more) which equals 4 teratons by 2100. (Note: The 1 teraton of CO2 is found from taking the present 410 ppm minus the baseline 290 ppm = 120 ppm and multiplying by 7.77 Gt/ppm conversion factor). In Figure 26, Dr. Scott Wing from the Smithsonian Museum of Natural History explains the PETM in comparison to present day carbon emissions and temperature rise (Wing, 2014). In a private email, he also advised this author to be “looking at the broader picture” spanning millennia, to appreciate the earth’s geological timeframe. Presently, we are pumping CO2 into the atmosphere at an unprecedented rate that is about 20 times the rate of increase during the PETM period. We also can compare the PETM period to the present in another context, the volume in parts per

Figure 26. Dr. Scott Wing explaining the PETM temperature enigma and the relevance for today’s global warming climate (Wing, 2014).
million (ppm) that such an increase of CO2 will create worldwide. That has already been calculated by several sources cited above, including Figure 23, where the left-hand vertical axis for the Eocene epoch (PETM in particular) matches the projected 2100 AD level projected, under “business as usual” conditions of 800 ppm of atmospheric CO2.
To determine if the previous quotation for expected temperature rise from the University of Washington is reasonable for the projected 800 ppm of CO2, Equation (1) is used. Taking ∆C to be 800 − 290 = 510 ppm, that ∆C variable goes into Equation (1), so ∆T = 25˚C approximately, to be added to the baseline value of 14.5˚C or 15˚C, yielding 40˚C on the average. This value is an overshoot of about 10˚C higher than the historically agreed upon value of 30˚C found from numerous sources for the PETM period. Figures 7-11 as well as Equations (1) and (2) all rely upon a 420 kY history of earth atmosphere performance with the interaction of a temperature, sea level, and carbon dioxide system within the range seen in Figure 9. As the future and the 50 million year past now are on a collision course, while almost tripling the CO2 levels worldwide, it becomes apparent that the earth relaxes the stringent, linear relationship seen in Equations (1) and (2). For future research, the 30˚C historical temperature level corresponding to 800 ppm of CO2 needs to be put into another, broader range equation that adjusts for the anticipated nonlinearity as the CO2 levels increase to such large amounts, to accommodate a modest reduction in response of the corresponding temperature change in the equation.
It is worth mentioning that, with this perspective, such a CO2-sensitive earth-atmosphere system has also been regarded as a superorganism, in the “Gaia Theory” which teaches that it will inevitably seek equilibrium and balance, as it naturally recycles everything (Lovelock, 1979). “Studying Earth’s global biosphere together, Margulis and Lovelock realized that it has some of the properties of a life form. It seems to display “homeostasis,” or self-regulation. Many of Earth’s life-sustaining qualities exhibit remarkable stability. The temperature range of the climate; the oxygen content of the atmosphere; the pH, chemistry, and salinity of the ocean—all these are biologically mediated. All have, for hundreds of millions of years, stayed within a range where life can thrive. Lovelock and Margulis surmised that the totality of life is interacting with its environments in ways that regulate these global qualities. They recognized that Earth is, in a sense, a living organism. [James] Lovelock named this creature Gaia” (Grinspoon, 2016).
10. Sea Levels Rising at Least One Meter This Century
As Antarctica continues to accelerate its ice loss and melting, it is important to realize the full potential of its ability to create sea level rise by 2100. The projections keep increasing as the IPCC continues to reevaluate the climate models with unexpected temperature rate increases but the range of sea level rise just from the melting Antarctic glaciers is at minimum, three feet (about 1 meter) by 2100. However, as the ice sheets are studied more closely with imminent collapse of one of Thwaites, Dibble, Frost, Holmes, or Denman being inevitable, an upward estimate of 2 to 3 meters or 6 to 9 feet of sea level rise by 2100 looks to be more realistic, from a sudden “rapid ice disintegration” that will result in an additional sea level rise (Rice, 2018). Solomon et al. (2009) also cites thermal expansion of the world’s oceans to add 1 meter of sea level rise if we pass 600 ppm and a few more if we pass 1000 ppm of CO2.
About 125,000 years ago, during the last brief warm period between ice ages (Eemian), earth’s temperatures were barely higher than in today’s greenhouse-warmed world. Yet records show sea levels were 6 to 9 meters higher than they are today, drowning huge swaths of what is now dry land. Scientists have now identified the source of all that water, after analyzing marine sediment cores: a collapse of the West Antarctic Ice Sheet. Glaciologists worry about the present-day stability of this formidable ice mass, which is showing a 30 km crack recently. In fact, some records show that once that ice sheet started to disappear during the Eemian, ocean waters rose as fast as 2.5 meters per century (Voosen, 2018).
Another comparable period in the earth’s history is the last time the atmospheric CO2 amounts were around 400 ppm. This was more than 3 million years ago, when temperature was 2˚C - 3˚C (3.6˚ - 5.4˚F) higher than during the pre-industrial era, and sea level was 15 - 25 meters (50 - 80 feet) higher than today (Lindsey, 2020).
More recently, a team led by Rob DeConto at the University of Massachusetts Amherst suggested that the unstable Antarctic ice sheet alone can contribute more than a meter to sea level rise as in Figure 27, leading to a total rise of about three (3) meters by 2100. He is quoted in Forbes as stating, “If the pace of calving we observe in Greenland today someday becomes widespread around the edges of the vastly bigger Antarctic ice sheet, it could cause very fast sea level rise” (Le Page, 2019b). This Forbes article also recites the common assessment agreed upon by the experts that if the entire Greenland ice sheet melts, the sea level will rise by about 8 meters (26 feet), submerging huge amounts of coastal and low-lying areas around the world, including the majority of the state of Florida.
This brings us to the estimate of the sea level rise stored in the land-locked ice mass of Antarctica. Antarctica’s annual ice losses have accelerated six-fold in the past 40 years in a trend that will push sea levels meters higher in coming centuries just from the present 410 ppm of CO2 level. The East Antarctic ice sheet is thawing at the fringes and adding to rising seas, unlike many past reports which have concluded that the eastern sheet has so far resisted a melt seen on the western side (Doyle, 2019). If the entire Antarctica ice sheet were to melt, sea levels would rise approximately 60 meters, mainly from the East Antarctica ice sheet, with about 3 meters from the West Antarctica ice sheet (Davies, n.d.).
Together the Greenland and the Antarctic ice sheets together make up the majority of land-locked glacial ice worldwide, with an equivalent of almost 70 meters of sea level rise contained in their ice mass. Taking Equation (2) and Figure 11 into account, the Greenland and Antarctica total sea rise is on the

Figure 27. Composite graph showing the average projection of at least a one-meter sea level rise by 2100 under present trends from computer models (Rahmstorf, Perrette, & Vermeer, 2012).
same order of magnitude as the Hansen graph sea level projection of 80 meters. The difference is clearly due to the fact that Equation (2) is a linear relationship which begins to become nonlinear as the CO2 levels surpass the uncharted territory above 400 ppm.
Where the range of 200 ppm to 300 ppm of global CO2 is very linearly correlated to a corresponding value of temperature and sea level, from historical data, the argument put forward by this author and implied by Hansen’s Graph (Figures 9(a)-(d)) is that some limited extrapolation may also be quite accurate. This has now been proven to work up to about 400 ppm, only confined by the fact that the earth holds a maximum of 70 meters of sea level rise known to be locked in glacial ice. Therefore, it is found that Hansen’s Graph of Figures 9(a)-(d), 10 and as summarized in Figure 11, presently predicts the same order of magnitude of sea level rise sometime in the future, within a 10% error. This stark realization forces us to the glaring discovery and inescapable prediction that ALL of the land-locked ice on earth will inevitably melt in the coming centuries, just from the force of 410 ppm of CO2 heat-entrapment of the solar flux as seen in the ironclad Equation (1) and the simple CO2 experiment of Figure 20, Figure 21. Hansen’s Graph is a remarkably correlated, very tight triad of variables which is proven to have a lockstep relation by 420 kY of ice core records. Therefore, simply from historical records, it has to be concluded that Greenland and Antarctica are already gone, like “dead men walking” as they are rigidly compelled to meet the Hansen Equation (2) of the forced linear correlation of sea level, CO2 level, and global temperature. It has taken over thirteen years of analysis since the publication of Hansen’s Graph, with careful comparison to all major climate predictions for the disturbing, inconvenient confirmations to finally be widely published here. It therefore can be seen that Equation (2) has remarkable value and a predictive quality (at least in the range of Figure 10), which could have been put to use worldwide over ten years ago to mobilize public awareness and environmental concern, if only scientists like James Hansen were honored and more highly respected.
David Fenton, chairman of Fenton Communications, recently was on National Public Radio recently, speaking about “Selling the Science of Climate Change” and his conclusion was that “Facts don’t work by themselves. Facts only really work when one, they are embedded in moral narratives. Secondly, facts don’t work unless they’re embedded in stories. And third, the brain only absorbs messages that are simple and are repeated” (Fenton, 2018).
11. Reversing Global Warming by Reducing the Root Cause by 2100 C.E.
Targets for limiting global warming thus, at minimum, should aim to avoid leaving global temperature at Eemian or higher levels for centuries. Such targets now require “negative emissions,” i.e., extraction of CO2 from the air, also called “carbon capture” or “carbon sequestration.” If phasedown of fossil fuel emissions begins soon by declaring CO2 a pollutant, improved agricultural and forestry practices, including reforestation and steps to improve soil fertility and increase its carbon content, may provide much of the necessary CO2 absorption. In that case, the magnitude and duration of global temperature excursion above the natural range of the current interglacial (Holocene) could be limited and irreversible climate impacts will possibly be minimized.
In contrast, continued high fossil fuel emissions today place a burden on young people to undertake massive (tens of billions of tons per year) technological CO2 capture, sequestration, and extraction if they are to limit climate change and its consequences (Hansen, 2010), even if radical schemes to reduce global inbound solar flux are implemented. This concern has been emphasized even more urgently as continued warming into the next century will push the CO2 levels past 1200 ppm, as present rates (see Figure 19, Figure 22). At that level, new findings modeling the effect of high CO2 levels suggest that cloud cover will become increasingly scarce and we could trigger a cloud feedback effect with the loss of stratocumulus clouds which will add 8˚C on top of all the warming up to that point. That means the world could warm by more than 14˚C above the pre-industrial level according to Tapio Schneider at the California Institute of Technology, Pasadena, who led the research. Schneider’s team modelled stratocumulus clouds over subtropical oceans, which cover around 7 per cent of Earth’s surface and cool the planet by reflecting the sun’s heat back into space. They found there was a sudden transition when CO2 levels reached around 1200 parts per million (ppm)—the stratocumulus clouds broke up and disappeared. The reason why this finding applies only to subtropical stratocumulus is that these clouds are unusual. The cloud layer is maintained by the cloud tops cooling as they emit infrared radiation—and very high CO2 levels block this process (Le Page, 2019a).
11.1. Stratospheric Welsbach Seeding
Many extreme ideas for reducing global warming have been proposed and some have actually been implemented in the past several decades without public knowledge or approval. The first to be reviewed, which may be revisited by desperate scientists in the near future, is the US Patent #5,003,186 “Stratospheric Welsbach seeding for reduction of global warming” method of putting aluminum, barium, and cadmium flakes into the atmosphere, ostensibly to reflect sunlight and reduce the absorbed heat rays. Conceived by Ken Caldeira, climate expert who ran computer simulations, he also warned that stratospheric spraying of sunlight-reflecting chemicals could destroy the ozone layer and pose human health risks, which didn’t stop the infamous Dr. Edward Teller, “Father of the H-Bomb”, from calling for a billion-dollar per year sky shield program (Smith, 2017). The patent was licensed to Hughes Aircraft which then became a secret activity of the U.S. military as the patent rights changed hands from one aerospace corporation to Raytheon. The result of the ill-gotten pursuit was the precipitation of poisonous “chemtrails” visible in the sky that rained down on Canadian and American farmlands, among other rural and urban areas, affecting the food crop quality. Raytheon called it the “Deep Sky Program” and discontinued it after numerous public complaints, including from air traffic controllers (reflective particles confused radar), a detailed letter from this author, as well as a House bill HR-2977 that banned chemtrails, back in 2002. There are still solar-shading concepts on the drawing boards of military offices, including the International Military Council on Climate and Security (The Center for Climate & Security, 2019).
11.2. Billion and Trillion Tree Planting Initiatives
Other less radical concepts for carbon capture include the “million trees” concept: “Tree offset calculation is based on a tree planted in the humid tropics absorbing on average 50 pounds (22 kg) of carbon dioxide annually over 40 years: each tree will absorb 1 ton of CO2 over its lifetime” (http://www.carbonify.com/carbon-calculator.htm). Therefore, it has been a popular initiative from several groups to start “billion tree” and even “trillion tree” initiatives, with many posting results online. My inspiration for this is from Hunter Lovins who told me that she planted a million trees in her life. I took that to mean she caused a group of people to effectively act on her behalf to accomplish the task. Of course, the easy calculation from the above is that a million tons of CO2 is removed from the atmosphere for such a feat. However, the challenge to the environmentally aware community is the same one that Richard Branson issued over ten years ago for a $25 million prize (Sullivan, 2007): How can we remove a billion tons of CO2 from the atmosphere each year? Some like the “Trillion Trees” concept with a few billion hectares of forests planted but of course, the trees only will store the carbon as long as they are kept alive, so trees are a temporary fix for storing excess atmospheric carbon (Jean-Francois et al., 2019).
Dr. Hansen recently published a critical warning article for the next generation: “Young people’s burden: requirement of negative CO2 emissions” https://www.earth-syst-dynam.net/8/577/2017/. Once again being very erudite, he explains, the “Earth is out of energy balance with present atmospheric composition” in regards to the previous Eemian interglacial period. Since Hansen does state in the Abstract that temperature is “highly correlated with sea level”, the implication is that the CO2 level is also critically driving the system and requires extraction by the next generation to limit and minimize the “irreversible climate impacts”. However, what is needed is the motivation for a much less expensive scenario of carbon sequestration at the gigaton (billion ton) level, according to this author. It is also worth noting that South Koreans planted an estimated billion trees after the close of the Korean War in the 1950s as revealed while this author was attending the International Conference on the Unity of Sciences (ICUS XXIV) in Seoul, Korea in 2018.
11.3. Green New Deal
The Green New Deal summarized in Figure 28 is a congressional resolution proposed in 2018 that lays out a grand plan for tackling climate change. Introduced by Thomas Friedman in 2007 and endorsed by President Obama in 2008, it was revived by Representative Alexandria Ocasio-Cortez of New York and Senator Edward J. Markey of Massachusetts. The proposal calls on the federal government to wean the United States from fossil fuels and curb planet-warming greenhouse gas emissions across the economy. It also aims to guarantee new high-paying jobs in clean energy industries. Parts of the Green New Deal have already been implemented over the course of the last several years, with government support for programs like making buildings more energy-efficient and training workers with green skills. And of course, the terminology used for the proposal is even older, harking back to President Franklin D. Roosevelt’s New

Figure 28. The proposed Green New Deal summary of benefits (Smith, 2017).
Deal, which put unemployed Americans to work (including with environmental jobs) during the Great Depression (Worland, 2019).
However, from what has been presented in this review so far, it appears that the Green New Deal offers a long-term renewable energy path but without even remediating the past “short term” carbon dioxide buildup in the atmosphere. This is the major problem contributing to temperature and sea rise as in the PETM and needs carbon capture on a grand scale. Furthermore, it has been noted that the Green New Deal parameters as seen in Figure 28 do not include nuclear energy, which supplies about 58% of carbon-free electrical power in the U.S. and simply requires an environmentally safe waste disposal (Titley, 2019).
Safe nuclear waste disposal is not an unrealistic addition to the Green New Deal. Since Yucca Mountain, the options for remediation of radioactive waste have multiplied. Remediation that reduces mass or radioactive lifespan are the most desirable with various scientific methods being proposed and tested. Plasma filtering techniques for nuclear waste remediation is available for vastly reducing the volume by separating out the radioactive portions for burial (Gueroult, Hobbs, & Fisch, 2015). Perhaps the cleanest and most exciting is the photo-transmutation of nuclear waste, driven by lasers. This recently revived process uses low-energy, 7 - 10 MeV X-rays (close to gamma rays) to break up long-lived isotopes into very short half-life waste products that decay quickly and can be included in non-radioactive landfills afterwards (Critchley, 2018). Recently, a new carbon-14 (C14) nuclear battery called a “betavoltaic cell” made from radioactive graphite pulled from spent reactors that is compressed into diamonds is being developed by NDB, Inc.
There also are new nuclear reactor designs, such as thorium molten salt reactors which cannot be weaponized (World Nuclear Association, 2020), or fast neutron reactors that can also burn the long-lived actinide nuclear waste from other reactors (World Nuclear Association, 2020). Adding safe nuclear power, such as cited above, to the Green New Deal would make it more effective for powering the United States, bring in more supporters and increase its wide-range appeal. Adding new emerging energy discoveries for a fast-track, such as “salinity gradient energy converters” from mixing fresh water with saltwater and special electrodes, could generate up to 2 terawatts (2 TW) of electricity from existing estuaries (Ye et al., 2019). The US Department of Energy, along with MIT, supports expanded geothermal energy generation for up to 60 gigawatts (60 GW) of untapped electrical power (U.S. Department of Energy, 2019).
11.4. Carbon Capture and Storage (CCS)
Motivated by multiple reports about the increasing trajectory of global carbon emissions, more and more businesses, policymakers and researchers are coming to the same conclusion: The world must improve and commercialize methods to capture carbon dioxide from the air and store it (sequestration) or find practical uses for it (e.g., making calcium carbonate). The Petra Nova Carbon Capture Project at the NRG Energy W.A. Parish generating station in Thompsons, Texas is a good example of a solution to present carbon emissions. It is one of the world’s largest CCS systems. Petra Nova “captures 1.6 megatons of CO2 each year, equivalent to taking 350,000 cars off the road.” CO2 is pressure-pumped into depleted oil fields to free up more oil. The project reportedly captures and repurposes more than 90 percent of the plant’s carbon dioxide emissions. “As we look out to the middle of the century, one thing is very clear: Going to net zero [emissions] will require carbon capture and storage on a substantial scale,” said Nicholas Stern, a climate economist and chair of the London-based Grantham Research Institute. “And we’re going to need it quite soon” (Mufson & Dennis, 2018). Petra Nova uses CO2-binding amines which are sprayed through fossil fuel exhaust (coal or gas) so it latches onto 90% of the CO2. The solution is then collected and heated so the CO2 bubbles out so it can be captured, pressurized, and removed. The amine solution can then be reused (Service, 2017).
FutureGen Industrial Alliance, Inc. also has conducted a five-year CCS project of injecting 1.1 million metric tons (tonnes) of carbon dioxide into stratographic boreholes each year from coal burning power plants. The boreholes are deep saline formations suitable for carbon sequestration so a long-term conversion into inert carbonate rock is found to be accomplished (Gilmore et al., 2016).
Iron powder seeding of ocean plankton actually can achieve a CCS gigaton range. It is sponsored by Planktos.com in Foster City, California. The level of planktons all over the globe has reduced by 10% since the 1970s. To replenish the ten percent reduction will require between three and five billion tons (gigatons) of the atmospheric carbon dioxide, says David Kubiak, Director of Planktos. This news has created a stir among the environmentalists who have high uncertainty on the probable problems that may arise due to such a huge geoengineering proposal (Powell, 2008). There are also questions as to whether the iron fertilization will significantly reduce the carbon dioxide or if the technique can qualify as viable carbon offsets. Tests to settle the environmental debate are ongoing (Yoon et al., 2018). The technique is not only beneficial to address the problems arising due to climatic changes but also useful to refill the oceanic declining plankton stock.
Another method gaining popularity for carbon sequestration is the possibility of carbon-negative cement used for making concrete. Research shows that depending on the extent thermal fuel supply is decarbonized, a CO2 capture rate between 53 percent and 80 percent will make cement carbon-neutral, and higher CCS capture rates achieve net carbon-negative cement (Rissman, 2018a). This offers the prospect of a world where simply constructing buildings and infrastructure reduce atmospheric CO2 concentrations and contribute to the fight against climate change (Rissman, 2018b).
Of interest to local communities are the examples of CCS applied to coal-fired power plants like New Mexico’s San Juan Generating Station (SJGS), targeted for closure by state lawmakers. Acme Equities LLC wants to refit the 46-year-old, coal-fired plant to use carbon capture and sequestration (CCS) technology. Retrofitting the 847-MW plant with CCS technology would cut carbon emissions by 90% and offer the plant another revenue stream—selling the captured CO2 to help produce oil. Acme is negotiating with local Farmington, N.M., officials to take over the San Juan plant, a major employer in the area, and keeps it operating (Proctor, 2019).
Another breakeven example is Xcel Energy in Minneapolis who promises to deliver 80% carbon-free energy by 2030 and zero-carbon electricity by 2050 with CCS (Best, 2018).
The best may be the world’s peatlands (moors, bogs, or mires) that remove an estimated 370 megatonnes of CO2 each year from the air if left untouched (Time, 9/23/19, p. 54). This compares with another process now being developed by https://www.projectvesta.org/ that seeks to convert, by natural erosion, an olivine volcanic rock into gigatons and even teratons of carbon sequestration. It has been reviewed in all of the major magazines and journals, besides the public’s response with an impressive funding success. Note in Figure 29, from the author’s presentation at COFE12 (https://www.integrityresearchinstitute.org/cofe.html), a mention of Chevron’s announced billion dollar investment that achieves 4 million tons of CO2 each year is also included for comparison.
A $20 million international competition to make profitable products from a gas that otherwise would contribute to global warming has also been conducted. The finalists in the contest sponsored by a U.S. energy company and a group of Canadian oil sands producers first showed in a lab they could use carbon dioxide from power plants to potentially turn a profit making everything from concrete to methanol, an alcohol used in a range of products. The teams had to use 1 metric ton of CO2 daily in the actual competition using flue gas emission from a coal-fired or gas-fired plant. The finalists include C2CNT, a team from Ashburn, Virginia, making carbon nanotubes, and CarbonCure, of Dartmouth, Nova Scotia,

Figure 29. Project Vesta researches billion-ton carbon capture (Project Vesta, 2015; Schuiling & Krijgsman, 2006).
Canada, which already has been using carbon dioxide on a commercial scale to chemically create limestone in concrete. CarbonCure works with almost 100 concrete plants in the U.S. and Canada. The competition was organized by the XPRIZE Foundation (Gruver, 2018).
CarbonEngineering.com in Vancouver, Canada, is demonstrating megaton CCS and commercializing it. Called “Direct Air Capture” the facilities are expanding, aiming for net zero targets to produce clean transportation fuels and large-scale carbon removal.
11.5. Solar Geoengineering
Solar geoengineering and carbon removal technologies often overlap. However, like Welsbach Seeding, solar geoengineering has the same concept in mind—reducing the solar influx by shading for the short term, until enough reduction in carbon emissions has taken place with a well-managed global energy awareness program. Sulfates that produce sulfuric acid in the atmosphere are a proposed scenario, made into tiny droplets on the micron level and put into the stratosphere about 20 km above the earth’s surface. Sulfuric acid droplets, rather than water droplets, will survive in the stratosphere for about a year without evaporating, according to the experts, as they reduce incoming sunlight. About 25 thousand tons of sulfur per year would be needed, which keeps increasing as more carbon emissions occur (Keith, 2013). This proposed short-term plan fails to include a method for carbon capture of the billions of tons of carbon emissions that will be continually added to the earth’s atmosphere however but it gives humanity some borrowed time, at a cost of at least a billion dollars per year. It has been pitched as a “cheap alternative to cutting emissions” (Goodell, 2010).
11.6. Geoengineering to Modify the World
Many other reports and books offer a wide range of geoengineering concepts, many of which have not been tested, like solar sails in orbit around the earth for example innocently called a “veil” (Morton, 2015). The promise is to remake the planet on a global scale but political and scientific opinions often are lacking in the most radical and untested approaches. However, Clive Hamilton is a well-qualified professor of public ethics who has several books on subjects such as climate engineering—exercising technological mastery over nature (Hamilton, 2013), requiem for a species—why we resist the truth about climate change (Hamilton, 2010), defiant earth—the fate of humans in the Anthropocene (Hamilton, 2017) and the global environmental crisis (Hamilton, Bonneuil, & Gemenne, 2015).
Saving a total of 12.1 billion tonnes of annual global carbon emissions in 2030 is also a radical idea, which amounts to about 43 tonnes of CO2 (since the CO2 to carbon ratio is 3.67). The radical idea would eliminate ALL of the anticipated global carbon dioxide emissions in 2030 (Figure 25) and probably well worth implementing globally. The details of the radical idea were formulated in 2015 by Finland’s national innovation fund SITRA, with twelve leading environmental institutions around the world. They require a total of eighteen (18) implementable and existing success stories be expanded worldwide (Lawton, 2019a):
1) Off-Grid Solar, 2) Better Buses, 3) Home Insulation, 4) Improved Electric Motors, 5) Green Mortgages, 6) Rooftop Water Heaters, 7) Responsible Farming, 8) Wood Burning, 9) Reduce Food Waste, 10) Stop Methane Leaks, 11) More Efficient Air Conditioners, 12) Improve Gas Mileage on New Cars, 13) Industrial Efficiency, 14) Reforestation, 15) No More Coal or Wood Stoves, 16) More Wind Turbines, 17) Reduce Deforestation, 18) On-Grid Solar.
Another radical and controversial concept is a diversified portfolio of renewable energy sources, tailored individually for 139 countries, so they can reach 100% renewable by 2050. A wonderful summary by Prof. Jacobson is also on YouTube, (Jacobson, 2017) explaining with video and charts, the feasibility of his team’s proposal. Though several countries have objected to the perceived cost of Figure 30 to make the necessary infrastructure and jobs available, most of the public has embraced his 2050 plan for implementation of an ambitious renewable energy portfolio worldwide (Jacobson et al., 2017). However, it is extremely naïve to think that just implementing such a reduction in emissions by the 2030 to 2050 time frame will magically avoid a 2 degree C global warming, which is already manifesting in local areas around the world. The world’s 139 countries should address the sequestration or carbon capture of billions of tons (gigatons) of atmospheric CO2 to bring the global level back down to a compromise of 350 ppm or lower, in order to avoid the inevitable torture of a 5 to 6 degree C temperature increase by 2100, since CO2 is the driver and the effect is

Figure 30. Proposed 100% renewable energy for 139 countries (Jacobson et al., 2017).
reversible, as proven in the Vostok ice core records. Though the oceans absorb a large portion of the excess atmospheric CO2 we are pumping out, they are headed for a new reality of being three times more acidic by 2100, forming carbonic acid, the carbon content of the air is the critical factor when considering the greenhouse effect, whether methane or CO2 is the greenhouse contributor. This will dramatically affect the survival of most marine life as we know it.
Some physicists such as this author have also considered breaking carbon bonds, with the help of a laser, heat, or microwaves to break apart CO2 directly. The analysis from photochemistry, using ultraviolet lasers, is that the yield, even for high CO2 concentrations, is on the order of 5% which makes the process less attractive (Lu, Chang, Yin, Ng, & Jackson, 2014). However, Sandia National Labs has been developing its “Sunshine to Petrol” project for a decade to convert CO2 and water into hydrocarbon fuels and oxygen, using concentrated sunlight up to 1500˚C in a reverse combustion process with a thermochemical heat engine (Burroughs, 2008). A recent CO2 Summit II conference focused on this thermochemistry for solar fuels (Miller et al., 2016). A carbon dioxide microwave plasma torch has also been developed with a 2kW microwave source at 2.45 GHz by at least two countries (Kwak, Uhm, Hong, & Choi, 2015; Zherlitsyn, Shiyan, & Demchenko, 2016).
A 67-page “Comprehensive National Energy Initiative” report by this author, published by Integrity Research Institute in 2009 also includes many radical, far-reaching suggested innovations, such as government-endorsement of private renewable energy generation sales to local utilities (as successfully implemented in Germany), a long-overdue, declassification of some of the $35 billion Black Budget energy inventions which are unaccounted for, and zero bias diode array rectification of electrothermal fluctuations for electricity generation (Valone, 2009).
11.7. Time for Adaptation to a Warming World
As we approach mid-century and beyond, some experts state even today that it is not enough to try to limit further global warming—we must also do far more just to ensure that we survive it. That is the message of the Global Commission on Adaptation, a coalition of 28 global commissioners including Bill Gates, a former UN head and the CEO of the World Bank, Kristalina Georgieva. Overseas, urgency is the word from the newly formed Global Centre on Adaption, says its CEO, Patrick Verkooijen. Today, half of the money lent by the World Bank is for climate-related projects or $20.5 billion in the past year for adaptation (Le Page, 2018). With the coming shock to the global atmosphere being a call for alarm, as many nations, scientists, and politicians agree, as CO2, already 38% higher than the 290 ppm historic maximum, aiming to triple by 2100, with temperatures projected to be surpassing six (6˚C) degrees hotter by 2100, adaptation should be a high priority for everyone.
Now that more and more young people are motivated, such as the U.K. Student Climate Network, old and young alike may want to know some of the best methods for adapting to hotter environments. For homeowners, one of the most important is cool roof coatings that work to keep your home cool in two distinct ways. It’s a potent combination of high solar reflectance and thermal emittance that make these roof coatings so effective at keeping your home cool and your energy costs and usage down (HomeAdvisor, n.d.).
Another option that is similar is simply to install white roof shingles. The White Roof Project is a nonprofit movement which seeks to educate the public about such a simple, long-term solution to increased environmental heating of dark-roof home and business buildings. A white roof is constructed with solar reflective white coating and reflects up to 90% of sunlight (as opposed to traditional black roofs which reflect only 20%). White roofs’ benefits are measured partly according to the solar reflectance index, or SRI. A roof’s SRI is a measure of a surface’s ability to reflect solar heat. SRI measures reflectance (reflecting the sun’s rays) and thermal emittance (the roof’s ability to radiate absorbed heat). Wearing a black T-shirt in the sun demonstrates that the color black’s reflectance is negligible and its emittance is zero. A white roof’s reflectance (Figure 31) is as high as 90% and its emittance is 100% (White Roof Project, n.d.).
In the construction of new homes, many states like California are designing more efficient insulation so that the structure requires very little heating or more importantly, expensive air conditioning. The best and most advanced building insulation consists of phase change materials (PCM). Phase-change materials (PCMs) use a quirk of physics to aid in thermal storage. When you warm up a solid material (like ice), its temperature rises steadily until it nears the melting point. At that point, the temperature remains roughly the same as the material continues to absorb heat; the process of changing phase from solid to liquid absorbs a lot of energy, called latent heat. Once the material is entirely melted, its temperature resumes rising. When you cool down and freeze a liquid, the same process happens in reverse, releasing stored energy (Wilson, 2011). A one centimeter of the best, BioPCM brand of soy-based gel, from Phase Change Energy
Figure 31. Adaptation with phase change insulation and white surfaces (Wilson, 2011).
Solutions, in wall cavities has low flammability and equals about 25 cm of concrete! Other companies such as DuPont “Energain”, InsolCorp “InfiniteR”, and BASF “Miconal” sell similar PCM products for insulation as well, which are highly recommended for those middle-income individuals who want to keep their costs minimized as each decade becomes hotter with continued global warming (Figure 31).
GlassX Crystal is another PCM product designed as quadruple-glazing windows. The four panes of tempered safety glass form three separate insulating glazing units great for southern facing windows to allow low-angle winter sun to aid in heating but to also keep out high summer sun to minimize cooling costs (Ehrlich & Wilson, 2010).
To complete this section, the ultimate adaptation is a zero energy home. Fortunately, another nonprofit organization called the “Zero Energy Project” has pioneered such information for us. Recent counts done by a coalition of net zero advocates shows the number of zero and near-zero energy home projects in the U.S.A. and Canada at over 6177 residential units in 3330 buildings (Zero Energy Project, n.d.). With $23,500 in upgrades, it costs less than $10.00 per square foot more to build a home that uses no energy: $0.0 energy cost every month for a net zero home; $125 - $200 energy cost per month for standard homes versus 10 to 16 years to recoup the additional cost of building a net zero home (24hplans, 2018).
12. Conclusion
This approach to the climate outlook has been a systematic review and examination of global carbon dioxide emissions over past millennia, along with concurrent temperature records, to quantitatively evaluate the effects on the earth’s atmosphere. These historical records offer more agreement and insight into future temperature and sea level rise than previously anticipated. Contrasting the past, ancient history of CO2 with the present exponential increase in carbon emissions makes the case for what James Hansen and others have seen, e.g., an extremely rapid pumping rate (3 ppm/year) of carbon into the earth’s atmosphere, which has no precedent in any past known age or epoch on earth. We find that the closest event, similar to the modern anticipated carbon levels, is the 56 million-year-old Eocene epoch (PETM), which required thousands of years to build up 800 ppm of CO2 and a 15˚C increase in global temperature. Looking toward the 22nd century, the business-as-usual trendline of increasing levels of CO2 will, according to the best climatologists, recreate and repeat the PETM event again, with a ten (10) to fifteen (15) degree Celsius temperature increase, as briefly shown in Patrick Brown’s short video from Stanford University, unless dramatic geoengineering is performed (Brown, 2017).
With the grand perspective of geological time and the lithosphere interacting with the hydrosphere, humans are only a large portion of the many different species that inhabit the planet. Any changes such as the influx of billions of tons of carbon into the biosphere normally lasts for thousands of years, as Solomon and Wing have indicated, which is a short time geologically. Some scientists take the perspective that it is prudent to adapt to a warming world and to prepare just to survive the future extreme heat and droughts that Solomon et al. (2009) outline in her worldwide map for Mexico, eastern South America, and southern Africa. Such extremes are already being experienced in various places on the planet, including in Turbat, Pakistan with a 54˚C (129˚F) record temperature (The News, 2021).
The invaluable, predictive value of the Hansen approach has been proven in this review, with evidence from the past to the present. It has been shown to be superior to many other climate probability models, mainly due to the discovery that the correlated global temperature increase and long term sea level rise can now be accurately predicted with ease by anyone, using Equations (1) or (2), simply based on CO2 concentration amounts in parts per million, up to 500 or 600 ppm where a divergence begins in the correlation, with increasing nonlinearity as the thermal response begins to lag behind as it departs from the linear, proportional relationship.
Though this paper centers primarily on the role of carbon dioxide in the heat-trapping of solar radiation hitting the earth, it is well-known that methane (CH4) is about 28 times more heat-trapping than CO2 even though the lifespan of methane in the atmosphere is estimated to be around nine years. Therefore, a short summary of the impact on global warming is justified. A source for the increasing methane accumulation details, in the current range approaching 2 ppm (just beyond 1800 ppb), as the second most important greenhouse gas contributing to human-induced climate change, is the GlobalCarbonProject.org. An open access report called the “Global Methane Budget” for 2020 offers a look back as far as 2000 up to the present. Published in July 2020, it estimates the atmospheric CH4 growth rate to be about 17 teragrams (million metric tons) or 11 ppb per year, with the tropical regions contributing the most. An estimate of the equivalent volume per year of CO2 from this atmospheric CH4 growth rate is obtained by multiplying 17 by 28 = 476 megatonnes which we convert to tons x 0.907 = 432 megatons/year of CO2 equivalent. When we compare this amount (rounded off to a half gigaton), it is a small fraction of the 35+ gigatons of global CO2 emissions that humans are adding to the atmosphere each year. More information on GHG emissions from the project is available at http://www.globalcarbonatlas.org/.
Comparing the growth rate of change of the global CO2 emissions to the global human population growth rate, it was hypothesized that the CO2 emission growth rate will first peak and then show a decline as renewable energy begins to be universally adopted, about a century before the actual global CO2 level begins to level out. Various remediation methods were also discussed to help speed up this recovery process including a rapid adoption of continued, annual gigaton CCS and long-term carbon-free energy adoption. Though the intervention of a global pandemic has temporarily paused the worldwide carbon emissions increase for about one year, the fossil-fuel emissions upward trend is rebounding. It should be emphasized however that this review and its analysis scenario depend overwhelmingly on the present excess of 936 gigatons of CO2 already in the world’s atmosphere, above the pre-industrial era, and not on the 35 gigatons of annual global CO2 emissions which may vary or even temporarily cease altogether.
13. Recommendations
It is recommended that many or all of suggested remediations of Section 11 need to be implemented in the next few decades, before the deleterious effects of each degree of temperature increase for every twenty (20) years start occurring on a regular and totally predictable basis well into the 22nd century. Furthermore, specific actions must be taken to reverse this catastrophic, runaway train which threatens the survival of a huge portion of humanity. As Figures 9(a)-(d) prove historically, the driving effect of CO2 on the global temperature response is reversible. It also has been proven by humans to have a relatively short time delay of only a few decades and can go in either direction of a hotter earth or a cooling earth as indicated by Equations (1) and (2). However, the UN Secretary-General’s observation that “The G20 members, in their rescue packages, are now spending 50 percent more on sectors linked to fossil fuel production and consumption, than on low-carbon energy” needs to be reversed. He further notes that:
“It is time:
To put a price on carbon.
To phase out fossil fuel finance and end fossil fuel subsidies.
To stop building new coal power plants and halt coal power financing domestically and overseas.
To shift the tax burden from income to carbon, and from taxpayers to polluters.
To integrate the goal of carbon neutrality into all economic and fiscal policies and decisions.
And to make climate-related financial risk disclosures mandatory.
Funding should flow to the green economy, resilience, adaptation and just transition programmes.
We need to align all public and private financial flows behind the Paris Agreement and the Sustainable Development Goals.
Multilateral, regional and national development institutions, and private banks, must all commit to align their lending to the global net zero objective.
I call on all asset owners and managers to decarbonize their portfolios and to join key initiatives and partnerships launched by the United Nations, including the Global Investors for Sustainable Development Alliance and the Net-Zero Asset Owners Alliance today with $5.1 trillion dollars of assets” (Guterres, 2020).
Therefore, it is recommended that, at the same time as most governments and organizations are adopting carbon-free, renewable energy sources worldwide, the real heavy lifting will manifest as herculean-sized carbon capture and carbon sequestration on a global scale to start bringing the global concentration of the heat-trapping CO2 downward instead of upwards. Furthermore, judging from the ineffectual and minimal impact of previous national commitments, it is recommended that at least one and perhaps several specific multinational agencies are vital, along with the United Nations endorsement, to implement a scaled up massive, hundreds of billions of tons of CO2 injection into a distributed array of carbon capture technologies outlined in Section 11.4. The goal needs to be a sequestration, capture, and conversion to inert material of 4000 to 5000 billion (4 - 5 trillion) tons of CO2 in relatively few decades, even as other nations keep adding more and more CO2 to the finite, transparent, overhead storage bin otherwise called our earth’s atmosphere. Integrating Figure 1 under the curve (using calculus) and reviewing Section 9 PETM discussion adequately provide the corroborating facts for these CO2 tonnage numbers.
Though it may seem like a difficult task at this time, the requisite trillion-ton carbon capture technology recommended here is within reach of the trillion-dollar asset funds mentioned above and will only become more and more difficult with each passing year from now, similar to the US national debt, both of which keep growing. Justification for a proposed “Saving the Earth for Humanity” project can simply be the realizable vision of a forlorn 290 ppm CO2 environment or below, seen in Figure 7, where only a 1˚C increase from 14.5˚C could be maintained to stabilize global average temperature at 15.5˚C and the global heat sinks called glaciers will start to see the right, compatible environment to begin refreezing, even with sea levels going up a 10-meter corresponding amount (Figure 9(d)).
It is hoped that the simple, inextricably tight connection between global CO2 values and global temperature, delineated and publicized by James Hansen and others, will finally create an urgency in the minds and hearts of all people, so that global atmospheric carbon capture by hundreds of gigatons can begin in earnest internationally and in parallel with carbon-free fuels, zero carbon emissions, renewable carbon-free energy, along with negative carbon emissions, implemented worldwide. This two-pronged attack is really our only hope to avoid Drs. Wing’s and Solomon’s assessment of the most likely future of “irreversible climate change.”
Acknowledgements
The author acknowledges financial support from Magest Capital Establishment. Acknowledgement is also given for helpful suggestions and comments from Scott Wing as well as the graphic contribution and encouragement from Jim Hansen.
Conflicts of Interest
The author declares no conflicts of interest regarding the publication of this paper.
Cite this paper
Valone, T. F. (2021). Linear Global Temperature Correlation to Carbon Dioxide Level, Sea Level, and Innovative Solutions to a Projected 6˚C Warming by 2100. Journal of Geoscience and Environment Protection, 9, 84-135. https://doi.org/10.4236/gep.2021.93007
References
- 1. 24hplans (2018). Cost to Build a Net-Zero Energy Home. https://www.24hplans.com/cost-to-build-a-net-zero-energy-home/ [Paper reference 1]
- 2. Allen, J. G., MacNaughton, P., Satish, U., Santanam, S., Vallarino, J., & Spengler, J. D. (2016). Associations of Cognitive Function Scores with Carbon Dioxide, Ventilation, and Volatile Organic Compound Exposures in Office Workers: A Controlled Exposure Study of Green and Conventional Office Environments. Environmental Health Perspectives, 124, 805-812. https://doi.org/10.1289/ehp.1510037 [Paper reference 1]
- 3. Arctic Sea Ice Minimum (2019). https://climate.nasa.gov/vital-signs/arctic-sea-ice/ [Paper reference 2]
- 4. Battisti, D. (2011). Projections of Climate Change: 2100 and Beyond. Seattle, WA: University of Washington. https://atmos.uw.edu/academics/classes/2011Q1/101/Climate_Change_2011_part2.pdf [Paper reference 3]
- 5. Best, A. (2018). Xcel Energy’s Climate Plan Includes Carbon Capture. AP News, Energy News Network. https://apnews.com/article/8e5e0db68a324683aecf5d99f0563700 [Paper reference 1]
- 6. Beyond Belief with George Noory (2019). Solving Climate Change with Free Energy with Tom Valone. https://www.gaia.com/video/solving-climate-change-free-energy-tom-valone [Paper reference 1]
- 7. Bowen, M. (2006). CO2 and the “Ornery Climate Beast” (Chart), NASA Goddard Institute of Space Studies. MIT Technology Review. https://www.technologyreview.com/2006/07/01/228690/the-messenger/ [Paper reference 3]
- 8. Bragg, M. (2017). The Paleocene-Eocene Thermal Maximum. BBC Radio.https://www.youtube.com/watch?v=UgqYsiJGYmI [Paper reference 1]
- 9. Bredenberg, A. (2012). Climate Change, Nothing New? How Has Earth’s Temperature Changed in the Past? https://www.thomasnet.com/insights/imt/2012/02/13/climate-change-nothing-new-how-has-earths-temperature-changed-in-the-past/ [Paper reference 2]
- 10. Brown, P. (2017). Brown Caldeira 2017 Nature Summary. https://www.youtube.com/watch?v=8PdM9_cDL5Y [Paper reference 1]
- 11. Brown, P. T., & Caldeira, K. (2017). Greater Future Global Warming Inferred from Earth’s Recent Energy Budget. Nature, 552, 45-50. https://doi.org/10.1038/nature24672 [Paper reference 2]
- 12. Buroughs, C. (2008). Sunshine to Petrol, Solar Recycling of Carbon Dioxide into Hydrocarbon, Fuels. Sandia Technology, 9.https://www.sandia.gov/news/publications/research_magazine/archive/_assets/documents/st2007v9no4.pdf [Paper reference 1]
- 13. Carnegie Institution for Science (2017). More-Severe Climate Model Predictions Could Be the Most Accurate. ScienceDaily. https://www.sciencedaily.com/releases/2017/12/171206132220.htm [Paper reference 1]
- 14. CBS News (2012). Carbon Dioxide Emissions Rise to 2.4 Million Pounds per Second.https://www.cbsnews.com/news/carbon-dioxide-emissions-rise-to-24-million-pounds-per-second/ [Paper reference 1]
- 15. Christensen, E. (2011). The Greenhouse Gas Demo. https://www.youtube.com/watch?v=kwtt51gvaJQ [Paper reference 2]
- 16. Climate Change (n.d.). Vostok Temperature & Carbon Dioxide (CO2) Data.http://www.climatewarmingcentral.com/climate_change_page.html [Paper reference 2]
- 17. Climate Change Lecture Notes (2011). University of Washington. https://www.atmos.washington.edu/academics/classes/2011Q1/101/Climate_Change_2011_part2.pdf [Paper reference 1]
- 18. COP24 (2018). 24th Conference of the Parties to the United Nations Framework Convention on Climate Change. [Paper reference 2]
- 19. COP24 KATOWICE 12/2/18 (2018). https://cop24.gov.pl/
- 20. Critchley, L. (2018). Transmuting Nuclear Waste with Laser Driven Gamma Rays. AZO Optics. https://www.azooptics.com/Article.aspx?ArticleID=1427 [Paper reference 1]
- 21. Davies, B. (n.d.). If All the Ice in Antarctica Were to Melt, How Much Would Global Sea Level Rise? How Quickly Is This Likely to Happen? [Paper reference 1]
- 22. Dennis, B., & Mooney, C. (2018). “We Are in Trouble”. Global Carbon Emissions Reached a Record High in 2018. Washington Post.https://www.washingtonpost.com/energy-environment/2018/12/05/we-are-trouble-global-carbon-emissions-reached-new-record-high/ [Paper reference 3]
- 23. Doyle, A. (2019). Antarctica’s Melt Quickens, Risks Meters of Sea Level Rise: Study. Reuters, Yahoo News. [Paper reference 1]
- 24. Ehrlich, B., & Wilson, A. (2010). Quadruple-Glazed Window Includes Phase-Change Materials. BuildingGreen, 19. https://www.buildinggreen.com/product-review/quadruple-glazed-window-includes-phase-change-materials [Paper reference 1]
- 25. Eons (2018). The Last Time the Globe Warmed (p. S1:e22). https://www.pbslearningmedia.org/resource/last-time-globe-eons/last-time-globe-eons/ [Paper reference 1]
- 26. Fenton, D. (2018). Selling the Science of Climate Change. [Paper reference 1]
- 27. Ferguson, W. (2013). Ice Core Data Help Solve a Global Warming Mystery. Scientific American. https://www.scientificamerican.com/article/ice-core-data-help-solve/ [Paper reference 1]
- 28. Fischer, D. (2011). Why Carbon Dioxide Is a Greenhouse Gas. [Paper reference 1]
- 29. Gavin (2018). 30 Years after Hansen’s Testimony. RealClimate. http://www.realclimate.org/index.php/archives/2018/06/30-years-after-hansens-testimony/ [Paper reference 2]
- 30. Gilmore, T., Bonneville, A., Sullivan, C., Kelley, M., Appriou, D., Vermeul, V. et al. (2016). Characterization and Design of the FutureGen 2.0 Carbon Storage Site. International Journal of Greenhouse Gas Control, 53, 1-10. https://doi.org/10.1016/j.ijggc.2016.07.022 [Paper reference 1]
- 31. Glikson, A. (2013). Another Link between CO2 and Mass Extinctions of Species. The Conversation. https://theconversation.com/another-link-between-co2-and-mass-extinctions-of-species-12906 [Paper reference 1]
- 32. Goodell, J. (2010). How to Cool the Planet: Geoengineering and the Audacious Quest to Fix Earth’s Climate. Boston, MA: Houghton Mifflin Harcourt. [Paper reference 1]
- 33. Grinspoon, D. (2016). Earth in Human Hands: Shaping Our Planet’s Future. New York: Grand Central Publishing. [Paper reference 1]
- 34. Gruver, M. (2018). 10 Teams Advance in International Carbon Dioxide Competition. [Paper reference 1]
- 35. Gueroult, R., Hobbs, D. T., & Fisch, N. J. (2015). Plasma Filtering Techniques for Nuclear Waste Remediation. Journal of Hazardous Materials, 297, 153-159. https://doi.org/10.1016/j.jhazmat.2015.04.058 [Paper reference 1]
- 36. Guterres, A. (2020). Secretary-General’s Address at Columbia University: “The State of the Planet”. [Paper reference 1]
- 37. Hamilton, C. (2010). Requiem for a Species—Why We Resist the Truth about Climate Change. London, New York: Earthscan Publications Ltd. [Paper reference 1]
- 38. Hamilton, C. (2013). Earthmasters: The Dawn of the Age of Climate Engineering. New Haven, CT: Yale University Press. [Paper reference 1]
- 39. Hamilton, C. (2017). Defiant Earth: The Fate of Humans in the Anthropocene. Cambridge: Polity Press. [Paper reference 1]
- 40. Hamilton, C., Bonneuil, C., & Gemenne, F. (2015). The Anthropocene and the Global Environmental Crisis: Rethinking Modernity in a New Epoch. London: Routledge. https://doi.org/10.4324/9781315743424 [Paper reference 1]
- 41. Hansen, J. (1988). Global Climate Changes as Forecast by Goddard Institute for Space Studies Three-Dimensional Model. Journal of Geophysical Research, 93, 9341-9364. https://doi.org/10.1029/JD093iD08p09341 [Paper reference 3]
- 42. Hansen, J. (2018). Climate Change in a Nutshell: The Gathering Storm. [Paper reference 1]
- 43. Hansen, J., Sato, M., Kharecha, P., Von Schuckmann, K., Beerling, D. J., Cao, J. et al. (2017). Young People’s Burden: Requirement of Negative CO2 Emissions. Earth System Dynamics, 8, 577-616. https://doi.org/10.5194/esd-8-577-2017 [Paper reference 1]
- 44. Hansen, K. (2010). Carbon Dioxide Controls Earth’s Temperature. NASA. https://www.nasa.gov/topics/earth/features/co2-temperature.html [Paper reference 2]
- 45. HomeAdvisor (n.d.). For Reduced Energy Costs, Try a Reflective Roof Coating. HomeAdvisor. https://www.homeadvisor.com/r/reflective-roof-coatings/ [Paper reference 1]
- 46. Ice Sheets (n.d.). NASA Global Climate Change Vital Signs of the Planet. https://climate.nasa.gov/vital-signs/ice-sheets/ [Paper reference 3]
- 47. Jacobson, M. (2017). Transition to 100 Percent Wind, Water, and Solar. https://www.youtube.com/watch?v=74vwrSYTCjA [Paper reference 1]
- 48. Jacobson, M., Delucchi, M. A., Bauer, Z. A. F., Goodman, S. C., Chapman, W. E., Cameron, M. A. et al. (2017). 100% Clean and Renewable Wind, Water, and Sunlight All-Sector Energy Roadmaps for 139 Countries of the World. Joule, 1, 108-121. https://doi.org/10.1016/j.joule.2017.07.005 [Paper reference 2]
- 49. Jean-Francois, B., Yelena, F., Claude, G., Danilo, M., Marcelo, R., Devin, R., Constantin, M. Z., & Thomas, W. C. (2019). The Global Tree Restoration Potential. Science, 365, 76-79. https://doi.org/10.1126/science.aax0848 [Paper reference 1]
- 50. Keith, D. (2013). A Case for Climate Engineering. Cambridge, MA: The MIT Press. https://doi.org/10.7551/mitpress/9920.001.0001 [Paper reference 1]
- 51. King, M., & Allison, I. (2019). How Is Antarctic Melt Contributing to Global Sea Level? Australian Academy of Science. https://www.science.org.au/curious/earth-environment/how-antarctic-melt-contributing-global-sea-level [Paper reference 1]
- 52. Kintisch, E. (2015). On the Trail of the Arctic’s Time Bomb. New Scientist, 227, 14. https://doi.org/10.1016/S0262-4079(15)30968-4 [Paper reference 1]
- 53. Kwak, H. S., Uhm, H. S., Hong, Y. C., & Choi, E. H. (2015). Disintegration of Carbon Dioxide Molecules in a Microwave Plasma Torch. Scientific Reports, 5, Article No. 18436. https://doi.org/10.1038/srep18436 [Paper reference 1]
- 54. Lawton, G. (2019a). Climate Hits. New Scientist, 241, 40-43. https://doi.org/10.1016/S0262-4079(19)30334-3 [Paper reference 1]
- 55. Lawton, G. (2019b). World’s Largest Untapped Coal Reserve to Be Mined. New Scientist, 243, 7. https://doi.org/10.1016/S0262-4079(19)31841-X [Paper reference 1]
- 56. Le Page, M. (2017). We Will Get Roasting with Shock Rise in Warming. New Scientist, 236, 9. https://doi.org/10.1016/S0262-4079(17)32383-7 [Paper reference 1]
- 57. Le Page, M. (2018). Time to Adapt to a Warming World. New Scientist, 240, 5. https://doi.org/10.1016/S0262-4079(18)31913-4 [Paper reference 1]
- 58. Le Page, M. (2019a). Earth Could Warm by 14°C as Growing Emissions Destroy Crucial Clouds. [Paper reference 1]
- 59. Le Page, M. (2019b). Sea Levels Look Set for Even Higher Rise. New Scientist, 241, 12. https://doi.org/10.1016/S0262-4079(19)30269-6 [Paper reference 1]
- 60. Levin, K. (2013). Carbon Dioxide Emissions from Fossil Fuels and Cement Reach Highest Point in Human History. [Paper reference 1]
- 61. Lindsey, R. (2020). Climate Change: Atmospheric Carbon Dioxide. Clamate.gov. https://www.climate.gov/news-features/understanding-climate/climate-change-atmospheric-carbon-dioxide [Paper reference 1]
- 62. Lovelock, J. (1979). Gaia: A New Look at Life on Earth. Oxford: Oxford University Press. [Paper reference 1]
- 63. Lu, Z., Chang, Y. C., Yin, Q. Z., Ng, C. Y., & Jackson, W. M. (2014). Evidence for Direct Molecular Oxygen Production in CO2 Photodissociation. Science, 346, 61-64. https://doi.org/10.1126/science.1257156 [Paper reference 1]
- 64. Lüthi, D., Le Floch, M., Bereiter, B., Blunier, T., Barnola, J. M., Siegenthaler, U. et al. (2008). High-Resolution Carbon Dioxide Concentration Record 650,000 - 800,000 Years before Present. Nature, 453, 379-382. https://doi.org/10.1038/nature06949 [Paper reference 2]
- 65. Lyons, K. (2019). New Zealand Wildfires Will Burn for Weeks, Experts Warn. The Guardian. https://www.theguardian.com/world/2019/feb/11/new-zealand-fire-burn-weeks-march-wakefield [Paper reference 1]
- 66. Manabe, S., & Wetherald, R. T. (1967). Thermal Equilibrium of the Atmosphere with a Given Distribution of Relative Humidity. Journal of the Atmospheric Sciences, 24, 241-259. https://doi.org/10.1175/1520-0469(1967)024<0241:TEOTAW>2.0.CO;2 [Paper reference 1]
- 67. Masson-Delmotte, V., Zhai, P., Pörtner, H.-O., Roberts, D., Skea, J., & Priyadarshi, R. S. (2018). Global Warming of 1.5°C. In Ipcc-Sr15 (Vol. 2). https://www.environmentalgraphiti.org [Paper reference 1]
- 68. McKenna, P. (2018). Fast-Rising Demand for Air Conditioning Is Adding to Global Warming. The Numbers Are Striking. Inside Climate News.https://insideclimatenews.org/news/12112018/climate-change-home-air-conditioning-half-degree-global-warming-by-2100/ [Paper reference 1]
- 69. Miller, J. (2010). Sunshine to Petrol, Solar Recycling of Carbon Dioxide into Hydrocarbon Fuels. Sandia National Labs. https://energy.sandia.gov/wp-content/gallery/uploads/S2P_SAND2009-5796P.pdf
- 70. Miller, J., Coker, E., Ambrosini, A., McDaniel, A., Ermanoski, I., & Stechel, E. (2016). Sunshine to Petrol: Thermochemistry for Solar Fuels. In CO2 Summit II: Technologies and Opportunities. [Paper reference 1]
- 71. Mooney, C. (2018). The Arctic Ocean Has Lost 95 Percent of Its Oldest Ice—A Startling Sign of What’s to Come. [Paper reference 1]
- 72. Mooney, C., & Dennis, B. (2019). Ice Loss from Antarctica Has Sextupled Since the 1970s, New Research Finds. The Washington Post. https://www.washingtonpost.com/energy-environment/2019/01/14/ice-loss-antarctica-has-sextupled-since-s-new-research-finds/ [Paper reference 1]
- 73. Morton, O. (2015). The Planet Remade: How Geoengineering Could Change the World. Princeton, NJ: Princeton University Press. https://doi.org/10.1515/9781400874453 [Paper reference 1]
- 74. Mufson, S., & Dennis, B. (2018). “Carbon Removal Is Now a Thing”: Radical Fixes Get a Boost at Climate Talks. [Paper reference 1]
- 75. National Geographic (2020). Six Degrees Could Change the World. http://natgeotv.com/ca/six_degrees [Paper reference 1]
- 76. Nature (2017). Greater Future Global Warming Inferred from Earth’s Recent Energy Budget. 552, 45-50. https://www.nature.com/articles/nature24672#citeas [Paper reference 1]
- 77. NCA (Fourth National Climate Assessment), 411/23/18 (2018). https://nca2018.globalchange.gov/ [Paper reference 1]
- 78. NOAA (2021-a). Recent Monthly Mean CO2 at Mauna Loa Observatory, Global Monitoring Laboratory—Carbon Cycle Greenhouse Gases. US Department of Commerce, NOAA, Global Monitoring Laboratory. https://www.esrl.noaa.gov/gmd/webdata/ccgg/trends/co2_trend_mlo.png [Paper reference 1]
- 79. NOAA (2021-b). Sixty Years of Global CO2 Levels, 1958 to 2018. [Paper reference 2]
- 80. NOAA (2021-d). Trends in Atmospheric Carbon Dioxide, Global Monitoring Laboratory—Carbon Cycle Greenhouse Gases. US Department of Commerce, NOAA, Global Monitoring Laboratory. https://www.esrl.noaa.gov/gmd/ccgg/trends/ [Paper reference 1]
- 81. NOAA (n.d.-c). Trends in Atmospheric Carbon Dioxide, Annual Mean Growth Rate for Mauna Loa, Hawaii. [Paper reference 1]
- 82. OSS Foundation (2021). Climate Forcing and Temperature.http://ossfoundation.us/projects/environment/global-warming/natural-cycle/projects/environment/global-warming/radiative-climate-forcing [Paper reference 2]
- 83. OSS Foundation (2021). Global Warming Natural Cycle, 450 Thousand Years, Temperature Change versus CO2 ppm. http://ossfoundation.us/projects/environment/global-warming/natural-cycle
- 84. Petit, J. R., Jouzel, J., Raynaud, D., Barkov, N. I., Barnola, J. M., Basile, I. et al. (1999). Climate and Atmospheric History of the Past 420,000 Years from the Vostok Ice Core, Antarctica. Nature, 399, 429-436. https://doi.org/10.1038/20859 [Paper reference 1]
- 85. Philippus, W., Arabinda, M., Mukherji, A., & Bhakta, S. (Eds.) (2019). The Hindu Kush Himalaya Assessment. Mountains, Climate Change, Sustainability and People. https://link.springer.com/book/10.1007/978-3-319-92288-1
- 86. Powell, H. (2008). Will Ocean Iron Fertilization Work? [Paper reference 1]
- 87. Proctor, D. (2019). Carbon Capture Proposed to Save New Mexico Coal Plant. POWER Magazine. https://www.powermag.com/carbon-capture-proposed-to-save-new-mexico-coal-plant/ [Paper reference 1]
- 88. Project Vesta (2015). The Conceptual Research for Accelerated Weathering of Olivine in Tropical Shelf Seas That Inspired Project Vesta. https://www.projectvesta.org/science [Paper reference 1]
- 89. Rahmstorf, S., Perrette, M., & Vermeer, M. (2012). Testing the Robustness of Semi-Empirical Sea Level Projections. Climate Dynamics, 39, 861-875. https://doi.org/10.1007/s00382-011-1226-7 [Paper reference 1]
- 90. Riahi, K., Rao, S., Krey, V., Cho, C., Chirkov, V., Fischer, G. et al. (2011). RCP 8.5—A Scenario of Comparatively High Greenhouse Gas Emissions. Climatic Change, 109, 33-57. https://doi.org/10.1007/s10584-011-0149-y [Paper reference 1]
- 91. Rice, D. (2018). Ancient Antarctic Ice Sheet Collapse Could Happen Again, Triggering a New Global Flood. USA Today. https://www.usatoday.com/story/news/2018/12/20/antarctic-ice-sheet-collapse-could-lead-global-flood/2375523002/ [Paper reference 2]
- 92. Rissman, J. (2018a). Cement’s Role in a Carbon-Neutral Future. Energy Innovation Policy & Technology LLC. https://energyinnovation.org/wp-content/uploads/2018/11/The-Role-of-Cement-in-a-Carbon-Neutral-Future.pdf [Paper reference 1]
- 93. Rissman, J. (2018b). Concrete Change: Making Cement Carbon-Negative. [Paper reference 1]
- 94. Ritchie, H., & Roser, M. (2020). Energy—Our World in Data. [Paper reference 1]
- 95. Roser, M. (2019). World Population Growth, 1700-2100. Our World in Data. https://ourworldindata.org/uploads/2019/06/2019-Revision-%E2%80%93-World-Population-Growth-1700-2100.png [Paper reference 2]
- 96. Sample, I. (2005). The Father of Climate Change. [Paper reference 1]
- 97. Satish, U., Mendell, M. J., Shekhar, K., Hotchi, T., Sullivan, D., Streufert, S., & Fisk, W. J. (2012). Is CO2 an Indoor Pollutant? Direct Effects of Low-to-Moderate CO2 Concentrations on Human Decision-Making Performance. Environmental Health Perspectives, 120, 1671-1677. https://doi.org/10.1289/ehp.1104789 [Paper reference 1]
- 98. Schuiling, R. D., & Krijgsman, P. (2006). Enhanced Weathering: An Effective and Cheap Tool to Sequester CO2. Climatic Change, 74, 349-354. https://doi.org/10.1007/s10584-005-3485-y [Paper reference 1]
- 99. Service, R. F. (2017). Cleaning up Coal-Cost-Effectively. Science, 356, 798. https://doi.org/10.1126/science.356.6340.798 [Paper reference 1]
- 100. Siegel, E. (2017). The First Climate Model Turns 50 and Predicted Global Warming Almost Perfectly. [Paper reference 1]
- 101. Smith, J. (2017). Chemtrails, Geoengineering and Global Warming. [Paper reference 2]
- 102. Solomon, S., Plattner, G. K., Knutti, R., & Friedlingstein, P. (2009). Irreversible Climate Change Due to Carbon Dioxide Emissions. Proceedings of the National Academy of Sciences of the United States of America, 106, 1704-1709. https://doi.org/10.1073/pnas.0812721106 [Paper reference 4]
- 103. Subramanian, M. (2019). India’s Terrifying Water Crisis. The New York Times. https://www.nytimes.com/2019/07/15/opinion/india-water-crisis.html [Paper reference 1]
- 104. Sullivan, K. (2007). $25 Million Offered in Climate Challenge. Washington: Washington Post. [Paper reference 1]
- 105. Temple, J. (2019). The Two Key Reasons the World Can’t Reverse Climate Emissions. MIT Technology Review. https://www.technologyreview.com/2019/03/28/136279/the-two-key-reasons-the-world-cant-reverse-climate-emissions/ [Paper reference 1]
- 106. The Center for Climate & Security (2019). International Military Council on Climate and Security. https://climateandsecurity.org/imccs/ [Paper reference 1]
- 107. The News (2021). Pakistan Records Fourth Highest Temperature on Earth. https://www.thenews.com.pk/print/487015-pakistan-records-fourth-highest-temperature-on-earth [Paper reference 1]
- 108. Titley, D. (2019). The Nuclear Option. New Scientist, 241, 24-25. https://doi.org/10.1016/S0262-4079(19)30373-2 [Paper reference 1]
- 109. U.S. Department of Energy (2019). Geovision: Harnessing the Heat beneath Our Feet. https://www.energy.gov/eere/geothermal/downloads/geovision-harnessing-heat-beneath-our-feet [Paper reference 1]
- 110. U.S. Global Change Research Program (2018). Impacts, Risks, and Adaptation in the United States: Fourth National Climate Assessment, Volume II: Report-in-Brief. [Paper reference 1]
- 111. UN Environment (2018). Emissions Gap Report 2018. 27 November. https://www.unenvironment.org/resources/emissions-gap-report-2018 [Paper reference 2]
- 112. UNEP Emissions Gap Report 11/27/18 (2018). https://www.unenvironment.org/resources/emissions-gap-report-2018 [Paper reference 1]
- 113. Valone, T. (2009). Policy Recommendations: For a Comprehensive National Energy Initiative (1st ed.). Integrity Research Institute.https://www.integrityresearchinstitute.org/FutureEnergy/CNEIpolicyReport2009.pdf [Paper reference 1]
- 114. Valone, T. (2019). CO2 and the “Ornery Climate Beast”, The Annotated Climate Chart. https://www.integrityresearchinstitute.org/CO2andClimateBeastgraph.jpg
- 115. Valone, T., & Panting, J. (2019). Quantitative Carbon Dioxide, Temperature, and Sea Level Relation for the Future of Terrestrial Fossil-Fueled Technology: An Accurate Predictive Model Based on Vostok 420 kY Historical Record. 2019 IEEE International Symposium on Technology and Society, Medford, MA, 15-16 November 2019, 1-8. https://doi.org/10.1109/ISTAS48451.2019.8937887 [Paper reference 3]
- 116. Vaughan, A. (2019). Rain May Be Causing a Worrying Amount of Ice to Melt in Greenland. New Scientist. https://www.google.com/url?sa=t&rct=j&q=&esrc=s&source=web&cd=&cad=rja&uact=8&ved=2ahUKEwi67MrFzPHtAhXswVkKHQXjDQIQFjACegQIBxAC&url=https%3A%2F%2Fhttps://www.newscientist.com%2Farticle%2F2195972-rain-may-be-causing-a-worrying-amount-of-ice-to-melt-in-greenland%2F&usg=AOvVaw0fjBoRa2dnRDEqsLzQWsS2 [Paper reference 1]
- 117. Voosen, P. (2018). Discovery of Recent Antarctic Ice Sheet Collapse Raises Fears of a New Global Flood. Science. https://doi.org/10.1126/science.aaw4182 [Paper reference 1]
- 118. Watts, A., & Pacnik, M. (2012). Does CO2 Correlate with Temperature History?—A Look at Multiple Timescales in the Context of the Shakun et al. Paper. Watts Up with That? https://wattsupwiththat.com/2012/04/11/does-co2-correlate-with-temperature-history-a-look-at-multiple-timescales-in-the-context-of-the-shakun-et-al-paper/ [Paper reference 2]
- 119. Watts, J. (2018). Wildfires Rage in Arctic Circle as Sweden Calls for Help. The Guardian.https://www.theguardian.com/world/2018/jul/18/sweden-calls-for-help-as-arctic-circle-hit-by-wildfires [Paper reference 1]
- 120. White Roof Project (n.d.). White Roof Project, Frequently Asked Questions. https://web.archive.org/web/20191121074333/http://www.whiteroofproject.org/faq [Paper reference 1]
- 121. Wilson, A. (2011). BioPCM: Finally, a Low-Cost, Practical Phase-Change Material. [Paper reference 2]
- 122. Wing, S. (2014). Global Warming 56 Million Years Ago: What it Means for Us. https://www.youtube.com/watch?v=81Zb0pJa3Hg [Paper reference 1]
- 123. Worland, J. (2019). The “Green New Deal” Was Unveiled Thursday. But Parts of It Are Already Underway. [Paper reference 1]
- 124. World Nuclear Association (2020). Fast Neutron Reactors. https://www.world-nuclear.org/information-library/current-and-future-generation/fast-neutron-reactors.aspx [Paper reference 1]
- 125. World Nuclear Association (2020). Thorium. https://www.world-nuclear.org/information-library/current-and-future-generation/thorium.aspx [Paper reference 1]
- 126. Ye, M., Pasta, M., Xie, X., Dubrawski, K. L., Xu, J., Liu, C. et al. (2019). Charge-Free Mixing Entropy Battery Enabled by Low-Cost Electrode Materials. ACS Omega, 4, 11785-11790. https://doi.org/10.1021/acsomega.9b00863 [Paper reference 1]
- 127. Yoon, J. E., Yoo, K. C., MacDonald, A. M., Yoon, H.-I., Park, K. T., Yang, E. J. et al. (2018). Reviews and Syntheses: Ocean Iron Fertilization Experiments—Past, Present, and Future Looking to a Future Korean Iron Fertilization Experiment in the Southern Ocean (KIFES) Project. Biogeosciences, 15, 5847-5889. https://doi.org/10.5194/bg-15-5847-2018 [Paper reference 1]
- 128. Zero Energy Project (n.d.). Zero Energy Homes Cost Less to Own. [Paper reference 1]
- 129. Zherlitsyn, A. G., Shiyan, V. P., & Demchenko, P. V. (2016). Microwave Plasma Torch for Processing Hydrocarbon Gases. Resource-Efficient Technologies, 2, 11-14. https://doi.org/10.1016/j.reffit.2016.04.001 [Paper reference 1]