Modern Mechanical Engineering
Vol.2 No.4(2012), Article ID:25136,10 pages DOI:10.4236/mme.2012.24021
Experimental and Numerical Study of Impact of Air Filter Holes Masking on Altitude at Heavy-Duty Diesel Engine
1Department of Mechanical Engineering, Babol Universityof Tecjnology, Babol, Iran
2Iran Heavy Diesel Engine Mfg Co (DESA), Amol, Iran
Email: *mjk132@gmail.com
Received October 22, 2011; revised November 28, 2011; accepted December 10, 2011
Keywords: Heavy-Duty engine; Pressure drop; Altitude; Mass flow rate
ABSTRACT
At high altitudes, power of an internal combustion engine reduces due to air density reduction. In turbocharged diesel engine this issue affects the performance of the compressor and can result in unstable operation of the turbocharger if the power is not decreased by engine actuator. Mainly for testing the effects of altitude in the test room, air throttle valve and combustion air handling unit were used to reduce the suction air pressure. Easier and cheaper solution to consider effect of altitude on engine performance is to mask part of the air filter to reduce the suction pressure. In this paper, pressure drop against 0%, 26%, 52%, 66% and 74% of air filter hole’s masking for different mass flow rates has been studied by computational fluid dynamics. The analysis output mass flow rate-pressure diagram for the air filter, will be used as input data in the GT-Power software which is a one-dimensional computational fluid dynamics software and the effect of masking on altitude and performance at different revolutions per minute of the engine is investigated. Also, an experimental and computational fluid dynamics study was carried out to predict altitude against different proportions of air filter hole’s masking at 1000 rpm. The predicted results are validated by comparing with those of experimental data. A good agreement between the predicted and experimental values ensures the accuracy of the numerical predictions with the present work.
1. Introduction
Air cleaning devices for air born particles are widely used in various industrial applications: nuclear, automotive industry, food processing, etc. Engineers are generally interested in two parameters in order to carry out an assessment of the design and performance of air filter. These parameters are the temperature and pressure drop through the air filter. Numerous models have been proposed to calculate the efficiency and the pressure drop of filters under steady flow conditions. The majorities of these models apply to flat filters and not pleated filters. Moreover, there are few studies on the variation of these values in dynamic filtration. Wang et al. [1] discussed the relationship of filter efficiency and pressure drop with the porosity, fiber diameter and filter thickness and found that filter efficiency has exponential relationship with filter porosity, fiber diameter and thickness. JinHyung Kim et al. [2] developed the empirical equation for the prediction of the pressure drop across the dust cake of coal gasification (CG) fly ash formed on a ceramic filter considering temperature effect. L Del Fabbro et al. [3] studied a dimensionless model to determine the pressure drop across clean pleated filters, according to filter medium type, geometric characteristics of the pleating, distance between two pleats, pleat height, and air flow parameters (filtration velocity and air density). Hidehiro Kamiya et al. [4] measured increasing pressure drop during dust removal using a ceramic filter system under high temperature conditions, the pressure drop in an ash powder layer on a ceramic filter during the gas permeation and dust detachment processes directly with a small-scale testing apparatus, and suggested that the pressure drop increase is controlled by a decrease of pore volume and an increase of fracture strength within the ash layer. Pressure drop evolution of fibrous filter under continuous aerosol loading has been studied by Bergman et al. [5], Vendel et al. [6], Letourneau et al. [7], Novick et al. [8] and Thomas et al. [9] focusing on high-efficiency particulate air (HEAP) filters. Many authors have considered various aspects of this problem and obtained similarity solutions [10-13]. Also Awni Y. et al. [14] predicted efficiency, thickness, porosity and pressure drop at a new model of filter cake.
One of the applications of the air filter is in the heavy- duty diesel engine. The air intake is an open loop system, and the air filter only has one opportunity to filter the contaminant out of the intake air. Air filters are essential for heavy-duty engines and the air that these engines “breathe” needs to be as clean as possible. Poor air quality will significantly impact the performance of diesel engine. These filters are usually of an annular or cylindrical shape.
In this paper, the impact of air filter hole’s masking on the equivalent altitude in the heavy-duty diesel engine (16RK215) has been investigated.
This engine was introduced in 1991 as a compact, turbocharged and high power to weight ratio engine with a bore of 215 mm and a stroke of 275 mm by the Ruston. It initially introduced in a six cylinder in line and eight cylinder vee version, the range was planned to be extended to include twelve and sixteen cylinder vee versions, all producing 241 Break Horse Power (BHP) or 180 kW per cylinder.
This air filter consists of nine solid circular plates. These plates act as cleaners and also chokers. Entrance surface of the air filter contains 23 rows of 66 holes that are shown in Figure 1. In this air filter the air, after crossing a channel, enters the mentioned holes and creates turbulent flow in the vacant space between two cylinders and, after dusting, enters the compressor from bottom of the air filter.
The solution of computational fluid dynamics for the air filter takes place in several stages.
First, it is assumed that no masking is implemented and air at different mass flow rates gets through the air filter after having crossed the channel and pressure difference between inlet and outlet of the air filter is calculated using computational fluid dynamics. In the next step certain numbers of air filter’s holes are masked and pressure drop is calculated. Finally pressure drop at various mass flow rates and for different proportions of masking is obtained.

Figure 1. The complete shape of the Air filter with ellipse shapes as inlet area.
The gained pressure drop is then given to the GTPower software as input data and parameters such as torque, bark and suction pressure were calculated.
The altitude, equivalent to pressure drop, as will be discussed later is then obtained.
Finally experimental studies on 16RK215 are explained and the closing chapter numerical results are compared with experimental ones.
2. Computational Method
2.1. Study Model
In this work, the 3D geometry of the air filter was generated in CATIA software and the meshing of the volumes was done using Gambit. Only a sector of 60˚ of this geometry was modeled and meshed, due to huge volume of the air filter. Tetrahedron meshes with 1.2, 1.5, 1.8 and 2.1 million elements were generated within the geometry by the CFD software. Preliminary tests showed that the meshing with 1.5 million elements was the one that gave the best compromise between quality of mesh elements (in terms of aspect ratio and skewness), CPU time, and numerical dispersion introduced by the spatial discretization method. Eventually pressure drops were extended to the whole air filter and are depicted in charts in the “Result” section. Inlet surface in air filter was connected to a channel with a height and radius of 360 and 800 mm, respectively. Meshing for the air filter connected to a channel is shown in Figure 2.
2.2. Boundary Condition
The boundary conditions are illustrated in Figure 3 and described below with the following initial conditions;
• The mass flow inlet at the entrance of the channel was defined as turbulent in the normal direction at several mass flows.

Figure 2. Computational mesh for the air filter with a channel.

Figure 3. Boundary conditions used in computational at air filter.
• The outflow of the air filter was defined as an outlet pressure and was set zero.
• The sides of the air filter and channel were defined as periodic.
• Other faces of air filter were defined as wall.
• The fluid was assumed to be incompressible idealgas.
• The temperature at all the faces was assumed to be constant.
2.3. Conservation Equations
The complicated swirling turbulent flow in the air filter demands on numerical techniques and turbulence models employed in the CFD cods when modeling the air filter pressure drop.
In this analysis the commercial CFD software package, Fluent v.6.3, was used to predict the velocity profile and pressure drop inside the air filter. Under turbulent flow condition, a modification of the realizable k-ε model was employed with standard wall function. In all of simulations the fluid was considered to be Newtonian, incompressible ideal gas and the properties of the fluid were assumed to be constant. The mass conservation equation, or continuity equation, can be written as flow:
 (1)
(1)
This is the general form of the mass conservation equation. Here the term , designates the contribution of mass from another dispersed phase, it is equal to zero,
  is the fluid density and
  is the velocity vector. For an incompressible fluid the continuity equation simplifies to div = 0
 . The conservation of the momentum in the inertial (non-accelerating) reference frame can be written as:
 (2)
(2)
where p is the static pressure,  is the stress tensor (describes below), and
  and
and  aare the ravitational body forces and the external body forces, respectively.
 (3)
(3)
where  is the dynamics viscosity, I is the unit tensor, and the second term in the right side inside the square brackets is the effect of volume dilation. For incompressible fluid it is equal to zero. Turbulence was modeled using the realizable k-ε model, since it has been shown to give accurate results for flows involving rotation, boundary layer under strong adverse pressure gradients, separation and recirculation [15]. In this model the transport equations for k (turbulence kinetic energy) and the ε (turbulence kinetic energy dissipation rate) are:
 (4)
(4)
 (5)
(5)
and the adjustable parameters are:
 (6)
(6)
 (7)
(7)
 (8)
(8)
 (9)
(9)
In this model  represents the generation of turbulence kinetic energy due to the mean velocity gradients,
  is the generation of turbulence kinetic energy due to buoyancy,
  and
and  are the turbulent Prandtl numbers for k and ε,
  is the mean strain rate tensor and
  is the mean rate of a rotating reference frame with angular velocity
 . From these equations one can see that
 is not constant, it varies with mean strain and rotation rates. The model constants,
  ,
, , and
, and  and
and  assigned the following values:
 ,
,  ,
,  ,
,  these values have been established to ensure that the model performs well for certain canonical flows [16].
2.4. GT POWER
The development of a sixteen-cylinder direct-injection compression ignition engine model and air filter model using GT-POWER software is step by step, the first step is to open all of the selected diesel engine components to measure the engine components part size. To create the GT-POWER model, select window and then tile with template library from the menu. This will place the software template library on the left hand side of the screen. The template library contains all of the available templates that can be used in the software. Some of these templates that will be needed in the project need to be copied into the project before they can be used to create objects and parts.
For the purposes of this model, click on the icons listed and drag them from the template library into the project library. Some of these are templates and some are objects that have already been defined and included in the GT-POWER template library. Then, the engine components size data are input to the software library of all the engine components data. All parameters in the model will be listed automatically in the case setup and each one must be defined for first case of the simulation. The air filter in heavy-duty diesel engine (RK215) model is shown in Figure 4; and measured pressure drops by CFD are imported as initial condition to the above software. The specification of the engine is shown in Table 1.
Pressure drops obtained by computational fluid dynamics, as two parameters a, c, and according to the following equation, as inlet condition, are given to the GT Power software.
 (10)
(10)
3. Experimental
A heavy-duty diesel engine (16RK215) was tested in this study in the DESA Company in Iran. A model of this engine is shown in Figure 5. This is a turbocharged intercooled engine and the major parameters of the engine are shown in Table 2. Also environmental condition of the test is shown in Table 3. At the beginning the engine will start and leave it on for 2 hours to let the oil reach its normal temperature. This test was performed in four different stages.
At the first step, four rows of filters holes are blocked which equal to 17.4% of all holes and then the engine will work at 1000 rpm speed and at its full load. Next some parameters such as pressure cylinder and bearings, temperature inlet and out of the intercooler and other parameters are measured by processor. Also suction pressure is gauged by a computer.
The four steps of the procedure is repeated for air filter masking of 34.7%, 52.2% and 74%, each taking about 30 minutes. Hole masking of 17.4% and 74%, as two examples of the test are shown in Figure 6.
Some parameters gained from the test are listed in Table 4. Equivalent altitude is then calculated using pressure suction and considering the following equations:
 (11)
(11)
 (12)
(12)
4. Results and Discussion
1) Pressure drop prediction under different mass flow inlet and holes masking by the CFD
Pressure drop was measured at four mass flow rates and five percentage of masking by the CFD and the results are shown in Figure 7. Mass flow rate ranges from 1 kg/s to 4 kg/s. At mass flow rate of 1 kg/s the pressure drop rises from 0.376 KPa at 0% masking to 0.939 Kpa at 74% masking. At mass flow rate of 2 kg/s the pressure drop varies from 1.486 KP to 3.622 Kpa at 0% and 74% respectively.
Also it can be seen that the same value soars from 3.316 KPa to 8.108 Kpa and 5.789 KPa to 13.909 Kpa at mass flow rate of 3 kg/s and 4 kg/s for 0% and 74% masking respectively.
As can be seen, the pressure drop increases as mass flow rate rises. It can also be observed that for masking of 50% and higher, pressure drops increase more dramatically than the same value for masking of less than 50% which is not considerable.
2) Prediction of altitude at 16 RK215 engine in different speed engines As mentioned, pressure drop obtained as two parameters a and c according to equation 10 were input to the GT Power software. Table 5 shows the parameters obtained by the numerical method at 1000 rpm engine speed. In this table suction pressure and equivalent altitude are obtained by following equations;
 (13)
(13)
 (14)
(14)
As can be seen in Table 5, air filter holes masking does not have a significant effect on power and torque. It can also be observed that for masking of 50% and higher, altitude increases more dramatically than the same value for masking of less than 50%, which is not considerable.
According to Table 5 and interpolation equivalent altitude at different hole masking percentages can be gained. Figure 8 shows the altering of the altitude

Figure 4. Air filter at 16RK215 engine model using GT-Power.

Figure 5. A model of 16RK215 heavy-duty engine.

Table 1. Specification of the engine.

Table 2. Parameters of test engine.

Table 3. Environmental condition of the test.
against different masking of air filter holes.
To check the validity, Table 6 shows the comparison of numerical and experimental results in 1000 rpm engine speed. The computed altitudes are in good agreement with the measured data.
Figure 9 shows equivalent altitude at diverse speed engine.
In order to reach a certain equivalent altitude at reduced speeds, higher masking is required. For instance, to reach altitude of 400 m at 1000 rpm, 57.5% masking is needed while the value rises to 59.8% for 900 rpm and goes up to 61.9% at 840 rpm. When the engine is working at 690 rpm, masking proportion soars to 70.6% and finally to reach the same altitude at 570 rpm, 81% masking is required. Therefore at higher speeds, with masking, higher altitudes can be gained.
The following equations can be utilized to calculate
 (a)
(a) (b)
(b)
Figure 6. Two model of masking during the test. (a) 74% of air filter hole’s masking; (b) 17.4% of air filter hole’s.

Table 4. The parameters that are obtained during test.
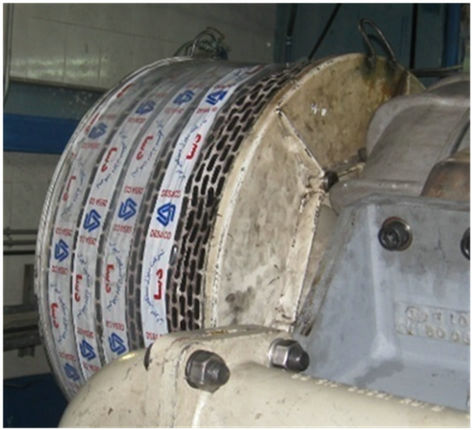
the number of rows and filters holes to be masked to reach a certain altitude.
 (15)
(15)
 (16)
(16)
The number of rows and holes of four engine speeds (rpm) are depicted in Figure 10.
5. Conclusions
In this paper, the impact of the masking on the altitude at heavy diesel engine (RK215) has been considered. The

Figure 7. Altering pressure drop with variety of mass flow in different masking holes at air filter.

Figure 8. Altering altitude with percentage of masking at 1000 rpm speed engine per the experimental and numerical methods.

Table 5. The parameters that are measured by the GT power at the 16RK215 engine.
main goal has been to investigate the altitude against different masking of the air filter holes. The investigations indicate that the numerical results have a good agreement with experimental data. Based on the results obtained throughout this study, the following conclusions are summarized;

Figure 9. Altering altitude with percentage of masking at four speed engine.
 (a)
(a) (b)
(b) (c)
(c) (d)
(d)
Figure 10. Altering masking rows and holes with altitude in different speed engine. (a) N = 570 rpm; (b) N = 690 rpm; (c) N = 840 rpm; (d) N = 1000 rpm.

Table 6. Altering altitude with percentage of masking at 1000 rpm speed engine per the experimental and numerical methods.
1) The CFD code with the realizable k-ԑ turbulence model, predicts the pressure drop in air filter with a variety of air filter masking holes. It can clearly be seen that pressure drops depend on mass flow rate and percentage of masking.
2) With masking of the air filter holes can predict the altitude at different engine speeds, namely, in order to reach higher altitude, the number of masked holes rises. Also at higher speeds, with masking, higher altitudes can be obtained.
REFERENCES
- X. Wang, K. Kim, C. Lee and J. Kim, “Prediction of Air Filter Efficiency and Pressure Drop in Air Filtration Media Using a Stochastic Simulation,” Fibers and Polymers, Vol. 9, No. 1, 2008, pp. 34-38. doi:10.1007/s12221-008-0006-4
- J. H. Kim, Y. Liang, K. M. Sakong, J. H. Choi and Y. Cheol Bak, “Temperature Effect on the Pressure Drop across the Cake of Coal Gasification Ash Formed on a Ceramic Filter,” Powder Technology, Vol. 181, No. 1, 30 2008, pp. 67-63. doi:10.1016/j.powtec.2007.06.006
- L. D. Fabbro, J. C. Laborde, P. Merline and L. Ricciardi, “Air Flows and Pressure Drop Modeling for Different Pleated Industrial Filters,” Filtration & Separation, Vol. 39, No. 1, 2002, pp. 34-40. doi:10.1016/S0015-1882(02)80055-6
- H. Kamiya, K. Deguchi, J. Goyou and M. Horio, “Increasing Phenomena of Pressure Drop During Dust Removal Using a Rigid Ceramic Filter at High Temperature,” Powder Technology, Vol. 118, No. 1-2, 2001, pp. 160-165.
- W. Bergman, R. D. Taylor, H. H. Miller, A. H. BIermann, H. D. Hebard, R. A. daRoaza and B. Y. Lum, “Enhanced Filtration Program at LLL—A Progress Report,” Proceedings of the 15th DOE/NRC Nuclear Air Cleaning and Treatment Conference, Boston, 7-10 August 1978, pp. 1058-1099.
- J. Vendel, Ph. Mulcey and P. Letourneau, “Aerosol Penetration Inside HEPA Filtration Media,” Proceedings of the 21st DOE/NRC Nuclear Air Cleaning Conference, San Diego, 13-16 August 1990, pp. 799-808.
- P. Letourneau, V. Renaudin and J. Vendel, “Effect of the Particle Penetration Inside the Filter Medium on the HEPA Filter Pressure Drop,” Proceedings of the 22nd DOE/NRC Nuclear Air Cleaning Conference, Denver, 24-27 August 1992, pp. 128-142.
- V. J. Novick, J. F. Klassen, P. R. Monsone and T. A. Long, “Predicting Mass Loading as a Function of Pressure Difference across Prefilter/HEAP Filter Systems,” Proceedings of the 22nd DOE/NRC Nuclear Air Cleaning Conference, Denver, 24-27 August 1992, pp. 554-573.
- D. Thomas, P. Contal, V. Renaudin, P. Penicot, D. Leclerec and J. Vendel, “Modeling Pressure Drop in Heat Filters during Dynamic Filteration,” Journal of Aerosol Science, Vol. 30, No. 2, 1999, pp. 235-246.
- Q. Cai, “A Study of Air Filter by Computational Fluid Dynamics,” MSc Thesis, School of Mechanical Aerospace Engineering, Oklahoma State University, 1993.
- C.-B. Tebbutt, “Computational Fluid Dynamic Model of Flow through Air Filter Plates,” M.Sc. Thesis Mechanical and Aerospace engineering. Oklahoma State University, Oklahoma City, 1995.
- D. R. Chen, D. Y. H. Pui and B. Y. H. Liu, “Optimization of Pleated Filters Designs Using a Finite-Element Numerical Model,” Aerosol Science and Technology, Vol. 23, No 4, 1995, pp. 579-590. doi:10.1080/02786829508965339
- L. Del Fabbro, J. C. Laborde, P. Merlin and L. Ricciardi, “Air Flows and Pressure Drop Modeling for Different Pleated Industrial Filters,” Filtration & Separation, Vol. 39, No. 1, 2002, pp. 35-40.
- Y. Awni and A. Otoom, “Prediction of the Collection Efficiency, the Porosity, and the Pressure Drop across Filter Cake in Particulate Air Filtration,” Atmospheric Environment, Vol. 39, No. 1, 2005, pp. 51-57.
- L. Raynal, C. Boyer and J. P. Ballaguet, “Liquid Holdup and Pressure Drop Determination in Structured Packing with CFD Simulations,” The Canadian Journal of Chemical Engineering, Vol. 82, No. 5, 2004, pp. 871-879.
- Z. Yang and J. Zhu, “A New k-ԑ Eddy Viscosity Model for High Reynolds Number Turbulent Flows,” Computers & Fluids, Vol. 24, No. 3, 1995, pp. 227-238.
NOTES
*Corresponding author.