Open Journal of Geology
Vol. 2 No. 2 (2012) , Article ID: 18692 , 12 pages DOI:10.4236/ojg.2012.22010
Cyclic Rhythms and Macroheterogenity of the Carbonated Intersaliferous Reservoirs in the Pripiat Basin (Byelorussia)
1Department of Earth Sciences, University of Abomey-Calavi, Cotonou, Benin
2Russian University of People’s Friendship, Moscow, Russia
3Russian State University of Geological Prospecting, Moscow, Russia
Email: *kaki_christophe@yahoo.fr
Received October 26, 2011; revised January 29, 2012; accepted March 23, 2012
Keywords: Pripiat basin; natural reservoirs; heterogeneity; autocorrelation; spectral analysis
ABSTRACT
The intersaliferous complex of the Pripiat basin was deposited during a rift stage that occurred at Hercynian cycle. Reef formations are locally present within this complex, proof that the basin had undergone significant variations of tectonic regime during sedimentation processes. The natural reservoirs rocks of this complex consist essentially of biogenic, bioclastic limestones and dolomites which had suffered important diagenetics transformations. The vertical succession of these reservoirs rocks point up the existence of cycles quantified by the mathematical methods of autocorrelation and spectral analysis. The application of appointed mathematical methods for interpretation of neutron gamma logs of natural reservoirs intervals allowed the structuring of studied oil fields in linear hydrodynamic blocks proved by the water injections made with intention to maintain reservoirs pressure during fields’ exploitation.
1. Introduction
The actual importance of oil resources and the progressive exhaustion of proven World reserves as we exploit them swiftly, require the increasing of effectiveness of prospecting works as well as the development and optimization of already exploited oilfields. Complex reservoirs are generally underexploited because it’s difficult to control their heterogeneity which must be well known to predict the best exploitation regime in intention to maximize the recovery processes. Consequently, new approaches allowing more detailed petrophysical study of complex reservoirs rocks are needed. In fact, a good knowledge of carbonated reservoirs heterogeneity characterized by microheterogeneity linked to post-diagenetics transformations and macroheterogeneity related to combination of reservoir, false seals and screens rocks; make easier the orientation of prospection and exploitation works.
Based on geological and geophysical materials, this paper presents the use of the mathematical methods of autocorrelation in purpose to study and appreciate the heterogeneity of carbonated reservoirs in three oilfields (Davidovskaya, Yuzno-Sosnovskaya and Yuzno-Alexandrovskaya) located in the North-East of the Pripiat basin. The study brings a solution to the problem of hydrodynamic discontinuity encountered at the time of water injection during exploitation.
2. Characteristics of the Basin
2.1. Geology
Located in the South-East of Byelorussia, the Pripiat basin is a negative structure of 250 × 150 km, where prospection works actively began in 1940. The basin occupies a part of the Precambrian Eastern-European platform and belongs to the large Pripiat-Donetz grabens system which links Eastern Byelorussia to Ukraina (Figure 1).
The crystalline basement of the basin which is composed of Achaean and Proterozoïc granites, granodiorites and gneiss is sheared by several faults systems [1]. Some ones are East-West listric faults, which limit the basin and the others are East-West regional faults which subdivide the basin into three various structural zones: the Southern, Central and Northern zones [2,3].
The sedimentary cover of the Pripiat basin includes Precambrian (Neoproterozoïc), Palaeozoic (Devonian, Carboniferous and Permian), Mesozoïc and Cenozoïc formations subdivided into three great lithological
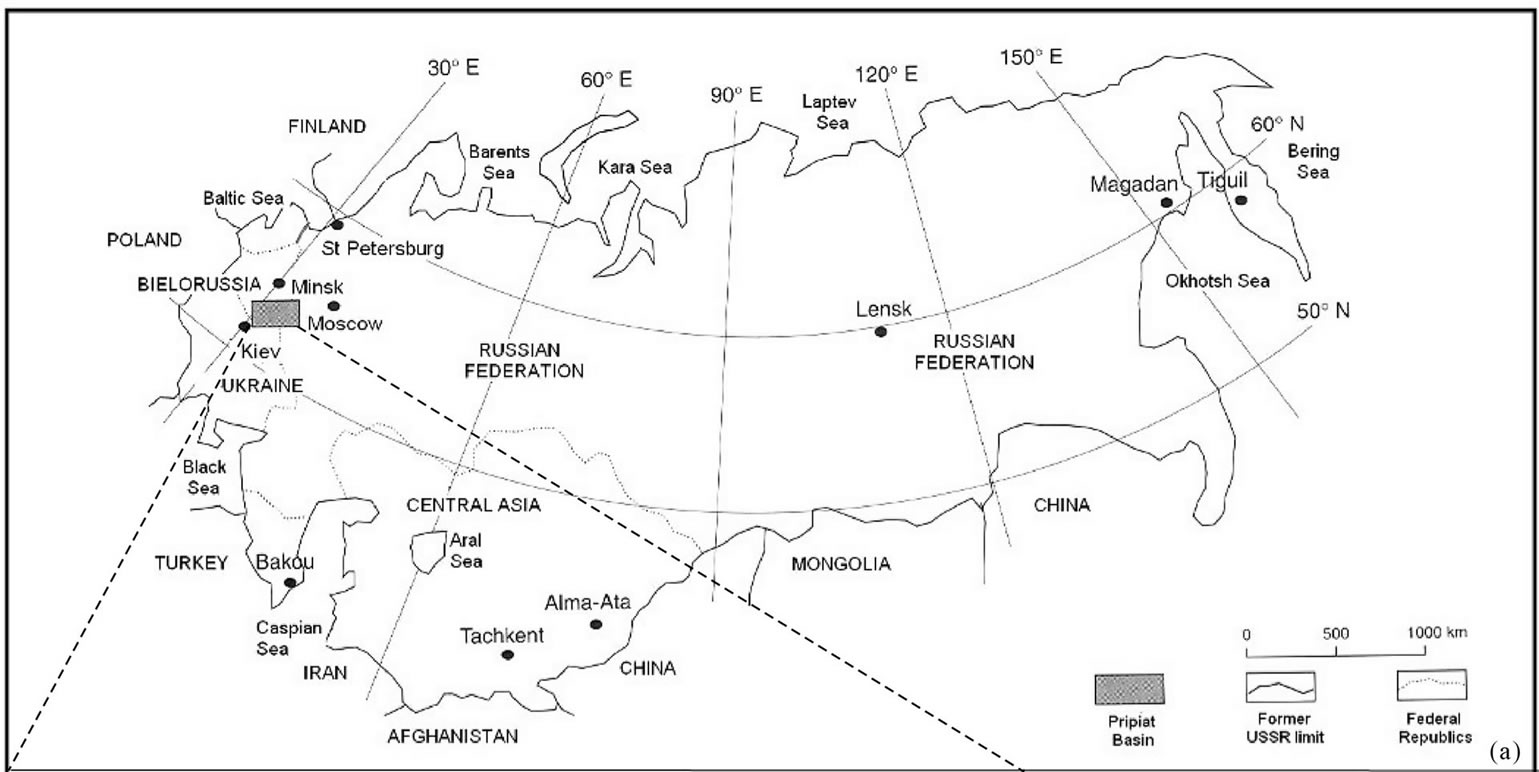
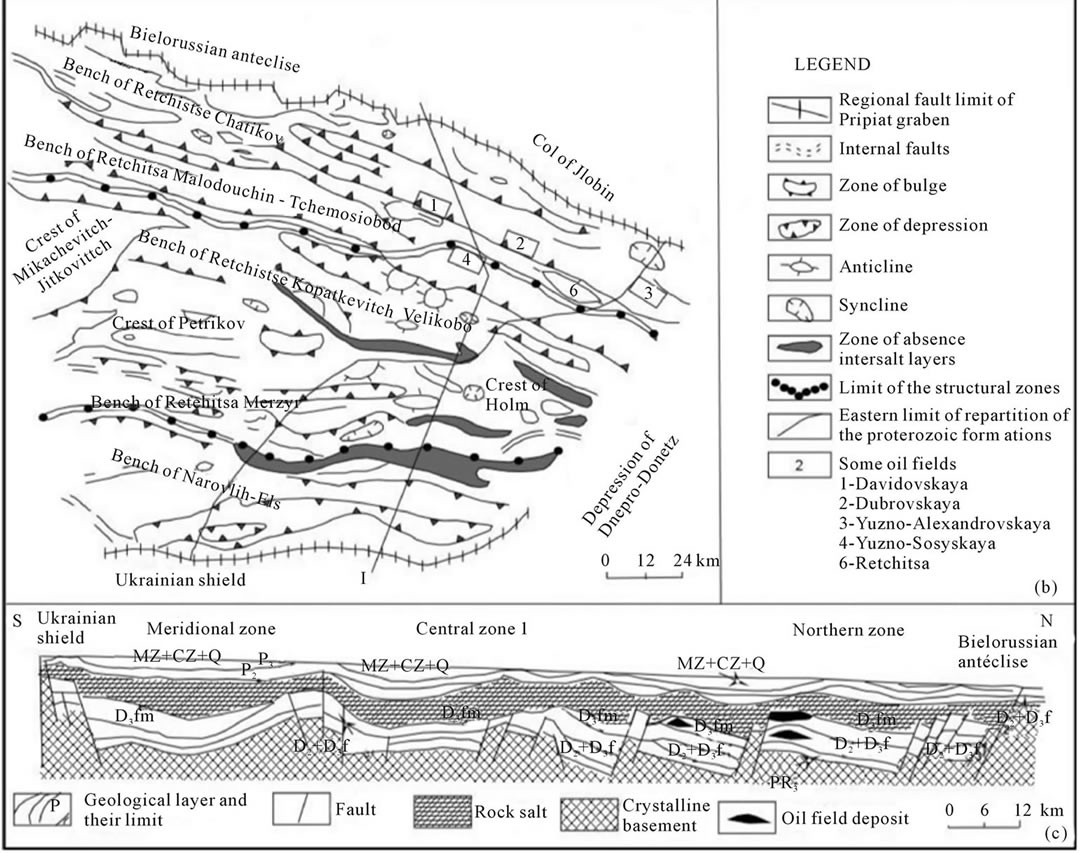
Figure 1. Tectonic sketch and geologic cross-section of Pripiat basin (Garetsky et al., 1984). (a) Geographical location of Pripiat basin in ex-URSS; (b) Tectonic sketch; (c) Geologic cross-section (S-N) according to I-I'.
complexes (Figure 2):
• The lower complex composed of reddish terrigenous layers of Upper Proterozoïc (Rifain-Vendean);
• The middle complex which includes sulfato-carbonated and volcanogenic saliferous Paleozoic rocks. Historico-genetically, this important complex is usually subdivided into three stages by several authors: anté- rift, rift and post-rift stages [4,5];
Figure 2. Generalized stratigraphic column of the Pripiat Basin.
• The upper complex which consists essentially of MesoCenozoic layers of low thicknesses. The formation of this last complex is related to the basin immersion during the alpine cycle.
From economic point of view, the basin presents a great interest as part of the enormous Pripiat-Donetz petroleum basin. The main producing stratigraphics intervals are inter and under salt formations of Devonian age.
2.2. Results of Former Studies on the Intersaliferous Complex
Former petrographic studies showed that the reservoirs of the intersaliferous complex consist of biogenic (algae), bioclastic and crystalline limestones and dolomites represented on Board 1.
The algae and other organisms had locally formed reef constructions [6-9]. These carbonated rocks have undergone various catagenetic processes of dissolution, metasomatose, recrystallization which have conduced to the formation of new minerals explained by the nature of vacuums observed in the rocks [10-12]. In objective to control the reservoirs characteristics for a better productivity, several diagraphics methods of exploration (electric, acoustic, gamma, neutron-gamma and cavernometric) were used to study the interval of carbonated intersaliferous complex. Analysis and interpretations were done in association with cores data. The neutron gamma which provides information relative to the quantity of hydrogen present in rocks and therefore total porosity of rocks, was largely employed to evaluate the qualitative types of porosity: pores, caves, cracks [13,14] and determinate the porosity of the reservoirs. The content of clay in carbonates induces a rising of the radioactivity of Gamma type (Gamma Ray) and a reduction of the porosity [15]. The results of porosities and clay contents obtained by interpretation of geophysical data gave possibility to establish the limited value of porosity between
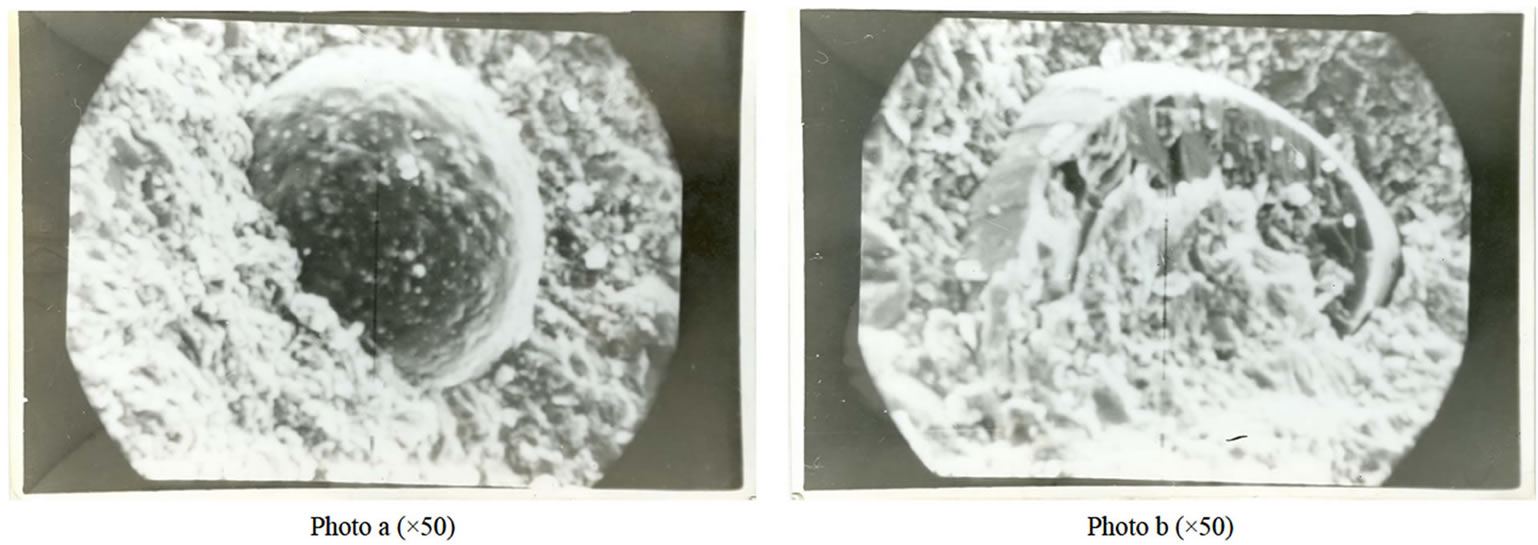
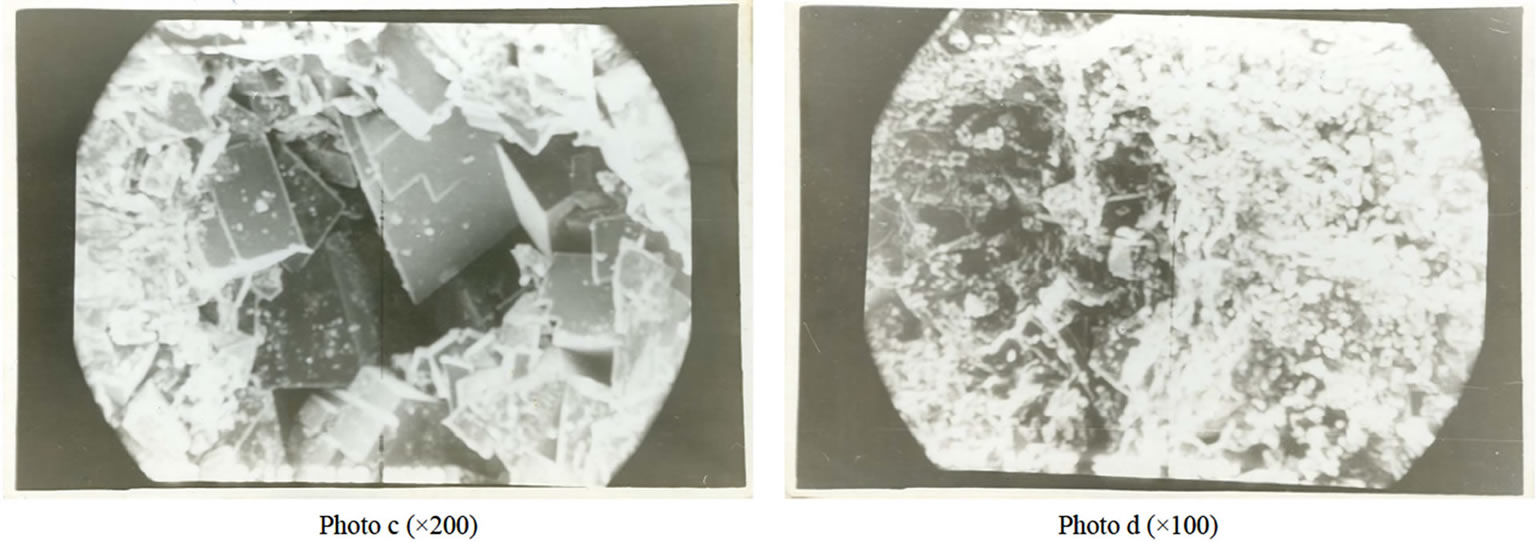
Board 1. Electro microphotography of carbonated reservoir rocks. (a) Calcareous biomicritic (with echinoderms): In the center of the photograph an echinoderm bathing in a micritic mass comprising by place of the fragments of lamellibranches (on the left); (b) Biomicrite: Fragment of bivalve (lamellibranches) in the center of a micritic mass. The interior of the shell presents zones of dissolution occupied by microsparitic recrystallization; (c) Cavernous limestone: In the center of the photograph, a large cave occupied by new calcite crystals; (d) Porous and cavernous micritic limestone: On left a cave resulting probably from the dissolution of a shell of a new calcite recrystallization.
the reservoirs rocks and the seals in interval 2.5% - 7.5% with an average of 4.8%, corresponding to a limited clay content of 15% [5,13]. The subdivision of the layers in reservoirs rocks and seals rocks made from porosity values and clay content, without taking into account the permeability values and the decrease of the layers pressure, led to non conformity between considered reservoirs and the test flow results. Authors’ works of 1993 and 2000, which established that open porosity within the intersalt reservoirs rocks varies with the nature and the extent of the secondary transformations in the carbonates, were used as basis for the subdivision of the massive reservoirs in effective reservoirs rocks and false seals intervals. Indeed, it come out from this work that the rocks of the intersalt complex have a density which varies from 2.4 to 2.78 kg/m3 for the carbonated rocks; and reaches more than 2.93 kg/m3 for the evaporates [11]. The open porosity of these rocks varies from 0.7 to more than 12% with more than 5% for the limestones. High values of porosity (12% and more) were fixed in dolomites of the Eastern part of the basin. The reservoirs rocks are characterized by a density lower than 2.7 kg/m3, a porosity higher than 2% and a chaotic spatial distribution (as well vertical as horizontal), which had generated a macroscopic heterogeneity of these natural reservoirs. The study of this heterogeneity gave possibility to make a typisation of these reservoirs and found a perfect explication to the negative results of tests flow obtained in false seals intervals [11,16]. The massive structure of the reservoirs, branded by a horizontal oil water contact must normally make easier maintain of layers pressure through water injection during exploitation. But it lets appear a serious problem of hydrodynamic discontinuity between several wells of the studied Yuzno-Sosnovskaya and Yuzno-Alexandrovskaya fields.
The detailed study of sedimentation cycles and postsedimentation transformations will be useful to determinate blocks with similar hydrodynamic continuity in intention to implant successfully the water injection wells.
3. Rhythmicity of the Natural Reservoirs
The rhythmicity in sedimentation of carbonated formations is conditioned by several factors. In particular condition of carbonated sedimentation, the size of the particles and the carbonate contents depends of the depth and shape of the basin. The sediments configuration varies in time and space with the changes of depotbelt centers and rhythm of vertical movements, in particular oscillations changes of the basin depth.
Variations of the basin depth just like variation of porosity and CaCO3 contents are sequential and point out cyclic rhythms of various orders in the sedimentary column. The autocorrelation function and spectral analysis of wells logs, give possibility to reveal the masked cyclic rhythms resulting from the processes of sedimentation and post sedimentation [17-21].
3.1. Mathematical Analysis of the Geophysical Data
3.1.1. The Autocorrelation Function
The autocorrelation is a mathematical tool used in signal treatment. It is a cross correlation of a signal by itself, which permits to detect repeated regularities of profiles in a signal, like a periodic signal troubled by a large amount of noise or a fundamental frequency of a signal which does not contains effectively this fundamental frequency, but implies it with several of its harmonics [22,23].
If given N is a time series representing the log neutron gamma on the entire studied reservoir interval and contains n points isolated from each other of ∆; the distance between two unspecified points  and
and  is called lag of length
 .
.
Therefore, the autocorrelation of lag  is the correlation of all the points
  and
and  determined between various parts of the same time series by the formula:
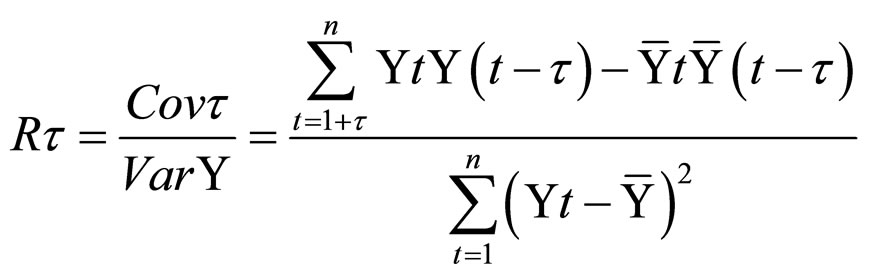 (1)
(1)
For function , the average
  is calculated according to the formula:
  and dispersion, by
  .
.
R varies from −1 to + 1 and is calculated for entire values going from 0 to
 .
.
The autocorrelation function describes the internal structure of a process and permit to evaluate up to which point the process preserves its value in time. The autocorrelation function gives an answer to the properties of symmetry, closure and Schwarz inequality [21].
3.1.2. Spectral Analysis
Spectral analysis comes in complement to the autocorrelation and consists in decomposition of a random variable in various components corresponding to intervals comprising this variable. Thus, the diagram to be broken is regarded as being the sum of a multitude of short simpler diagrams, having each one a regular sinusoidal form, amplitude and wave length in a starting point. The analysis is used to detect the masked periodicities in layers formation, and to determine the wave lengths (T) corresponding to the thicknesses of the cycles with structure of repetition within the geological cuts [21]. It describes the dispersion for each period.
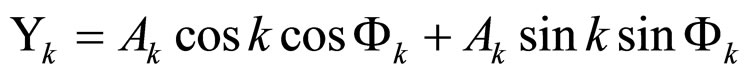
The time series can be expressed as follow:
 (2)
(2)
where: k—number of cycles (harmonics); — angular variable
Φk: angular phase; Ak: cycle amplitude As: 
If we consider that  and
and  ; so the function can be illustrated by
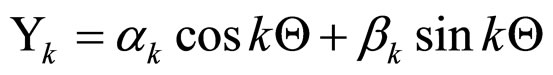
Thus, any variable can be presented like sum of several cosinusoïdal waves’ series
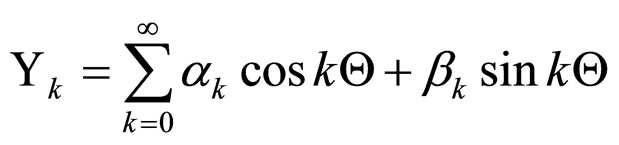 (3)
(3)
For a time series, if we have n points distant one from other of Δ and j one of these points, the coefficients αk and βk are determined by the formula:
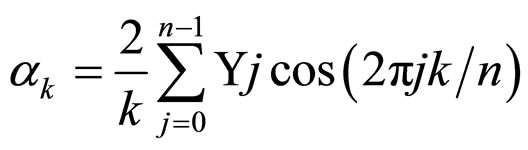 and
and 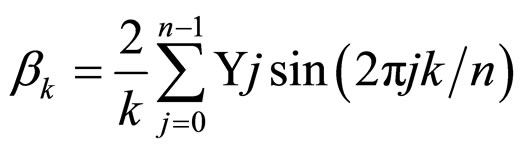
When  takes value =
 , we have:
  and
and 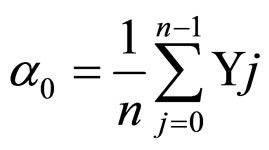 .
.
What is nothing different that the average of the series.
After having calculated the coefficients αk and βk of a harmonic k, we can determine the amplitude Ak and the angular phase Φk of its periodic form (undulatory) as follow:
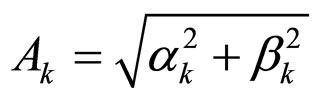 and
and 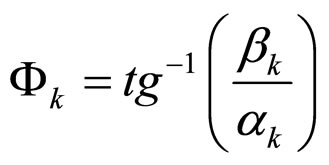
In the case of a discrete series with regular sinusoidal structure, the dispersion of the harmonic component k can be expressed by:
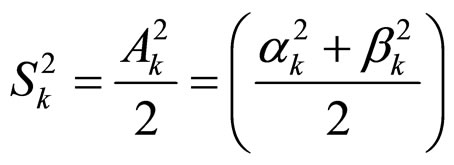
Since the Fourier theorem affirms that the dispersion of a variable is equal to the sum of dispersions of its components deleted by the peaks of the spectrogram; ones can determines the dominant components of the variable by calculating and putting the dispersions (energies) values on the y-axis.
3.2. Application and Results
Considering neutron gamma logs measured with an indepth lag of sampling of 0.8 m inside the productive (D3zd - D3el) interval of less than 200 m thick, we have made up for each well, a time series.
The obtained time series were subjected to the autocorrelation and spectral analysis using “Autocor” software elaborate in the PASCAL language. Therefore, we proceed to the presentation of the time series in the form of model and we calculate the values of dispersion and complete the process by construction of a series of correlograms and spectrograms. The analysis of the periodicity is in fact based on the correlograms and spectrograms (Figure 3).
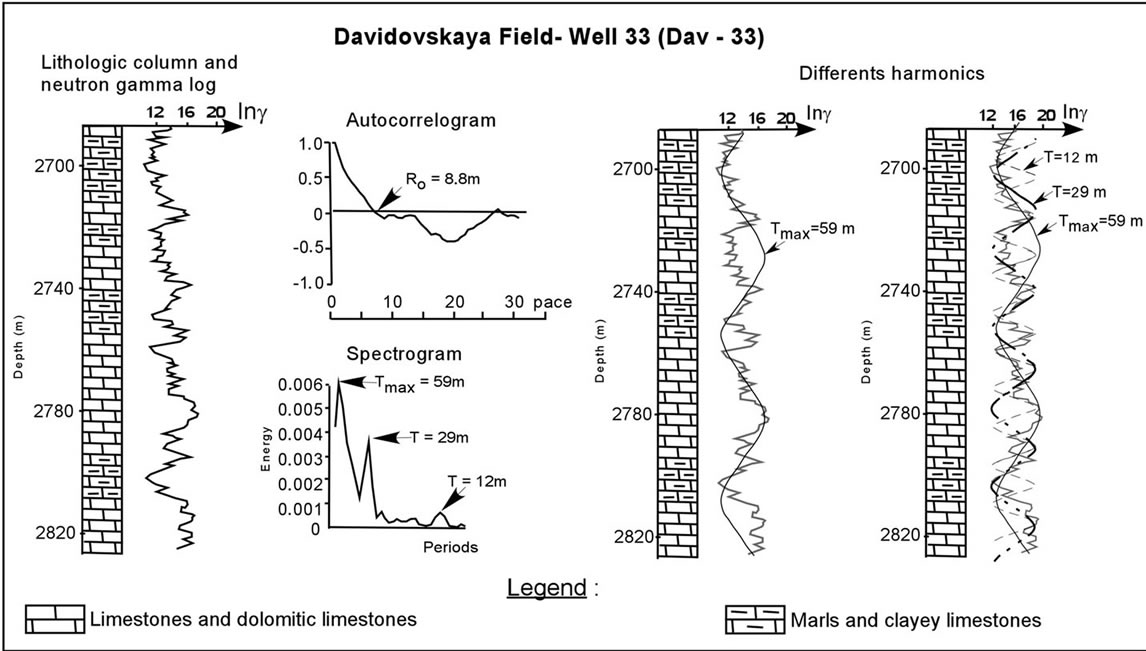
Figure 3. Neutron gamma log of the reservoir interval and related autocorrelogram, spectrogram and harmonics (Eliets horizon: well 33 Davidovskaya field).
On the correlograms, it was possible to determine graphically the ray for which the correlation (Ro) is null and, on the spectrograms, the harmonics materialized by peaks. The values of periods and dispersions of these harmonics are calculated. The correlograms and the spectrograms are subjects of analyse which is based on their form and indexes of heterogeneity. Like quantitative indexes of heterogeneity, one considers for the autocorrelation functions for which the correlation (Ro) is null (Ro expressed in meters and determined on the correlograms); and for the spectral analysis, the maximum period (Tmax expressed in meters) of the main wave. These two selected parameters will have values proportional to the degree of organization of layers within the studied reservoirs.
4. Cyclicity of the Cuts and Macroheterogeneity of the Natural Reservoirs
Cyclicity analysis based on correlograms and spectrograms diagrams (obtained after treatment of the neutron gamma logs) reveal the inner organisation of the cuts and show four different types of cuts cyclicity in the studied fields (Figure 4).
The 1st type shows a slow decrease of the correlograms values from +1 towards the x-axis which is, crossed for Ro values ≥ 15 m. The correlogram is prolonged under the x-axis, by a rectilinear way. This variation is associated with a fluctuation ln γ With a Tmax ≥ 145 m, this type reflect the existence of a long periodicity in the cuts. The vertical variation of petrophysical properties of the rocks is ordered by oscillatory movements which wavelength is almost equal to the total thickness of the layers. The cuts are more or less homogeneous (see Figure 4).
The 2nd type is characterized by a regular decrease of the correlograms and an apparent periodic organization of the cuts. The cuts show a cyclic repetition of petrophysical properties which can be explained by a vertical succession of reservoirs and non reservoirs rocks. The cyclic configuration of type II is characterized by Ro = 10 - 15 m and Tmax = 69 - 90 m. These spectra testify that the frequency of the oscillatory movements is twice higher than in type I.
The 3rd type is close to the 2nd type, but differs of it by a more fine structure which indicates a reduction, within the interval, of cyclic repetition of petrophysical properties of the rocks. The spectra often present two spades poorly matched with close values of dispersion. The reservoirs are characterized by a great heterogeneity and a greater subdivision of the cuts with Ro = 5 - 10 m and Tmax = 50 - 68 m (see Figure 4).
The 4th type reflects the maximum heterogeneity and the total absence of cyclic organization of the cuts. For this last type, we observe a swift decrease of the correlograms, a fluctuation of the intensity lng and his oscillation around the x-axis. This type consists of spectra reflecting a great differentiation of the lnγ diagraphic structure One notes a polyperiodic composition of the graphs, showing that the vertical variation of petrophysical properties of reservoirs was relied to high frequency oscillatory movements. The cuts of this type, with Ro = 10 m and Tmax < 50 m, show a regular repetition of the petrophysical properties (see Figure 4).
4.1. Davidovskaya Field
Cyclicity of the cuts For this field, all identified correlograms and spectrograms are characterized by a regular periodicity of the cut (type II, III and IV). They are different from each other only by the Ro and Tmax values. Consequently, they have a different degree of organization of the cut. The type II is localised in South-East (wells 80, 60, 70, 79 and 59) and the types III and IV gather the cuts located in the West and North (zone of the wells P38, 53, 54, 33, 55, 105, 61, 63, 90, 65 and 67). The analysis of the charts of the Ro parameter and its trend shows a variation of the ray of correlation (Ro) between 4 and 16 m. The highest values are observed in South-East and the smallest ones are observed in the East of the field. The charts of maximum (Tmax) period are the same with the ray (Ro). The minimum values (Tmax < 50 m) are observed in the East of the field. The maximum values (Tmax > 75 m) are localised in the South-eastern and central parts (well 81) where the cut consists of non thick reservoirs layers (Figure 5).
Considering that the high value of Ro indicates a relative homogeneity of the cut described by the autocorrelation, the Davidovskaya field has a vertical heterogeneity related to the succession of reservoirs and non reservoirs rocks in the Eastern part of the field. The reservoirs rocks thicknesses increase towards the South-eastern and the central parts of the field.
4.2. Yuzno-Sosnovskaya Field
Cyclicity of the cuts Four (4) types are found in this field:
The 1st type with for period Tmax > 180 m, reflects the existence in the cuts of a long periodicity controlled by oscillatory movements which wavelength is almost equal to the total thickness of the layers. Cuts acquire from Eastern and South-eastern parts are more or less homogeneous (wells 126, 124, 119, 113, 47, 127, 121, 128, and 56). In the South (wells 108, 118) the homogeneity is not so pronounced.
The 2nd type is characterized by a periodic organization
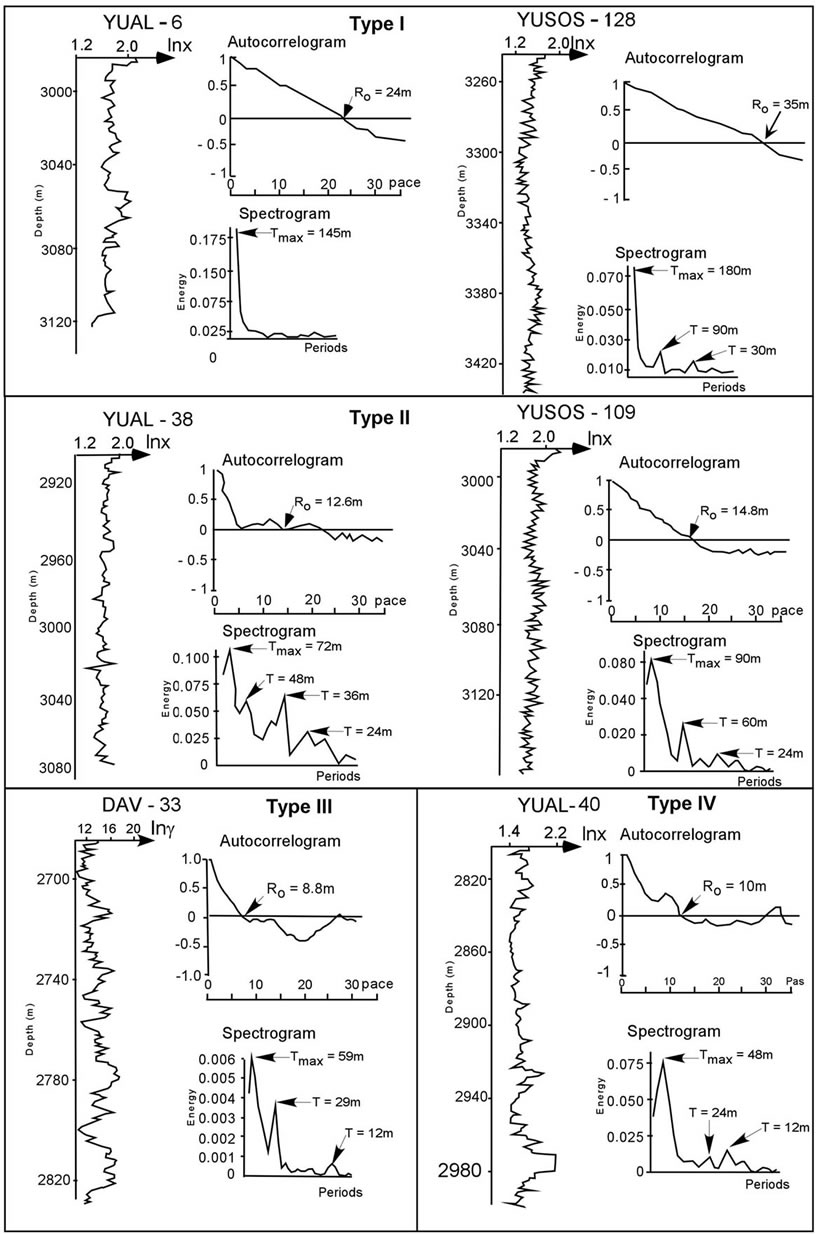
Figure 4. Neutron gamma logs and related types of correlograms and spectrograms (YUAL-X: Yuzno-Alexandrovskaya Field, well X; YUSOS-Y: Yuzno-Sosnovskaya Field, well Y; DAV-Z: Davidovskaya Field, well Z).
of the cut, with Tmax = 69 - 90 m. The organization periodicity covers a widespread area of the field: the West (wells 104, 109, 120, 131, 141, 140), the North (wells 100, 134) and the South-East (wells 107, 112).
The 3rd type characterises the cuts of the Southern and Western zones (wells 53, 117, 114, 113) but is also present in the North-East (well 125) of the field.
The 4th type is found only in the South (well 48) and somewhat in the North-East (well 135) of the field.
On Yuzno-Sosnovskaya field, analysis of Ro charts
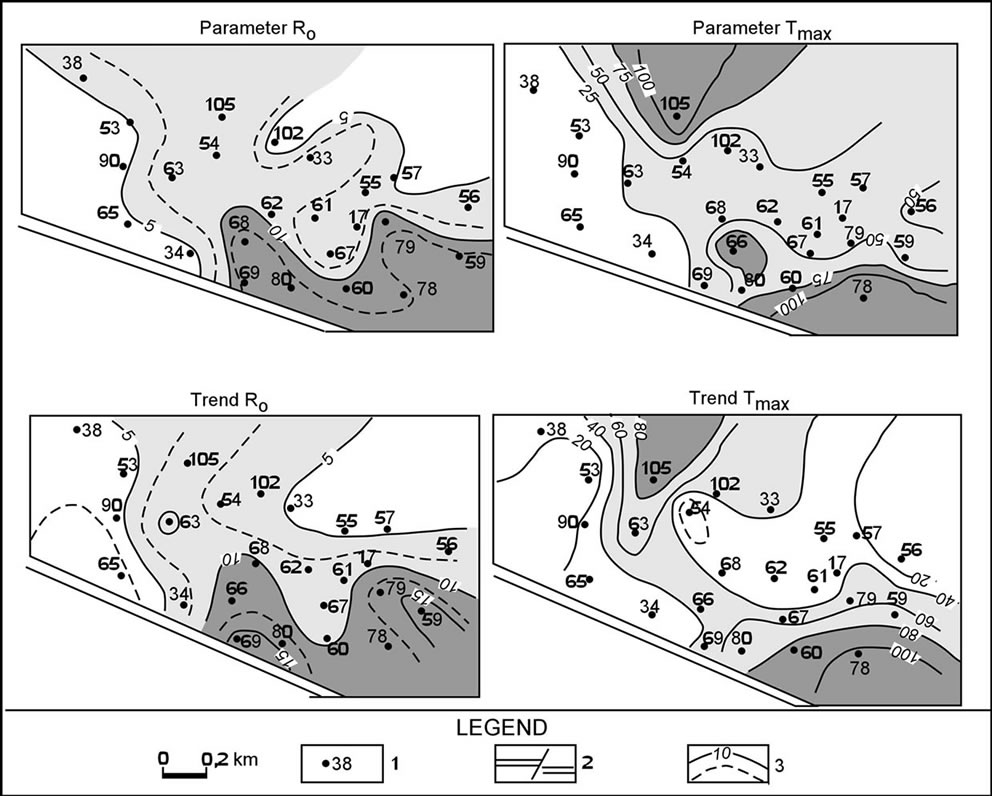
Figure 5. Reservoirs macroheterogeneity chart within Davidovskaya field 1: Site and well number; 2: Faults; 3: Isopacs of measured parameter.
shows the existence of a zonation in distribution of these parameters (Figure 6).
The zones with minimal values cover the North-West and are characterized by a southern most orientation. The zones of maximum values cover the central and southeastern parts of the field and are characterized by a north-western orientation. The zones of low values occupy the periphery of the structure. The charts of Ro trend give possibility to subdivide the field in two (2) different parts: the western and the north-western peripheral parts which are characterized by a soft variation of Ro. In each part the minimal values are in the form of submeridian linear zones. The central part of the field is dominated by the maximum values of Ro with isometric distribution in the zone of wells 127, 126, 103, 125, 118. The analysis of the Tmax charts shows two zones entirely different from shape and curves of the same values. In the West, a zone of distribution West-east and another in the central and southern parts of field are characterized by high values of period Tmax (Figure 6). The meeting of these announced zones is done in the area of the wells 117, 128, and 114 where the cuts present a minimal value of Tmax and more subdivision of the natural reservoir. It is a west-east directed linear zone.
4.3. Yuzno-Alexandrovskaya Field
Cyclicity of the cuts The correlograms and the spectrograms gather are of 3 various types:
The first type not structured, with a big ray (Ro) and a period equivalent to the total thickness of the productive complex occupies the Western and Eastern slopes of the anticline. The 2nd and 3rd types describe a rhythmic succession of reservoirs layers and false covers with average (for the 2nd type) and high (for the 3rd type) frequencies. They respectively occupy the flanks and the heart of the anticline.
The charts of the ray Ro and Tmax let observe several zones with minimal values (Figure 7).
They are the western zones (wells 32, 31, 33, 7), the eastern zones (wells 6, 53) and the heart of the structure (wells 5, 39) and south-east (wells 41, 50) of the field. The fields Yuzno-Alexandrovskaya and Yuzno-Sosnovskaya present a great similarity as well from the point of view of the space distribution of the heterogeneity as from the values of the examined parameters.
5. Structuring of the Oil Fields
The study of the sedimentation rhythms in the considered fields and the quantitative analysis of heterogeneity, as reflection of spatial distribution of the reservoirs properties, give possibility to propose charts of reservoirs structures. The zonation is made by juxtaposition of the charts of correlation ray (Ro) and maximum period (Tmax). The various zones are blocks whose limits correspond to facies variations (Figure 8) and are examined as the result of the tectonic activities of low amplitude, formed by vertical movements. On the tectonic level, these zones are structurally and genetically independent elements. Within each block, the processes of secondary
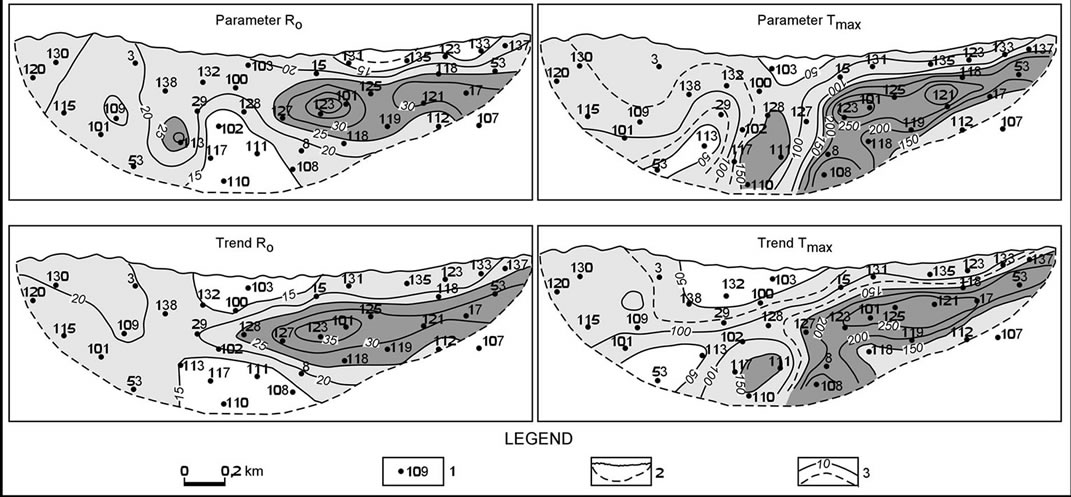
Figure 6. Reservoirs macroheterogeneity chart within Yuzno-Sosnovskaya field. 1: Site and well number; 2: Faults; 3: Isopacs of measured parameter.
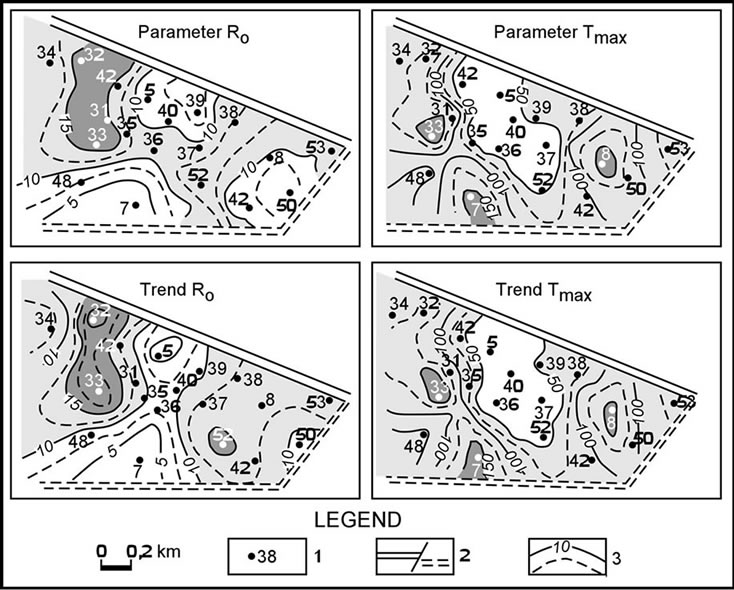
Figure 7. Reservoirs macroheterogeneity chart within YuznoAlexandrovskaya field. 1: Site and well number; 2: Faults; 3: Isopacs of measured parameter.
transformations proceeded in an identical way. At the same time, they are different in intensity and character from a block to another.
For Davidovskaya field (Figure 8), a structuring in linear blocks with 3 principal zones. The Eastern zone is subdivided from the point of view of the alternation of reservoirs layers and false covers. The central zone is characterized by relative increase thicknesses of reservoirs layers and false covers.
The south-eastern zone corresponding to the heart of the structure is characterized by an alternate organization of the more massive reservoirs layers and false covers. It contains the most porous zones of the basin.
For the Yuzno-Sosnovskaya field, the natural reservoir is characterized by a complex combination of reservoirs and not reservoirs layers, the existence of tectonic dislocations with various longitudinal and athwart ship orientations (see Figure 8). The amplitudes vary while increasing towards the NW, which indicates a late appearance of focussed dislocations, North-West or a reactivation of the last ones.
For the Yuzno-Alexandrovskaya field, it is released from the linear blocks whose most significant a submeridian orientation, with a width of 400 - 450 m. It recur all the structure and the fault of direction NW under an angle of 30˚ (see Figure 8).
6. Conclusion
The carbonated intersaliferous reservoirs of Eliets and Zadon horizons consist of carbonates which had undergone catagenetic stage of transformations (dissolution, recrystallization). The irregular distribution of zones of reservoirs rocks characterized by a secondary porosity led to the creation of great spatial (vertical and horizontal) macroheterogeneity. The autocorrelation function and spectral analysis used to evaluate the neutron gamma logs of the productive interval of the carbonated intersaliferous complex, have highlighted the existence of cyclicity in the sedimentation and secondary transformations of the reservoirs rocks. Taking into account the periods of various cycles, and the repartition of petrophysical characteristics of the reservoirs, it appears, on the studied fields, some isometric or linear blocks with common hydrodynamic regime. During controls of interferential continuity between the wells on the fields
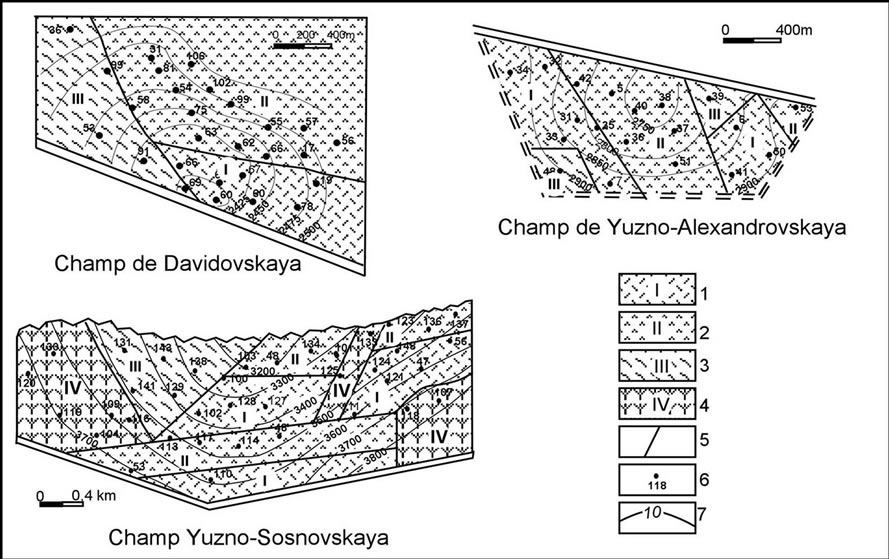
Figure 8. Reservoirs structural maps with indication of hydrodynamic blocks. 1-4 blocks: 1: block I; 2: block II; 3: block III; 4: block IV; 5: blocks Limits; 6: Site and well number; 7: Isopacs of the reservoir.
Yuzno-Sosnovskaya and Yuzno-Alexandrovskaya, the best interactions were observed between the wells of the same block. Consequently, to maintain the layers pressure during exploitation of the oilfields, we recommend consider the blocks which come into view for the implantation of water injection wells.
REFERENCES
- R. G. Garetsky, A. N. Boborykine and V. A. Boguino, “Significant Results of Oil Exploration and Exploitation Work in the Depression of Pripiat,” Methods and Orientation, Sciences and Technology, Minsk, 1984, pp. 1-228.
- A. Pap, “Crystalline Basement of Belorussia,” Nedra, Moscow, 1977, pp. 1-127.
- R. E. Ayzberg, R. G. Garetsky and V. Konichev, “Oil Prospects in the Pripiat Basin According to Its Particular Tectonics,” Geology of Oil and Gas, No. 9, 1974, pp. 8-16.
- I. I. Ouriev, A. S. Mahnatch and S. A. Kroutchek, “Facies of Limestones with Algae of Zadon-Eliets in the Complex Carbonated Inter Saliferous of the Pripiat Basin,” Communication Academy of Sciences of Byelorussia, Vol. 18, No. 10, 1974, pp. 917-920.
- V. Moskvitch, “Tectonic Regularity of the Carbonated Formations of Old Platforms,” Sciences and Technology, Minsk, 1990, p. 132.
- V. E. Haine and B. A. Sokolov, “Oil-Bearing RecifoGenesis and Potentialities. Essential Problems,” Geological Newspaper, Moscow, No. 5, 1991, pp. 9-11.
- I. P. Karsev, N. V. Nazarova, G. A. Kazenkina and L. A. Demidovitch, “Participation of Algal Limestones in the Oil Potentialities of the Inter Salt Devonian Formations in the North-East of the Pripiat Basin,” CommunicationAcademy of Science of Byelorussia, Vol. 16, No. 2, 1972, pp. 158-161.
- A. S. Mahnatch, V. A. Moskvitch, S. A. Kroutchek and I. I. Ouriev, “Organogenic Construction of Devonian in Byelorussia,” Sciences and Technology, Minsk, 1984, p. 236.
- E. V. Postnikov and A. I. Andruchenko, “Lithological and Facial Changes of the Carbonated Devonian Complex in the Pripiat Depression,” Lithology and Minerals, No. 4, 1990, pp. 17-23.
- G. A. Kazenkina, “Authigenous Minerals in the Carbonated Reservoirs of Zadon and Eliets Horizons as Indicator of the Oil Migration Time. Oils Potentialities of the Pripiat Depression,” Scientific Works, Ed. Sciences and Technology, Minsk, 1975, p. 241.
- C. Kaki, E. I. Taranenko and A. P. Ryjkov, “Hé- térogénéité des Réservoirs Naturels Carbonatés de Pétrole: Exemple des Réservoirs Intersalifères du Bassin de Pripiat (Biélorussie),” Oil & Gas Science and Technology, Vol. 55 No. 5, 2000, pp. 485-500.
- J. Mouillac, “Reservoir (Sandstone and Carbonate) Characteristics in Petroleum Exploration Geology,” Edition Total Professor Association (TPA), Paris, 2009, p. 248.
- A. P. Anpilogov and A. A. Gossoudareva, “Geological Interpretation of the Geophysical Material of the Pripiat Depression,” Sciences and Technology, Moscow, 1987, p. 271.
- N. Z. Zaliaev, R. M. Kaoufemane and L. P. Mamara, “Complex Interpretation of the Geophysical Parameters and Computerized Functional Transformations,” Geological and Oil Research of Byelorussia, Sciences and Technology, Minsk, 1981, p. 150.
- V. V. Massiouk, N. T. Araktchev and A. A. Gossoudareva, “Criteria of the Subdivision of the Carbonated Reservoirs Starting from Porosity and of the Content of Clay,” Geological and Oil Research of Byelorussia, Ed. Sciences and Technology, Minsk, 1976, p. 321.
- A. E. M. Berthier, “Déplacements Immiscibles dans des Carbonates Vacuolaires: Expérimentations et Modélisation,” Thèse de Doctorat, Institut de Physique du Globe, Paris, 2003, p. 177.
- A. B. Vistelius, “Expression of the Results of Fossilization of the Oscillatory Movements of the Earth’s Crust,” Communication—Academy of Science of the USSR, Moscow, Vol. 49, No. 7, 1945, pp. 531-535.
- P. D. Knoring and V. N. Dech, “Oscillatory Movements Study by Detection of the Masked Periodicities,” Soviet Geology, No. 5, 1972, pp. 81-93.
- R. A. Fisher, “Statistical Methods and Scientific Inferences,” Olivier and Boyd, Edinburgh, 1973.
- V. N. Dech, “Interpretation of Well Logs Data by the Theory of Random Functions for Lithological Correlation of the Wells,” Geology of Oil and Gas, No. 8, 1977, pp. 59-66.
- J. C. Davis, “Statistics and Analyze Data in Geology,” (Translated from English into Russian), Nedre, Moscow, 1990, p. 320.
- M. J. Rendas, “Traitement Statistique du Signal. Processus stochastiques,” ISINMA, 2005, p. 35.
- S. Lambert-Lacroix, “Autocorrélation Partielle des Processus à Temps Discrets non Stationnaires et Applications,” Ph.D. Thesis, Université Joseph Fourier, Grenoble, 1998, p. 152.
NOTES
*Corresponding author.