Engineering
Vol.5 No.10(2013), Article ID:36977,9 pages DOI:10.4236/eng.2013.510097
Freeze-Thaw Effect on Coarse Sand Coated Interface between FRP and Concrete
Infrastructure Research Department, Korea Institute of Construction Technology, Goyang, South Korea
Email: kcho@kict.re.kr, sypark@kict.re.kr, esper009@kict.re.kr, chojr@kict.re.kr, bskim@kict.re.kr
Copyright © 2013 Keunhee Cho et al. This is an open access article distributed under the Creative Commons Attribution License, which permits unrestricted use, distribution, and reproduction in any medium, provided the original work is properly cited.
Received August 5, 2013; revised September 5, 2013; accepted September 12, 2013
Keywords: Freeze-Thaw; Coarse Sand Coating; Interface Failure; FRP; Concrete
ABSTRACT
This paper examines the effect of freezing and thawing on the coarse sand coating chosen to achieve the composition of FRP and concrete in FRP-concrete composite deck. Push-out test specimens with dimensions of 100 × 100 × 450 mm were subjected to repeated freeze-thaw cycles under wet conditions ranging from −18˚C ± 2˚C to 4˚C ± 2˚C. The failure strength of the interface and the deformation of FRP at failure exhibited by the specimens that experienced 300 freezing-thawing cycles showed a difference of merely 5% compared to those of the specimens that were not subjected to freeze-thaw. This indicates that coarse sand coating is not affected by freezing-thawing cycles and the FRP-concrete composite deck owns sufficient applicability in terms of durability against freezing-thawing.
1. Introduction
Strong composition between the FRP (Fiber Reinforced Polymer) panel and concrete is necessary to achieve the FRP-concrete composite deck. The method usually adopted to realize such composition is the coarse sand coating. This method is different from the epoxy bonding applied for repair and strengthening. Epoxy bonding can be applied to stick FRP sheets or panels on existing structures as done for repair and strengthening but becomes difficult in FRP-concrete composite deck since concrete is placed over the FRP panel. Therefore, coarse sand is epoxy-bonded preliminary on the FRP panel before placing concrete so as to provide shear connection by means of the gears formed between the irregularities of the small aggregates and concrete (Figure 1).
The shear connection performance of coarse sand coating depends on the bonding performance between the small aggregates and FRP panel and the gear performance between the sand and concrete. The bonding performance between the small aggregates and FRP panel is subordinated to the bonding performance of epoxy whereas the gear performance between sand and concrete is influenced by the strength of concrete. Coarse sand coating exhibits optimal static performance when it is realized using sand with grain size of 4 - 7 mm and density of 4 kg/m2 [1]. In such case, the interface develops shear composition capacity close to perfect composition [2]. However, since the FRP-concrete composite deck using coarse sand coating is installed outdoor, the shear connection performance of coarse sand coating is unavoidably affected by environmental factors such as freezing and thawing.
Generally, FRP is insensitive to freezing and thawing [3-5]. Besides, epoxy and concrete are known to be easily damaged by the degree of water content or freezing-thawing [6,7]. Apart from such material factors, the water trapped between FRP and concretemay provoke damage at the interface by dilatation and contraction of its volume under freezing and thawing. Moreover, dam-

Figure 1. Coarse sand coated FRP panel.
age may also occur due to the different degrees of thermal dilatation experienced by FRP and concrete. Even if several studies were dedicated to observe the level of damage caused by freezing and thawing in the field of repair and strengthening [8-12], these studies failed to provide consistent results. In addition, an experimental study performed to evaluate the freeze-thaw effect on sand-coated FRP reinforcing bars embedded in concrete, which can be assumed as a connection method similar to coarse sand coating, revealed the absence of damage caused by freezing and thawing [13].
This review shows that the previous studies failed to provide consistent evaluation of freezing and thawing on the shear connection performance between FRP and concrete. Furthermore, the absence of research devoted to the evaluation of the freeze-thaw effect on coarse sand coating applied on structures presenting large surfaces like the FRP-concrete composite deck is also noteworthy. Consequently, this study intends to evaluate the freezethaw effect on the composition performance of coarse sand coating used to achieve the composition of the FRPconcrete composite deck.
2. Experimental Program
2.1. Freeze-Thaw Experimental Program
Concrete subjected to freezing and thawing experiences not only performance changes due to freezing and thawing but also performance changes according to time. Therefore, need is to exclude the ageing-induced performance changes in order to examine only the changes of the performance provoked by freezing and thawing. To that goal, specimens subjected to freezing-thawing as well as specimens that were not subjected to freezingthawing were fabricated to allow comparison. Table 1 arranges these specimens. Two freeze-thaw specimens were manufactured for each set of freezing-thawing cycles and the numbers of cycles were set to 50, 100, 200 and 300. The specimens for constant temperature and humidity room were fabricated at sets of 3, 2 and 2 units corresponding respectively to 0, 100 and 300 freezingthawing cycles. In addition, compression cylinders were also manufactured to allow observation of the performance changes of concrete subjected to freezing and thawing.
There is currently no unified specification relative to the number of freeze-thaw cycles to be applied when evaluating the freeze-thaw effect on the interface. The number of freeze-thaw cycles varies slightly according to the researcher. This study assumed that the factor having the largest effect on the performance of the interface is the concrete itself. Accordingly, the freeze-thaw cycles were determined with respect to the accelerated test method [14] in order to evaluate the freeze-thaw effect of concrete. The temperature range specified in the standard test method is –18˚C ± 2˚C - 4˚C ± 2˚C, and the time required for one cycle runs from 2 to 5 hours. Moreover, freezing-thawing under wet state was selected because it provides harsher conditions than the dry freezing-thawing. Figure 2(a) shows such freezing-thawing cycles
 (a)
(a)  (b)
(b)
Figure 2. Freezing-thawing cycles. (a) Freeze-thaw test method; (b) Actually measured freeze-thaw cycles.

Table 1. Details of the specimens.
and, Figure 2(b) plots the actually measured freezingthawing cycles. The temperature range felt from –18˚C to 6˚C and the time required for once cycle averaged 4.3 hours, which satisfied the standard test method. Figure 3 pictures the freeze-thaw testing apparatus and the specimens installed in the constant temperature and humidity chamber.
2.2. Specimen Details
The specimens were fabricated as push-out shear test specimens as shown in Figure 4. The external dimensions of the specimens are 100 × 100 × 450 (length × width × height, mm), and the connected section of FRP and concrete is 300 mm long. Even if the length of this connected section is shorter than the effective length of the coarse sand coating connected section, this length will not provoke problem since performance comparison is done on specimens with identical shapes. Steel reinforcing bars with diameter of 6 mm were arranged to prevent failure of concrete. Steel plates with thickness of
 (a)
(a)  (b)
(b)
Figure 3. Freeze-thaw test apparatus and storage of specimens in the constant temperature and humidity chamber. (a) Specimens installed in the freeze-thaw testing apparatus; (b) Specimens stored in the constant temperature and humidity chamber.
3 mm were attached at the fixed end to prevent bearing failure of FRP.
The FRP plate is made of GFRP and presents a thickness of 6 mm. The mechanical properties of this plate are summarized in Table 2. The adhesiveness of coarse sand coating was increased by sand blasting of the section of the plate to be connected with concrete.
The bonding performance at the coarse sand coating interface depends mainly on the bond performance between FRP and coarse sand and the bond performance between coarse sand and concrete. Here, the bond performance between coarse sand and concrete is directly subordinated to the damage of concrete. Accordingly, the degree of damage caused by freezing-thawing of concrete should be similar to that occurring in reality in order to observe the performance change of the coarse sand coated surface caused by freezing and thawing as set as the purpose of the test. To that goal, concrete was fabricated in compliance with the Concrete Standard Specifications [15]. Especially, the fabrication was executed to secure an air content superior to 4.5% according to the specifications, and the resulting air content was measured to be 6%.
After placing, the specimens were subjected to 28 days of water curing followed by drying during three days in the constant temperature and humidity chamber. The corresponding compressive strength of concrete was 24.6 MPa.
Coarse sand coating was applied on the connected section of the FRP plate. Epoxy was applied on the FRP plate followed by bonding of small aggregates with diameter of 4 - 7 mm distributed at a rate of 4 kg/m2.
2.3. Testing Procedure and Measurements
Since the specimens that completed the freeze-thaw cycles were in wet conditions and the specimens stored in the constant temperature and humidity chamber were in dry state, the water contents of both types of specimens were naturally different. Therefore, need was to fit the water content levels of the two types of specimens. To that goal, the specimens that completed the freeze-thaw cycles were dried during three days in the constant temperature and humidity chamber prior to the execution of the test.
The specimens were installed for pull-push out test on a UTM (Universal Testing Machine) with capacity of 1000 kN as shown in Figure 5. Semi-circular spacers were disposed on the top of concrete to minimize the effect of the flexural moment that could occur in the push-out shear test. Strain gauges were installed on the top of concrete and both sides of the FRP plate to measure the relative displacement between concrete and the FRP plate.

Figure 4. Shape of specimens and layout of gauges (units: mm).

Table 2. Mechanical properties of the FRP plate.
However, the size of the displacement occurring at the interface being very small, large disturbance was likely to happen even under small motions induced during the installation and test. Therefore, strain gauges were installed at interval of 50 mm on both sides of the FRP plate in each specimen to supplement this problem.
These strain gauges were used to obtain not only the stress distribution of the FRP plate but also the deformation of the FRP plate by means of integration.
Loading was applied by displacement control at speed of 0.2 mm/min until failure. Figure 6 shows a view of the test.
3. Experimental Results and Discussion
3.1. Consideration of Eccentricity
The push-out shear test is generally accompanied by unintended eccentricity leading to the application of different loads at both sides of the specimen. In such case, if failure occurs on the side subjected to the larger load, the other side also fails even before having reached the failure strength because of the concentration of the load that was distributed on both sides. This situation results in the failure of the whole specimen. Figure 7(a) illustrates the typical failure pattern of the specimens in which failure occurred on the right-side surface. Figure 7(b) plots the relation between the load and the strain measured by gauges S0L and S0R (Figure 5). Since gauges S0L and S0R are disposed at locations outside the section connecting FRP and concrete, the strains measured by these gauges depend only on the acting load. In the figure, the larger load acts on the right-side and leads to larger strain on the right. This results in the failure of the right-side surface. Accordingly, the composition strength between FRP and concrete should be computed with respect to the side experiencing failure. In addition, the corresponding failure load should consider the effect of the eccentricity of the specimen.

Figure 5. Installation of specimen and measurement locations.

Figure 6. View of installed specimen.
The loads acting on both sides of the specimens considering the eccentricity can be obtained easily from the strains measured by gauges S0L and S0R using the following equations.
 (a)
(a) (b)
(b)
Figure 7. Eccentric load pattern of push-out shear test. (a) Failure pattern of the specimens; (b) Difference of the loads at both sides of the push-out shear test specimens.
 (1)
(1)
 (2)
(2)
where P is the total load applied on the specimen; PL and PR are the left-side and right-side loads considering the eccentricity; and ε0L and ε0R are the strains measured by gauges S0L and S0R.
3.2. Failure Strength
Table 3 and Figure 8 arrange the mean values of the strength according to the number of freeze-thaw cycles. Here, the interface failure strength stands for the failure load of the section considering the eccentricity. The compressive strength of the cylinder does not exhibit significant difference regardless of the execution of freezingthawing or the elapsed time. Accordingly, the compressive strength of concrete can be seen to be relatively insensitive to freezing and thawing. Besides, the interface failure strength of the specimens shows large difference
 (a)
(a)  (b)
(b)
Figure 8. Strength change pattern according to the number of freeze-thaw cycles. (a) Failure strength of interface; (b) Compressive strength of compression cylinder.

Table 3. Pattern of strength change according to the number of freeze-thaw cycles.
with respect to the number of freeze-thaw cycles. For the specimens of CT series that did not experienced freezethaw, small strength was observed only during the first cycles to become nearly constant after a larger number of cycles. For the specimens of FT series that experienced freeze-thaw, low strength was observed until 200 cycles to become similar to the CT series specimens after 300 cycles. In other words, the strength of the specimens does not exhibit specific pattern according to the number of freeze-thaw cycles nor the elapsed time.
Such inconsistent behavioral pattern seems to be attributable to the effects of unintended factors induced by the testing procedure like the drying time of the specimens. The push-out test was executed on the specimens that were dried in the constant temperature and humidity room during a definite period after completion of the water curing or completion of the freeze-thaw cycles. The reason for the drying of the specimens relied on the will to exclude possible effects due to the difference of water content between the specimens. The specimens were actually dried as listed in Table 4. Here, the drying time for the specimens of CT series corresponds to the period starting from the time at which the specimen is introduced in the constant temperature and humidity room after completion of water curing to the time of test.

Table 4. Drying time per specimen.
The drying time of the specimens of FT series stands for the period from the time at which the specimen is introduced in the constant temperature and humidity room after completion of the relevant freeze-thaw cycles to the time of test. Specimens CT000, FT050, FT100 and FT200 that experienced drying time shorter than 6 days were also those for which low interface failure strength appeared. On the other hand, specimens CT100, CT300 and FT300 that were subjected to drying time longer than 15 days exhibited nearly similar interface failure strength regardless of the execution of freeze-thaw. This implies that the interface failure strength is more influenced by the water content level in the specimens rather than the cyclic undergoing of freezing and thawing. Especially, the fact that the interface failure strength of specimens FT300, which experienced 300 freeze-thaw cycles, was practically identical to those of specimens CT100 and CT300 indicates that the composition capacity brought by coarse sand coating is quasi-insensitive to the freezethaw effect.
Even if the compression cylinders were dried identically to the specimens, the size of the cylinders being significantly smaller than the specimens and the absence of FRP plate that could impede drying enabled fast drying, which was without effect on the strength.
3.3. Failure Pattern
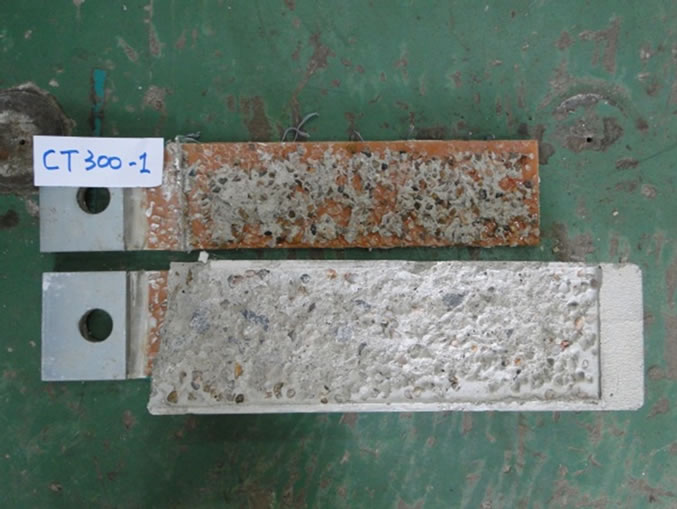
The specimens failed at first at the side on which the larger load acted as shown in Figure 7. At that time, the pattern of the failed surface differed according to the bond strength between FRP and coarse sand and to the relative size of the bond strength between coarse sand and concrete. If the bond strength between FRP and coarse sand is larger than the bond strength between coarse sand and concrete, failure occurs mainly in the concrete side. In the opposite case, coarse sand separates from the FRP surface. Figure 9 illustrates the failed surface of specimens CT300 and FT300. It can be observed that specimens CT300 failed mostly in the concrete side. This can be explained by the slightly larger compressive strength of specimens FT300 as shown in Figure 8(b). However, the interface failure strength induced by such difference in the failure pattern did not appear to be significant between the two types of specimens as illustrated in Figure 8(a). Accordingly, the composition performance of coarse sand coating can be seen to be relatively insensitive to cyclic freeze-thaw.
3.4. Load-Displacement Relation
If no performance loss of the coarse sand coating is provoked by cyclic freezing-thawing, the load-relative displacement relationship at the interface should be similar. However, the values measured by the gauges installed as shown in Figure 5 cannot be applied as they are to verify such relationship. This is due to the small values of the relative displacement to be measured, which makes the measurement polluted by non-negligible errors brought the damage of concrete of the corners at the top of the specimens or slight rotation of the specimens caused by the eccentricity during the push-out shear test. As an example, Figure 10 shows the scattering of the load-displacement curves. Here, the relative displacement represented in the horizontal coordinate axis is the mean value of the displacements measured at both sides of the FRP
 (a)
(a)  (b)
(b)
Figure 9. Typical failure patterns. (a) CT300; (b) FT300.

Figure 10. Load-relative displacement curves.
from which the displacement measured of concrete at the center has been subtracted. Moreover, this case presents the disadvantage of not considering the eccentric action of the load.
To overcome this problem, this study intended to obtain the relative displacement using the deformation at the extremity of the connected section of FRP instead of the measured displacements. The deformation, δ, at the extremity of the connected FRP section can be obtained by integrating the strain as expressed in Equation (3).
 (3)
(3)
Equation (3) provides the displacement under the condition that the strain of the whole connected surface is known. However, the measurement of the strain being possible only at the limited measurement locations, Equation (3) needs to be discretized in order to obtain the displacement at the extremity of FRP. Figure 11 depicts the relation between the strain at the FRP connected surface (dotted line) and the measured strain. The measured strain can be assumed as the mean strain within a given section. Accordingly, the strain at the extremity of the FRP connected surface can be approximated using the following equation.
 (4)
(4)
where ei is the measured strain; and, Li is the tributary length of the gauge. This length is 50 mm since the strain gauges were installed at interval of 50 mm on the specimens.
Figure 12 plots the load-displacement curves for CT300 specimens that did not experienced freeze-thaw and FT300 specimens that experienced 300 cycles of freezing-thawing. The displacement is obtained by Equation (4) applied on the failed surface, and the load considers the eccentricity as the load of the failed side. It can be seen that the specimens of CT300 series and FT300 series are exhibiting similar behavior. In addition, the interface failure strength of FT300 specimens is 40.9 kNwhich results in an error of approximately 4% compared to the 40.9 kN of FT300 specimens. Similarly, the displacement at failure of CT300 specimens being 0.437 mm shows a small error of about 5% compared to the displacement of 0.457 mm derived for the FT300 specimens. In view of these results, it can be concluded that the performance of the coarse sand coated interface is not affected by the effect of freeze-thaw.
4. Conclusions
The freeze-thaw effect on coarse sand coating used to combine FRP and concrete in the FRP-concrete composite deck has been investigated. To that goal, freeze-thaw cycles (–18˚C ± 2˚C - 4˚C ± 2˚C) were applied under wet condition on push-out shear test specimens with dimensions of 100 × 100 × 450 mm.
The specimens subjected to respectively 50, 100 and 200 freeze-thaw cycles exhibited smaller shear strength than the specimens that did not experience cyclic freezethaw, but such result could be attributed to the insufficient drying time of the freeze-thaw specimens. Besides, the specimens subjected to 300 freeze-thaw cycles showed a difference of the interface failure strength smaller than 5% compared to the specimens that did not experience cyclic freeze-thaw. Since this observation was derived from the specimens that were subjected to the largest number of freeze-thaw cycles among the whole set of tests, it could be concluded that coarse sand coating is not affected by the freeze-thaw effect. This confirmed that coarse sand coating bears sufficient applicability for the composition of FRP-concrete composite deck in terms of durability against freezing-thawing. In future, it should be verified at in situ condition.

Figure 11. Computation of the deformation of the FRP plate using strain integration.

Figure 12. Load with respect to the integrated strain.
5. Acknowledgements
This research was supported by a grant from Strategic Research Project (Development of deck systems for hybrid cable-stayed bridge, Development of Smart Prestressing and Monitoring Technologies for Prestressed Concrete Bridges) funded by Korea Institute of Construction Technology.
REFERENCES
- J.-R. Cho, K. Cho, S. Y. Park, S. T. Kim and B.-S. Kim, “Bond Characteristics of Coarse Sand Coated Interface between Stay-in-Place Fibre-Reinforced Polymer Formwork and Concrete Based on Shear and Tension Tests,” Canadian Journal of Civil Engineering, Vol. 37, No. 5, 2010, pp. 706-718. http://dx.doi.org/10.1139/L10-012
- K. Cho, J.-R. Cho, W.-J. Chin and B.-S. Kim, “Bond-Slip Model for Coarse Sand Coated Interface between FRP and Concrete from Optimization Technique,” Computers & Structures, Vol. 84, No. 7, 2006, pp. 439-449. http://dx.doi.org/10.1016/j.compstruc.2005.10.004
- M. A. Abanilla, Y. Li and V. M. Karbhari, “Durability Characterization of Wet Layup Graphite/Epoxy Composites Used in External Strengthening,” Composites Part B: Engineering, Vol. 37, No. 2-3, 2006, pp. 200-212. http://dx.doi.org/10.1016/j.compositesb.2005.05.016
- J. Hulatt, L. Hollaway and A. Thorne, “Preliminary Investigations on the Environmental Effects on New Heavy Weight Fabrics for Use in Civil Engineering,” Composites Part B: Engineering, Vol. 33, No. 6, 2002, pp. 407- 414. http://dx.doi.org/10.1016/S1359-8368(02)00034-3
- M. A. G. Silva, “Aging of GFRP Laminates and Confinement of Concrete Columns,” Composite Structures, Vol. 79, No. 1, 2007, pp. 97-106. http://dx.doi.org/10.1016/j.compstruct.2005.11.033
- E. A. Byars, P. Waldron, V. Dejke, S. Demis and S. Heddadin, “Durability of FRP in Concrete Deterioration Mechanisms,” International Journal of Materials and Product Technology, Vol. 19, No. 1-2, 2003, pp. 28-39. http://dx.doi.org/10.1504/IJMPT.2003.003554
- A. M. Neville, “Properties of Concrete,” Wiley, New York, 1996.
- P. Colombi, G. Fava and C. Poggi, “Bond Strength of CFRP-Concrete Elements under Freeze-Thaw Cycles,” Composite Structures, Vol. 92, No. 4, 2010, pp. 973-983. http://dx.doi.org/10.1016/j.compstruct.2009.09.044
- V. M. Karbhari and L. Zhao, “Issues Related to Composite Plating and Environmental Exposure Effects on Composite-Concrete Interface in External Strengthening,” Composite Structures, Vol. 40, No. 3-4, 1997, pp. 293- 304. http://dx.doi.org/10.1016/S0263-8223(98)00031-2
- M. A. G. Silva and H. Biscaia, “Degradation of Bond between FRP and RC Beams,” Composite Structures, Vol. 85, No. 2, 2008, pp. 164-174. http://dx.doi.org/10.1016/j.compstruct.2007.10.014
- K. V. Subramaniam, M. Ali-Ahmad and M. Ghosn, “Freeze-Thaw Degradation of FRP-Concrete Interface: Impact on Cohesive Fracture Response,” Engineering Fracture Mechanics, Vol. 75, No. 13, 2008, pp. 3924- 3940. http://dx.doi.org/10.1016/j.engfracmech.2007.12.016
- H. A. Toutanji and T. El-Korchi, “Tensile Durability of Cement-Based FRP Composite Wrapped Specimens,” Journal of Composites for Construction, Vol. 3, No. 1, 1999, pp. 38-45. http://dx.doi.org/10.1061/(ASCE)1090-0268(1999)3:1(38)
- K. Laoubi, E. El-Salakawy and B. Benmokrane, “Creep and Durability of Sand-Coated Glass FRP Bars in Concrete Elements under Freeze/Thaw Cycling and Sustained Loads,” Cement and Concrete Composites, Vol. 28, No. 10, 2006, pp. 869-878. http://dx.doi.org/10.1016/j.cemconcomp.2006.07.014
- ASTM Standard C666/C666M-03, “Standard Test Method for Resistance of Concrete to Rapid Freezing and Thawing,” ASTM International, 2008.
- Ministry of Land, Transport and Maritime Affairs, “Concrete Standard Specifications,” 2009.