Agricultural Sciences
Vol.10 No.07(2019), Article ID:93714,15 pages
10.4236/as.2019.107069
The Effect of Miscanthus Cultivation on the Biodiversity of Ground Beetles (Coleoptera: Carabidae), Spiders and Harvestmen (Arachnida: Araneae and Opiliones)
Michael A. Williams1, Alan Feest1,2*
1Ecosulis Ltd., Bath, UK
2Faculty of Engineering, University of Bristol, Bristol, UK

Copyright © 2019 by author(s) and Scientific Research Publishing Inc.
This work is licensed under the Creative Commons Attribution International License (CC BY 4.0).
http://creativecommons.org/licenses/by/4.0/


Received: June 4, 2019; Accepted: July 15, 2019; Published: July 18, 2019
ABSTRACT
In-crop invertebrate biodiversity of the perennial rhizomatous biomass crop Miscanthus was compared to the in-crop invertebrate biodiversity of adjacent agricultural land-uses. Ground beetles and arachnids (spiders and harvestmen) were used as indicators of invertebrate biodiversity and caught using pitfall traps over two years. Biodiversity measurements used were species richness, biomass, abundance, Simpson’s Index, and rarity values. The Miscanthus plantation had a significantly lower ground beetle and arachnid species richness, biomass and abundance than an adjacent mixed-use arable field and a significantly lower ground beetle biomass and abundance than an adjacent grassland. Reduced weed vegetation and lack of insects that feed on Miscanthus are likely to be significant factors. The findings contradict the conclusions of a previous study of Miscanthus impact on butterflies. This is the first major study to assess the in-crop biodiversity of an established plantation and shows that Miscanthus invertebrate biodiversity is poor in established plantations, when compared to adjacent conventional agricultural land-uses.
Keywords:
Biomass, Energy Crops, Biodiversity Quality, Species Richness, Simpson’s Index, Rarity

1. Introduction
The substantial changes in land use in order to grow biomass crops risks biodiversity loss due to the destruction of natural habitats, and the loss of large areas of land used for food production and forestry [1] . The impact on biodiversity where biomass crops are to be grown on agricultural land will depend on the current land use. Biomass crops, where used appropriately, may reduce carbon emissions, however biomass production that will seriously reduce biodiversity should not be considered truly sustainable [2] . A study by Eggers et al. [3] indicated that more species may suffer from habitat losses than benefit from an increased biofuel target. The impact of energy crop production is likely to vary spatially and depend on the crop grown, and woody crops may be less detrimental than arable crops. The use of native, perennial species (particularly in polyculture or multi-year rotation) is, in theory, likely to have less of an impact on biodiversity than energy-intensive monocultures of annual crops [4] . This would result from the preadapted biology of native species and the lack of disturbance by ploughing, pesticide application and cropping. The Royal Commission on Environmental Pollution [5] stated “the impact of energy crops on biodiversity has not been a topic of significant research in the UK, partly due to the absence of large scale plantations”. The RCEP also suggested that the impact of energy crops on wildlife would “depend on the type of land use being displaced and the vegetation in adjoining areas”. Essentially, any studies on the impact of energy crops on biodiversity would be limited to specific sites.
The sterile hybrid perennial rhizomatous grass Miscanthus × giganteus, a hybrid of M. sacchariflorus × M. sinensis, is used as a biomass crop and has been grown as a monoculture in England since the 1990’s. Once planted, Miscanthus can remain in the ground for fifteen to twenty years. New shoots emerge in March and grow rapidly throughout the summer, producing large canes (Defra 2007). Miscanthus can be used to produce heat or electricity on a range of scales from large power stations to small scale systems for farm usage or single buildings. At present, Miscanthus is grown in the UK for biomass (amongst other uses) on a small scale, however it is attracting the attention of large agricultural enterprises seeking to reduce their environmental impact. Approximately 9000 ha of Miscanthus was grown for bioenergy production in the UK in 2010, with around half of the yield being used in power stations [6] . Miscanthus is thus different from other crops in being perennial, of considerable crop density and height, and being harvested over winter.
The measurement of biodiversity is problematic and it is clear that no single measure of biodiversity will be adequate [7] . Currently, the majority of approaches to biodiversity use species-richness as a measure of assessing the quality of biodiversity in a given area and/or biodiversity indices that measure evenness or dominance, such as the Shannon-Wiener and Simpson’s Indices, and Berger Parker Index [8] . Species-richness does not consider the relative abundance of individuals and values each species equally, when some species may be more important than others in terms of rarity, biomass etc., and such indices in isolation may give misleading results [9] [10] . Feest [10] and Feest et al. [11] demonstrated how the use of a variety of measurements of biodiversity can produce a more holistic assessment of a site. The measurements proposed are species richness, biomass, abundance, Simpson’s Index of diversity and species conservation value index (based on the rarity/commonness of organisms). Biomass, in particular, is frequently overlooked as a component of ecosystems in ecological studies and may produce different results to abundance [12] . Biomass estimates can be calculated based on a measurement of an organism such as length [13] . The conservation status of species can be obtained where the group is well-studied and information on distribution is available, such as atlases and Red Data Books. The approach used by [10] [11] will therefore be used in order to consider a variety of biodiversity measurements in the present study.
The aim of the present study was to assess the impact of the cultivation of biomass crops on biodiversity. The study focused on Somerset, England, UK where areas of land were being used to cultivate Miscanthus. In order to assess the impact, the biodiversity of the adjacent crops were also studied and compared to the findings within the biomass crop plantations. Miscanthus grows very densely and can in time annually reach a height of 3 m shading out all competing plant growth. Miscanthus appears to have left its accompanying invertebrates behind and harbours very few. Any invertebrate living in a dense Miscanthus crop will have difficulty in finding food if it does not consume Miscanthus so one would expect that the crop would be low in invertebrate biodiversity.
We have studied spiders and beetles as representing two frequently used indicator groups allowing comparisons with beetles being phytophagus and predatory (or both) and spiders predatory.
The purpose of this study was to test the following hypothesis:
H1 The cultivation of monocultures of a Miscanthus crop has a significant effect on the invertebrate biodiversity quality when compared to the land-use it replaces.
In this hypothesis biodiversity is defined as a quality described by a series of indices as proposed by Feest [11] .
2. Materials and Methods
2.1. Study Site
The sampling approach used by Feest [10] [11] was used in order to consider the variety of biodiversity measurements in the present study which was undertaken between November 2008 and January 2010 at Fennington Farm, located in Fennington, Kingston St Mary, Somerset, in south-west England, UK. Miscanthus is grown extensively on the farm and in the surrounding area. The Miscanthus field studied (51˚3'44"N 3˚8'47"W) was planted in spring 2003, is approximately 1.5 ha, and adjoins another 3.5 ha Miscanthus plantation to the east from which it is separated by a small hedgerow. The crop was very well established and without “thin” patches where establishment had failed. The adjacent fields studied are a mixed-use arable field to the south-east of the Miscanthus field (winter barley from December 2008 to September 2009, turnips from September 2009 to May 2010 and linseed from May 2010 to January 2011) of approximately 8.1 ha and a grassland field to the south of the Miscanthus field approximately 3.5 ha, which was used occasionally throughout the project for sheep grazing, horse shows and silage. The two control plots for comparison are typical of the surrounding landscape and are suitable for Miscanthus cultivation. The grassland field was seeded approximately 20 years prior to the start of surveys and the mixed-use arable field has been used for arable crops for over 30 years, usually for maize, wheat, barley and linseed. The distance between the Miscanthus field and adjacent fields is approximately 6 m. The soil is red clay with poor drainage (see Appendix).
2.2. Sampling
Pitfall traps were set in all three fields in mid-October 2008 until January 2011 and were collected on a monthly basis. In each field, twenty pitfall traps were placed at intervals, following the sampling layout described in Feest [10] such that most of the field was sampled following a line transect with traps at 20 m intervals. Identical plastic cups were used with a top diameter of 75 mm and depth of 95 mm and the traps were positioned to be flush with the ground surface. The traps were filled to approximately 1/3 full with a mix of 1:3 ethylene glycol (commercial anti-freeze) and tap water. A 100 × 100 mm square of wire mesh with the wires spaced at 10 mm intervals was placed on top of the traps and pinned in place, leaving a 1 cm gap between the top of the trap and the wire mesh to exclude vertebrates. Collection was undertaken on a monthly basis, with traps from the three fields collected on the same day. The barley was harvested and replaced with turnips in September 2009, and in May 2010 the field was again ploughed and the linseed crops planted. Traps were not set in the mixed-use arable field in those months when the soil was disturbed. The Miscanthus field was cut in March 2009 and April 2010, during which time traps were removed from all fields as there was no comparable data from the Miscanthus crop. Apart from the good establishment of the crop we observed that the clay soil had become very hard and this might differ from crops established on sandy soils otherwise we have no reason to believe the site differed greatly from other sites we have visited. Species identification was determined using the following: Beetles: Luff [14] ; spiders: Roberts [15] [16] and harvestman: Hillyard [17] .
2.3. Biodiversity Measurements
The pitfall trap data was analysed using the BQC programme (http://www.ecosulis.co.uk) to calculate the “biodiversity quality” [10] [11] of the species caught at each site. BQC allows the allocation of properties such as biomass or rarity to each species and calculates a range of “biodiversity quality” indices. The use of a range of indices allows the comparison of data and the “qualities” of the biodiversity; for example two samples might have the same species richness but one site may have significantly rarer or larger species than the other. It is by reflecting on the full range of indices that difference can be discovered. Anderson-Darling tests showed that in the vast majority of incidences the data was non-normal parametric, and therefore Mann-Whitney tests were used to test for a significant difference between the indices, with the exception of Simpson’s Index, for which bootstrap and permutation tests (using the program PAST) were used to detect significant differences. Statistical tests were not used to compare site totals, however these give a useful and important measure of the biodiversity of a site as a whole, and these have been considered alongside the statistical tests [18] Due to the similar ecological niches and the low number of species of harvestmen, they have been included with the spiders in this study. The calculations generated by the BQC programme are therefore as follows.
2.3.1. Species Richness
Species richness is taken as the total number of species recorded within the sampled area [10] within a specified time period (month/year). The Jaccard Index was used as a measure of Beta diversity, to compare the similarity of the species composition between sites [9] and the table in Urbani [19] was used to obtain a p-value. As indicated by Magurran (2004) Species Richness is a frequently used index that conveys little information and equates each species as equal to each other.
2.3.2. Biomass
Estimates of biomass can be obtained from the relationship between body length and weight [20] where taxa have a determinate size [10] . For ground beetles, biomass was calculated using the formula given in Jarosik [21] . The length used for each species was the mean of the length measurements given in [14] . Biomass estimates for spiders (Araneae) were calculated using the formulas in Lang, Krooβ & Stumpf [22] , the Linyphiidae formula for the Linyphiidae and the Lycosidae formula for other spiders. Lengths of spiders was taken as the mean of male and female measurements given in Roberts [15] [16] . For harvestmen (Opiliones), the equation given in Henschel, Mahsberg & Stumpf [23] is used. Length of harvestmen was taken as the mean of male and female measurements given in Hillyard [17] . Biomass indicates the relative role of a taxon in ecosystem function.
2.3.3. Abundance
Abundance is taken as the number of individuals of a specified taxonomic group (e.g. species, family, Order etc.) recorded in samples within a specified time period (month/year).
2.3.4. Simpson’s Index
A variety of indices based on the proportional abundances of species can be used to measure diversity within a given area, such as Shannon-Wiener, Berger-Parker and Simpson’s Index, and there is little consensus on the best measure to use [9] . Simpson’s Reciprocal Index (1/D) was used in this study as it has the largest range of values [24] ,is less influenced by species richness than the Shannon-Wiener Index and has is a better discriminant than Berger-Parker [9] .
2.3.5. Species Conservation Value Index (SCVI)
An SCVI value is assigned to each species. For both ground beetles and arachnids the SCVI value relates to the occurrence of each species within 10 km2 grid squares within the island of Great Britain, which is used as a measure of rarity. Data from Luff [25] is used for ground beetles, data from Harvey, Nellist & Telfer [26] is used for spiders and data from Hillyard (2005) is used for harvestmen. Rarity values were assigned from a scale of 2 (being the most common) and 100 (being the rarest), as suggested by Feest [10] and Feest et al. [11] . Ranking for rarer species was based on the number of grid squares they had been recorded in, rather than national status (Red Data Book etc.). SCVI rankings used were as follows: 1 - 5 records—100; 6 - 15 records—50; 16 - 30 records—20; 31 - 100 records—10; 101 - 300 records—5; 301 - 500 records—4; 501 - 1000 records—3; 1000+ records—2. The SCVI results are a mean value with Standard Deviation (SD) allowing t-Tests to compare samples.
The results of the monthly trapping of invertebrates were summed for each year for each crop (n = 12) and input into the BQC programme to provide the above set of indices. This allowed for the seasonality of occurrence to be included, something which the “dipstick” one or two sample dates methods do not allow. Our results therefore are in contrast with other studies in that we used an older crop and sampled throughout the year.
3. Results
Real value data can be found in appendices 1 and 2, the following relates to these data tested for statistical significance.
3.1. Ground Beetles
Miscanthus vs. mixed-use arable
1) Barley
As shown in Table 1, the barley field had the highest ground beetle species richness, biomass, abundance, mean SCVI and Simpson’s Index in Year 1. The Mann-Whitney tests for species richness, biomass, abundance and mean SCVI were significantly higher (p < 0.01) for the barley field than the Miscanthus field, and both the permutation and bootstrap tests showed that the barley field had a significantly higher Simpson’s Index (p ≤ 0.001). Even though no specimens were collected from the barley field in September 2009, this field had higher totals for all of the biodiversity measurements than the Miscanthus field. The disparity between barley and Miscanthus is clear in Figure 1.
2) Linseed
Table 1 shows that the linseed field had the highest ground beetle species richness, biomass and abundance in Year 2. The Miscanthus field had the highest Simpson’s Index and mean SCVI. The Mann-Whitney tests for species richness, biomass and abundance were significantly higher (p < 0.001) for the linseed field than the Miscanthus field, and a Mann-Whitney test showed that the Miscanthus

Figure 1. Miscanthus and barley carabid beetle abundance for all months and year total in Year 1 (December 2008-November 2009).
field had a very high (p < 0.001) mean SCVI than the linseed field. Both the permutation and bootstrap tests showed that the Miscanthus field had a higher (p < 0.01) Simpson’s Index than the linseed field.
3) Miscanthus vs. improved grassland
As shown in Table 1, the grassland field had the highest ground beetle biomass, abundance, SCVI and Simpson’s Index in Year 1. The Mann-Whitney test for mean SCVI was significantly higher (p < 0.001) for the Miscanthus field. Both the permutation and bootstrap tests showed that the grassland field had a significantly higher Simpson’s Index (p < 0.01). The difference between the two fields was not significant for species richness, biomass and abundance.
Table 1 shows that the grassland field had the higher ground beetle biomass and abundance in Year 2, and that the two fields had a similar species richness. The Miscanthus field had the highest Simpson’s Index and SCVI. The Mann-Whitney tests showed that the grassland field had a significantly higher (p < 0.05) biomass and a higher abundance than the Miscanthus field (p < 0.01), and that the Miscanthus field had a significantly higher Simpson’s and SCVI than the grassland field (p < 0.001). Both the permutation and bootstrap tests showed that the Miscanthus field had a significantly higher Simpson’s Index than the grassland field (p < 0.01).
3.2. Arachnids
Miscanthus vs. mixed-use arable
1) Barley
As shown in Table 2 the Mann-Whitney tests for species richness, biomass and abundance were significantly higher (p < 0.001) for the barley field than the

Table 1. Summary table of results for Miscanthus versus adjacent land-uses—showing difference in ground beetles between Miscanthus crop and the contrasting adjacent land uses over two years. The crop with the highest biodiversity ind value and its significance are in bold. Simpson’s Index is for both population numbers and /biomass. Mann-Whitney test results for monthly summed data of each year (n = 12). SCVI is the Species Conservation Value Index based on regional occurrence.
M: Miscanthus; B: Barley; L: Linseed; G: Grassland. + Significant (p < 0.05 and >0.01) ++ Highly Significant (p < 0.01 and >0.001); +++ Very Highly Significant (p = 0.001 or less); = Same result for both fields; X Not significa.
Table 2. Summary table of results for Miscanthus versus adjacent land-uses – showing difference in arachnids between Miscanthus crop and the contrasting adjacent land use. The crop with the highest biodiversity index value and its significance are in bold. Mann-Whitney test results for monthly summed data of each year (n = 12). SCVI is the Species Conservation Value Index based on regional occurrence.
M: Miscanthus; B: Barley; L: Linseed; G: Grassland. + Significant (p = < 0.05 and >0.01); ++ Highly Significant (p ≤ 0.01 and >0.001); +++ Very Highly Significant (p = 0.001 or less); X Not significant.
Miscanthus field and significantly higher for mean SCVI (p < 0.01). Both the permutation and bootstrap tests showed that there was no significant difference between the Simpson’s Index of both fields.
2) Linseed
Table 2 shows the Mann-Whitney tests showed that the linseed field had a significantly higher (p < 0.001) species richness, biomass and abundance than the Miscanthus field, and that the Miscanthus field had a very highly significantly higher mean SCVI. Both the permutation and bootstrap tests showed that there was no significant difference between the Simpson’s Index of the two fields.
3) Miscanthus vs. improved grassland
As shown in Table 2, in year 1 the Mann-Whitney tests were significantly higher (p < 0.001) for the grassland field than the Miscanthus field for species richness, biomass and abundance, and significantly higher (p < 0.05) for the mean SCVI. Both the permutation and bootstrap tests showed that there was no significant difference between the Simpson’s Index of the two fields.
Table 2 shows that in Year 2 the Mann-Whitney tests showed that the grassland field had a significantly higher (p < 0.01) species richness and a significantly higher (p < 0.001) abundance than the Miscanthus field, and that the Miscanthus field had a significantly higher mean SCVI (p < 0.001). Both the permutation and bootstrap tests showed that there was no significant difference between the Simpson’s Index of the two fields.
4. Discussion
The overwhelming picture is that the crops studied all had statistically higher values for nearly all biodiversity indices compared to the Miscanthus crop as hypothesized in H1.
It is apparent from the findings of this study that the species richness, abundance and biomass of ground beetles and arachnids within an established Miscanthus plantation is poorer than that of adjacent conventional agricultural land-uses, in many cases very highly significantly so (see Figure 1), and that replacing these land-uses with Miscanthus will have a negative effect on the biodiversity quality of these organisms. In most cases Miscanthus had a positive effect on mean SCVI, but this was largely due to a decline for some reason in common species rather than an increase in rarer species. It is also apparent that adjacent land-uses can have a positive effect on the species composition, abundance and biomass of Miscanthus; however the suitability of Miscanthus for these species is lower than the habitats they originate from. The present study concerns only one Miscanthus crop and may not necessarily be representative of established Miscanthus crops elsewhere. However, the evidence presented here, and the discussion of likely causes of the findings, alongside other studies, in particular Semere and Slater [27] [28] and Christian et al. [29] suggest strongly that the findings would be similar in replicate studies elsewhere. Christian, Riche & Yates [29] found that weeds were a problem during crop establishment but in subsequent years the effect of the shading from the canopy and the litter layer suppressed weed growth and the requirement for herbicides. Small mammals were more abundant at the field edges, and bird foraging decreased as the crop grew taller [27] [30] . As weed vegetation reduces over time in Miscanthus plantations, it is likely that invertebrate biodiversity will also reduce over time. Other studies indicate that patchy establishment of Miscanthus can enhance biodiversity through allowing weed growth in the crop and increased light [30] albeit this was based on two unknown single dates sampling of fifteen sites in Ireland.
In the case of maize as a crop Lee and Albajes [31] found they could set baselines for some elements of biodiversity quality (species richness and Shannon diversity) but using only a four month period of sampling and only a few pitfall traps there were bound to be variations in the data which we have avoided here by using more traps over a longer time. Some other Miscanthus studies have contradicted this case in that they found increased biodiversity in polluted sites (Chauvat et al. [32] ; Hedde et al. [33] or reflecting landscape richness [34] . All three of these papers were of immature sites (<5 years old) and single samples of a range of sites with samples taken in the summer. They do not indicate if the sites were patchily established and are of single samplings lacking justification for the timing of the sampling or rationale for the placing of the sample points.
Christian et al. [30] found that weed vegetation in Miscanthus plantations reduces over time, as suggested by Semere and Slater [27] [30] . The lack of invertebrates feeding on Miscanthus and the reduction in weed vegetation over time are therefore likely to be the two major factors influencing the results presented here.
Current Defra advice is based on a study by Haughton et al. [35] which compared butterfly transect data from the field margins of Miscanthus to butterfly data from arable crop field margins and found the abundance of total butterflies to be greater in the field margins of Miscanthus. This study has several problems. Firstly, the data from the biomass plantations comes from a different year and a different location to that of the arable crops to which the data is compared to. Butterflies are subject to annual fluctuations, some more so than others, and several species within the families recorded are migratory and their abundance in the UK in a given year is dependent on conditions in other countries [36] . Comparative studies of butterfly data would therefore be more accurate if undertaken over the same time period to account for such fluctuations. No attempt was made to examine the in-crop biodiversity, which is arguably more important than the field margins, being of a much larger land area. This study is therefore only relevant to one order of insect, which is prone to annual fluctuations in numbers of some species, and only relates to the field margins. The biodiversity of the crop margins might represent the biodiversity of the wider agricultural matrix rather than the crop itself.
Semere and Slater [27] [30] undertook a more thorough approach to butterfly surveys than Haughton et al. [35] , undertaking transects in both the field margin and within the crop itself and identified butterflies to species level. These data were compared to reed-canary grass, another tall grass species, and not conventional agricultural crops or grassland. Butterfly abundance was lower in the crop than in the field margins (mean of 17.1 individuals, same dates). Haughton et al. [35] made reference to Semere and Slater [30] , but made no mention of their findings in relation to butterflies or any other organisms. This was the only study of butterflies in Miscanthus crops in their references. Furthermore, they stated: “Here, we have demonstrated both the generic role of ecological understanding and the specific utility of butterfly abundance as an appropriate ecological indicator.” In their study, they made no attempt at assessing the in-crop biodiversity, and used an indicator that a previous studies [28] [30] suggests is much lower in abundance within the crop itself than the field margins they did study. They used a potentially unsuitable indicator of environmental change [37] which is influenced by a variety of external factors [36] . They compared data from Miscanthus to arable data from previous year’s crops in other localities (which did not account for regional variation and annual fluctuations). The results of the present study clearly show that in almost all measurements, across two invertebrate groups, the cultivation of monocultures of Miscanthus has a negative impact on biodiversity quality when compared to typical agricultural habitats within the studied farm.
The above results showing a considerable reduction in biodiversity quality in Miscanthus may be an underestimate of the impact of Miscanthus on ground beetles since in the absence of food they are likely to continue to move and thus being more active are more likely to be caught in a pitfall trap [37] . The difference shown in mean SCVI where Miscanthus apparently had the rarer species can result from the reduction of all species such that a few are left and some of these may be rare ones resulting in the apparently higher index (in all cases the Species Richness of the alternative crop was higher than Miscanthus and therefore if these additional species were common ones the mean SCVI would decline).
The present study has potentially serious implications in terms of future policy and advice on the use of Miscanthus as a biomass crop in terms of the effect on biodiversity. The present study follows a similar methodology to Semere and Slater [28] [30] , while comparing Miscanthus to arable crops, rather than alternative biomass crops. Rather than including the wide range of organisms that they did, our study focuses on one group that they studied (ground beetles) and one that they did not (arachnids) over a longer period of time and throughout the entire year, and a more holistic assessment of biodiversity quality was undertaken. This is, therefore, the first major study since their work to assess the in-crop biodiversity of Miscanthus (and the first to study the in-crop biodiversity of an established plantation) and shows that Miscanthus biodiversity quality in general is very poor in established plantations, when compared to some adjacent conventional agricultural land-uses.
Acknowledgements
This research was funded by Ecosulis ltd and GWR Research. We thank the farmer for the use of his land, Jane Memmott at University of Bristol for the use of lab space, Richard Wall at University of Bristol for advice on project direction and Ecosulis for their continued contribution to biomass and biodiversity research.
Conflicts of Interest
The authors declare no conflicts of interest regarding the publication of this paper.
Cite this paper
Williams, M.A. and Feest, A. (2019) The Effect of Miscanthus Cultivation on the Biodiversity of Ground Beetles (Coleoptera: Carabidae), Spiders and Harvestmen (Arachnida: Araneae and Opiliones). Agricultural Sciences, 10, 903-917. https://doi.org/10.4236/as.2019.107069
References
- 1. Royal Society (2008) Sustainable Biofuels: Prospects and Challenges. Royal Society, London.
- 2. Cook, J.H., Beyea, J. and Keeler, K.H. (1991) Potential Impacts of Biomass Production in the United States on Biological Diversity. Annual Review of Energy and the Environment, 16, 401-431. https://doi.org/10.1146/annurev.eg.16.110191.002153
- 3. Eggers, J., Troltzsch, K., Falcucci, A., Maiorano, L., Verburg, P.H., Framstad, E., Louette, G., Maes, D., Nagy, S., Ozinga, W. and Delbaere, B. (2009) Is Biofuel Policy Harming Biodiversity in Europe? GCB Bioenergy, 1, 18-34.https://doi.org/10.1111/j.1757-1707.2009.01002.x
- 4. Groom, M.J., Gray, E.M. and Townsend, P.A. (2008) Biofuels and Biodiversity: Principles for Creating Better Policies for Biofuel Production. Conservation Biology, 22, 602-609. https://doi.org/10.1111/j.1523-1739.2007.00879.x
- 5. RCEP (2000) Twenty-Second Report: Energy-The Changing Climate. RCEP, London.
- 6. Defra (2007) Planting and Growing Miscanthus: Best Practice Guidelines for applicants to Defra’s Energy Crops Scheme. Defra Publications, London.
- 7. Defra (2013) Area of Crops Grown For Bioenergy in England and the UK: 2008-2011. Department for Environment, Food & Rural Affairs, England.
- 8. Gaston, K.J. and Spicer, J.I. (2004) Biodiversity: An Introduction. Blackwell Publishing, Oxford.
- 9. Magurran, A.E. (2004) Ecological Diversity and Its Measurement. 2nd Edition, Chapman & Hall, London.
- 10. Feest, A. (2006) Establishing Baseline Indices for the Quality of the Biodiversity of Restored Habitats Using a Standardized Sampling Process. Restoration Ecology, 14, 112-122. https://doi.org/10.1111/j.1526-100X.2006.00112.x
- 11. Feest, A., Aldred, T.D. and Jedamzik, K. (2010) Biodiversity Quality: A Paradigm for Biodiversity. Ecological Indicators, 10, 1077-1082.https://doi.org/10.1016/j.ecolind.2010.04.002
- 12. Saint-Germain, M., Buddle, C.M., Larrivee, M., Mercado, A., Motchula, T., Reichert, E., Sackett, T.E., Sylvain, Z. and Webb, A. (2007) Should Biomass Be Considered More Frequently as a Currency in Terrestrial Arthropod Community Analyses? Journal of Applied Ecology, 44, 330-339.https://doi.org/10.1111/j.1365-2664.2006.01269.x
- 13. Ganihar, S.R. (1997) Biomass Estimates of Terrestrial Arthropods Based on Body Length. Journal of Biosciences, 22, 219-224. https://doi.org/10.1007/BF02704734
- 14. Luff, M.L. (2007) The Carabidae (Ground Beetles) of Britain and Ireland. In: Handbooks for the Identification of British Insects, 2nd Edition, Royal Entomological Society, London.
- 15. Roberts, M.J. (1985) Atypidae to Theridiosomatidae. In: The Spiders of Great Britain and Ireland, Vol.1, Harley Books, Colchester.
- 16. Roberts, M.J. (1987) Linyphiidae and Check List. In: The Spiders of Great Britain and Ireland, Vol. 2, Harley Books, Colchester.
- 17. Hillyard, P.D. (2005) Harvestmen. Synopses of the British Fauna (New Series) No. 4. Field Studies Council, Shrewsbury.
- 18. Feest, A., Eyre, M.D. and Aldred, T.D. (2011) Measuring Carabid Beetle Biodiversity Quality: An Example of Setting Baseline Biodiversity Indices. Current Trends in Ecology, 2, 11-23.
- 19. Urbani, C.B. (1980) A Statistical Table for the Degree of Coexistence between Two Species. Oecologia, 44, 287-289. https://doi.org/10.1007/BF00545229
- 20. Rogers, L.E., Hinds, W.T. and Buschbom, R.L. (1976) A General Length vs. Weight Relationship for Insects. Annals of the Entomological Society of America, 69, 387-389. https://doi.org/10.1093/aesa/69.2.387
- 21. Jarosik, V. (1989) Mass vs Length Relationship for Carabid Beetles (Col, Carabidae). Pedobiologia, 33, 87-90.
- 22. Lang, A., Krooβ, S. and Stumpf, H. (1997) Mass-Length Relationships of Epigeal Arthropod Predators in Arable Land (Araneae, Chilopoda, Coleoptera). Pedobiologia, 41, 329-333.
- 23. Henschel, J., Mahsberg, D. and Stumpf, H. (1996) Mass-Length Relationships of Spiders and Harvestmen (Araneae and Opiliones). In: Mahnert, V., Ed., Proceedings of the XIIIth International Congress of Arachnology, Geneva, 265-268.
- 24. Duffey, E. and Feest, A. (2009) A Comparative Ecological Study of the Spider (Araneae) Faunas of East Anglian Fens, England: Regional Differences and Conservation. Bulletin of the British Arachnological Society, 14, 317-333.https://doi.org/10.13156/arac.2009.14.8.317
- 25. Luff, M.L. (1998) Provisional Atlas of the Ground Beetles (Coleoptera, Carabidae) of Britain. Biological Records Centre, Huntingdon.
- 26. Harvey, P.R., Nellist, D.R. and Telfer, M.G. (2002) Provisional Atlas of British Spiders (Arachnidae, Araneae), Volumes 1 and 2. Biological Records Centre, Huntingdon.
- 27. Semere, T. and Slater, F. (2005) The Effects of Energy Grass Plantations on Biodiversity. A Preliminary Study. Department of Trade and Industry, London.
- 28. Semere, T. and Slater, F.M. (2007) Invertebrate Populations in Miscanthus (Miscanthus × giganteus) and Reed Canary-Grass (Phalaris arundinacea) Fields. Biomass and Bioenergy, 31, 30-39. https://doi.org/10.1016/j.biombioe.2006.07.002
- 29. Christian, D.G., Riche, A.B. and Yates, N.E. (2008) Growth, Yield and Mineral Content of Miscanthus × giganteus Grown as a Biofuel for 14 Successive Harvests. Industrial Crops and Products, 28, 320-327.https://doi.org/10.1016/j.indcrop.2008.02.009
- 30. Semere, T. and Slater, F.M. (2007) Ground Flora, Small Mammal and Bird Species Diversity in Miscanthus (Miscanthus × giganteus) and Reed Canary-Grass (Phalaris arundinacea) Fields. Biomass & Bioenergy, 31, 20-29.https://doi.org/10.1016/j.biombioe.2006.07.001
- 31. Lee, M.S. and Albajes, R. (2016) Monitoring Carabid Indicators Could Reveal Environmental Impacts of Genetically Modified Maize. Agricultural and Forest Entomology, 18, 238-249. https://doi.org/10.1111/afe.12156
- 32. Chauvat, M., Perez, G., Hedde, M and Lamy, I. (2014) Establishment of Biomasss Crops on Metal Contaminated Soils Stimulates below Ground Fauna. Biomass and Bioenergy, 67, 207-211.
- 33. Hedde, M., Bureau, F., Akpa-Vinceslas, M., Aubert, M. and Decaens, T. (2007) Beech Leaf Degradation in Laboratory Experiments: Effects of Eight Detritivorous Invertebrate Species. Applied Soil Ecology, 35, 291-301.https://doi.org/10.1016/j.apsoil.2006.08.002
- 34. Bourke, D., Stanley, D., O’Rourke, E., Thompson, R., Carnus, T., Dauber, J., Emmerson, M., Whelan, P., Hecq, F., Flynn, L. and Stout, J. (2014) Response of Farmland Biodiversity to the Introduction of Bioenergy Crops: Effects off Local Factors and Surrounding Landscape Context. Bioenergy, 6, 275-289.https://doi.org/10.1111/gcbb.12089
- 35. Haughton, A.J., Bond, A.J., Lovett, A.A., Dockerty, T., Sunnenberg, G., Clark, S.J., Bohan, D.A., Sage, R.B., Mallott, M.D., Mallott, V.E., Cunningham, M.D., Riche, A.B., Shield, I.F., Finch, J.W., Turner, M.M. and Karp, A. (2009) A Novel, Integrated Approach to Assessing Social, Economic and Environmental Implications of Changing Rural Land-Use: A Case Study of Perennial Biomass Crops. Journal of Applied Ecology, 46, 315-322. https://doi.org/10.1111/j.1365-2664.2009.01623.x
- 36. Pollard, E., Hall, M. and Bibby, T.J. (1986) Monitoring the Abundance of Butterflies. Research and Survey in Nature Conservation No. 2. Nature Conservancy Council, Peterborough.
- 37. Fleishman, E. and Murphy, D.D. (2009) A Realistic Assessment of the Indicator Potential of Butterflies and Other Charismatic Taxonomic Groups. Conservation Biology, 23, 1109-1116. https://doi.org/10.1111/j.1523-1739.2009.01246.x
Appendix
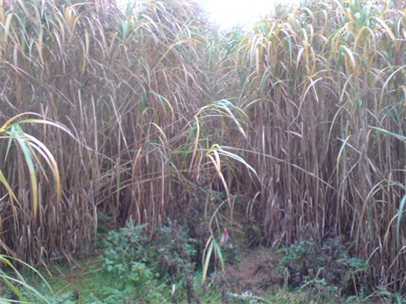
Plate A1. Fennington Farm Miscanthus (December 2008).

Plate A2. Fennington Farm Barley (July 2009).
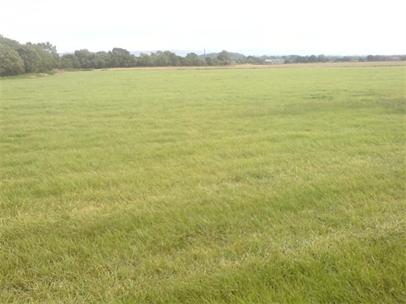
Plate A3. Fennington Farm Grassland (July 2009).