Journal of Intelligent Learning Systems and Applications
Vol.06 No.02(2014), Article ID:46164,14 pages
10.4236/jilsa.2014.62010
Simulation Model Using meta Heuristic Algorithms for achieving optimal Arrangement of storage bins in a Sawmill Yard
Asif Rahman1,2, Siril Yella1, Mark Dougherty1
1Department of Computer Engineering, Dalarna University, Borlänge, Sweden
2Department of Information Technology, Örebro University, Örebro, Sweden
Email: aus@du.se, sye@du.se, mdo@du.se
Copyright © 2014 by authors and Scientific Research Publishing Inc.
This work is licensed under the Creative Commons Attribution International License (CC BY).
http://creativecommons.org/licenses/by/4.0/


Received 13 March 2014; revised 13 April 2014; accepted 20 April 2014
ABSTRACT
Bin planning (arrangements) is a key factor in the timber industry. Improper planning of the sto- rage bins may lead to inefficient transportation of resources, which threaten the overall efficiency and thereby limit the profit margins of sawmills. To address this challenge, a simulation model has been developed. However, as numerous alternatives are available for arranging bins, simulating all possibilities will take an enormous amount of time and it is computationally infeasible. A discrete-event simulation model incorporating meta-heuristic algorithms has therefore been investigated in this study. Preliminary investigations indicate that the results achieved by GA based si- mulation model are promising and better than the other meta-heuristic algorithm. Further, a sensitivity analysis has been done on the GA based optimal arrangement which contributes to gaining insights and knowledge about the real system that ultimately leads to improved and enhanced efficiency in sawmill yards. It is expected that the results achieved in the work will support timber industries in making optimal decisions with respect to arrangement of storage bins in a sawmill yard.
Keywords:
Simulation, Genetic Algorithm, Simulated Annealing, Planning and Arrangement, Decision Making, Storage Bins, Log Stackers and Sawmill Yard

1. Introduction
One of the most important problems in integrated supply chain logistics is the optimization of resources and it is a very complex problem that deals with the planning, handling and control, for the storage of raw material between arrival and production Silva et al. [1] . The operational optimisations in industries are often concerned with maximising profits and performance while minimising costs and resources. In today’s economic conditions competitive business has made most of the industries opt for optimisation techniques in order to attain significant reductions in operational costs. Further, costs are one of the most commonly used criterions for supply chain logistics or performance of resources. The profit of a firm is directly affected by the costs of its operatio- nal resources Songsong and Lazaros [2] .
In most of the sawmill industries, efficient planning and optimization of storage bins are key factors for successful reduction in their operational costs. Bin arrangements in sawmill yard have a significant impact on utilization of resources and production supply, whereas resources are the essential equipment for transporting, loading and unloading of logs from one place to another within sawmill yard. Inefficient utilization of resources results in productivity loss by failing to serve production unit with logs in a timely fashion and unnecessary operational costs. In order to attain a significant reduction in operational costs and increase productivity, a comprehensive and systematic approach for optimization of bins has been proposed. The current work presents a case study aimed at helping Bergkvist Insjön AB attain significant reduction in their operational costs and optimize the use of resources.
Bergkvist Insjön AB1 is one of the large privately owned sawmills in Sweden with an annual production volume of around 400,000 cubic meters. A brief description of the work routine has been provided to the sake of clarity. Typical operations at the Bergkvist Insjön AB begin with the arrival of logs. Trucks loaded with timber arrive at sawmill where they are unloaded by a first log stacker. Unloaded timber is allowed to pass through a measuring station in which a human inspector checks for the quality of the timber. Further the timber passes through a 3-D scanner that will determine the type and dimension of the wood. Depending upon the type and dimensions, timber gets placed into appropriate storage bins which are ranged alongside a long transport band. All storage bins have the same capacity but bins with bigger diameter class assigned to it will be filled much faster than the others. Once the bins are almost full, a ping message is displayed on the inbuilt GPS-Timber2 screen placed in log stacker and drivers respond to that request and empty the bins and store the logs in the storage area. Based on the production requirements, timber from specific storage area or storage bins are emptied and fed to the saw mill with the aid of a second log stacker. Timber is then passed through a second 3-D scanner. The role of the second scanner is to double check that the right type and dimension of timber is being selected for production. Lack of proper control at this stage seriously compromises quality of the end product. Timber that is rejected by the second scanner is sent back to the measurement station. Such timbers are measured again to reassign a new (timber) class and appropriate storage bins as per the new class and the process continues. Upon acceptance, the logs are processed and are directed to further stages of production Asif Rahman et al. [3] [4] .
Bin arrangements usually depend on heuristics, data analysis and subjective opinions of experience personals. However, these methods are not accurate and potentially increase the risk of making inappropriate decisions which may increase utilization of resources and costs. Further, testing other options or possibilities will not be feasible in real time. To solve this problem many researchers came up with various simulation techniques as they are the promising alternative solution to these kinds of problems. Further, developing a simulation model will save both time and money by evaluating various scenarios which were not feasible to test in real time. However, use of simulation models will not guarantee optimal solution if there is an enormous search space, as “N bins can be arranged in N! ways” and computation time increases exponentially with increase in number of bins. Therefore, in order to guarantee an optimal solution in a huge search space, a simulation model incorporating different meta-heuristic algorithms for optimal arrangements of storage bins has been considered in this study. This model uses a discrete event simulation (DES) to verify the various scenarios of bin arrangements whereas algorithms such as Genetic Algorithm (GA) and Simulated Annealing (SA) can assist the simulation to search for a near optimal solution efficiently in enormous search space.
The rest of the paper is organized as follows. Section 2: Literature Review, Section 3: Discrete Event Simulation, Section 4: Case Study, Section 5: Results and Discussion, Section 6: Sensitivity Analysis and Finally Section 7: Conclusion and Future Work.
2. Review Methodology
Currently, there are many operational optimization problems in sawmill yards, which can be resolved as bin arrangements, resource allocation and space allocation for arrivals, rejections and temporary storage of sorted timber. However, the literature covered in the study was with regard to planning and optimization problems where simulations and meta-heuristic algorithms can be used in order to attain significant reductions in their operational costs.
The simulation based approaches to assess the operational routines within the domain and the impact of logistics is not a new concept. Many simulations models are increasingly being used for optimization and decision making purposes in every organization. The commercially available simulation packages have also being increased. Many newer simulation packages now offer object-oriented modelling architecture; therefore the simulation applications are more portable and scalable than before Chen et al. [5] . One of the promising methods of optimizing problems were performance can be evaluated by a simulation model is the use of GA Azadivar and Wang [6] . Shin et al. [7] proposed a simulation model incorporating genetic algorithm for optimal hoist planning in building constructions, uses simulation to test the optimal hoist plan whereas GA searches for a set of hoists that optimizes rental costs. Further, simulation models incorporating GA has also been used to optimize seating arrangements Shin & Iima [8] and improving the quality care of hospital emergency department Yeh and Lin [9] . Simulations are often developed to check the validity of the model or to evaluate its efficiency. It permits examination of the behaviour of real world system by developing simplified models of real system. It can be used to explore the behaviour of artificial systems in order to predict what might happen should such a system come into existence in the real world Goldspink [10] . Finally, simulation allows researchers to study processes in ways nature prohibits, given that it can be run many times with the values of the model parameters modified in each run and changes observed in outputs. Computer simulation can be applied for different purposes, namely prediction, performance, entertainment, training, education, confirmation and discovery Albino et al. [11] .
Genetic Algorithms (GA) are a robust adaptive optimization method based on biological principals, GA is an efficient algorithm to solve combinatorial optimization problems by exploring a large and complex search space in an adaptive way guided by the equivalent biological evolution mechanisms of reproduction, crossover and mutation Javadi et al. [12] . The most important advantage of GA is their ability to use accumulative information about the initial unknown search space in order to move the next search into useful spaces Ceylan and Ozturk [13]. In the past decade, a large number of combinatorial optimization problems and solution methods have been presented in the literature on integrated supply chain management Songsong and Lazaros [2] . Yeh and Lin [9] proposed a GA method to obtain a near optimal solution for hospital emergency department. Further, simulation has been used to evaluate how system is impacted by various nursing schedules. C. D’Souza et al. [14] proposed a Genetic Algorithm and Artificial Immune System to tackle the “Pickup and Delivery” problem effectively giving optimal solutions. By using these meta-heuristic methods the authors have optimize overall transport between different destinations leading to better utilization of time and resources. Daniels and Parsons [15] proposed the use of hybrid algorithm that combines an agent-based approach with GA global search operator to show that it is both faster and more effective than either a pure GA or a pure agent-based simulation to space arrangement problems. GA are the most studied and applied meta-heuristic in the optimization field Michalewicz and Fogel [16] because GA are very easy to implement in all sorts of problems, and usually guarantee good solutions, whatever the type of solution space Silva et al. [1] . Shin and Iima [8] proposed a GA o find the best classroom seating arrangement based on the questionnaire results and analysis of the observation of behaviour between students. According to authors, the satisfaction of students for the proposed method is higher than the traditional class room seating arrangements.
Simulated Annealing (SA) is the deterministic search approach based on the annealing process of metal. This procedure can be considered a hybrid method of local search and usually employs a downhill algorithm unless probability is decreases to 0. In this situation, uphill moves would be applied for increasing probability [17] . Simulated annealing (SA) is inspired in the physical annealing process. The randomized nature of the procedure permits asymptotic convergence to optimal solution under mild conditions [18] . Vaidyanathan and Anthony [19] studied the applicability of simulated annealing as a very effective and useful solution approach to complex problems involved in supply chain management to reduce costs and improve efficiency. Hamid and Keivan [20]
uses a simulated annealing approach for optimizing the fleet size and freight car allocation problem wherein car demands and travel times were assumed to be deterministic and unmet demands were backordered. Allaoui and Artiba [21] considered a multi-objective optimization problem taking into consideration the system constrains. Suman [22] used a Pareto dominated simulated annealing for multi-objective optimization problems where he has made extensive comparisons of multi-objective simulated annealing algorithms. Mahmoud et al. [23] presented a simulated annealing algorithm for solving multi-objective stochastic optimization problem. The algori- thm uses hill-climbing feature to escape the local minimalistic trap. A new Pareto set for multi-objective stochastic optimization is also introduced to assist the simulated annealing algorithm attain optimality. Further, si- mulation is used to estimate the objective function values.
From the above literature review, it can be notice that for most of optimization problem meta-heuristics algorithms has been used very efficiently. In this work, as we are addressing the optimal arrangement of bins, which takes a lot of time and resources, if we simulate all possible arrangements, as “n bins can be arranged in n! ways”. Therefore, an effective simulation model incorporating optimization algorithm is demanded, which will guarantee a near optimal solution in enormous search space. Based on these understandings, a simulation model incorporating a meta-heuristic algorithm has been developed. This is aimed at minimizing the total distance travelled by the resources, while, loading and unloading of storage area and storage bins. Finally, supply of logs to productions house was also considered. As resources top priority is to keep feeding sawmill with logs either from storage area or storage bins depending on the random production plan or order.
3. Discrete Event Simulation Model
In most of the timber industries planning and optimizing storage bins is a difficult task as number of bins increases computation time increases exponentially. It is due to the fact that “N number of bins can be arranged in N! ways”. A search for the optimal solution by simulating all possibilities is time consuming and tedious work. As n becomes large exhaustive search is computationally infeasible. In order to determine the optimal bin arrangement which can minimize the workload of resources and improve the overall efficiency in sawmill yard, a discrete event simulation model incorporating meta-heuristic algorithms has been developed for this study. To create a simulation model, Arena simulation software was chosen amongst potential software products available in the market, due to its nature and flexibility. The model development process has been described in the following sections.
3.1. Model Architecture
The simulation process begins with data acquisition and random arrangements of bins, which are required to plan the optimal bin arrangement in sawmill yard. The information regarding each bin has been included, such as, the capacity of each bin, the distance between each bin and its storage area, distance between each bin and sawmill and finally the distance between storage area and sawmill and vice versa. As all bins, storage areas and sawmill are interconnected, the log stacker can move to any place from anywhere in the simulation to process a request. However, the information regarding how many resources will be used was also included. Based on the given information, the simulation arranges the initial bin positions based on the random population and starts the simulation. For each population simulation calculates the distance travelled by the log stacker (resources), how many logs were supplied to sawmill and how many logs ended up in free bins or dynamic bins and how much time taken by log stacker to fulfil all the requests. Further, the data will be transferred to optimization algorithms to select fittest solutions and generate a new population based on those fittest solutions. The simulation starts again with new population and the process continuous until end of the generations or stopping condition satisfies. Finally, over the number of generations, the population evolves towards a solution close to optimal.
3.2. Model Development
As mentioned earlier, the simulation model used in the research work represents a sawmill yard where efficient handling of resources have been examined based on the optimal arrangements of bins. The simulation models will optimize the overall distance travelled by the resources and also fulfils other constraints, such as, emptying bins and supplying logs to sawmill. The key responsibilities of resources includes different kinds of tasks, such as, unloading storage bins and store the logs in storage area, fill the sawmill buffer and choose the optimal distance between bins while transporting timber logs between different tasks. However, including the responsibilities few assumptions were also made in simulation model, which are as follows.
・ The arrivals of timber logs per minute are uniform and followed the current pattern in sawmill. All the arrival logs are measured and transported to storage bins via conveyor belts.
・ The time spent processing each log is same whereas time spent to transport each log to its storage bin is different and it is based on its distance from measuring station to their respective bins.
・ The capacity of storage bins have been predefined based on dimension (diameter and length) of each log class.
・ There is only one resource, which will do all the work. The bin which request first will be served first.
・ The starting point of Log stacker is near the saw mill.
・ All the logs will be stored in their respective storage bins and storage area.
・ The logs supply requests from sawmill has not been considered in this study, as we are interested in arrange- ment of bins to minimize the utilization of log stackers. Even then we supply some random logs to sawmill to utilize log stacker more effectively.
Based on the above information and assumptions the simulation model was built.
3.3. Simulation Model and Meta-Heuristic Algorithms
The Discrete Event Simulation model incorporating meta-heuristic algorithms (GA and SA) has been developed using a simulation software Arena. It was chosen due to its graphical interface and flexibility with other programming languages. Further, the simulation model has been divided into two parts, actual simulation and meta-heuristic algorithms (Figure 1). The DES was developed using the software and algorithms were developed in Visual Basic language, which can easily exchange values within simulation software whenever it is required and therefore exhibits full functionality of the software.
3.3.1. Data Acquisition
The raw data (log arrival data) has been acquired from Bergkvist Insjön AB and stored in the database. The main objective here is to run the simulation on real data sets. Further, the data has been divided in different sets based on different moths, so as to know the arrival pattern will be same or changes according to the seasons. To test the simulation, the one month data at a time has been selected due to huge size of the data and further the data has been shuffled randomly to test the sensitivity of the model.
3.3.2. Sawmill Yard
There are several objects or entities in this simulation model, measuring station, storage bins, storage area, log stackers and sawmill. Further, the storage bins and storage area has been divided into several more entities, as each bin and its storage unit represents one entity. Since, there are 83 storage bins and corresponding storage area in front of those bins (brown colour boxes in Figure 2), where all the sorted logs will be stored. However, there are only 59 active log classes which are processed in sawmill and requires only 59 storage bins out of 83. The remaining 24 bins are used for other purposes logs and those bins are represented by blue and green colour and those bins are fixed and do not change their positions in simulation model. The green colours bins are dynamic bins, which will be used, if corresponding bins beside it or before it are completely full. The blue colours bins are used for low quality logs which are not processed in the sawmill production unit and that’s the reason they are far away from the saw mill. However, the last two blue bins near the sawmill production unit are also dynamic bins and free bins and will be used by any of the log class if their respective classes are full or if they didn’t find their respective class or bin.
3.3.3. Log Stacker
The log stackers are one of the most important resources of this simulation study. The role of log stackers is to empty the storage bins and stores the logs in storage area or feed the logs to sawmill for production. The time and distance travel by log stacker between sawmill and storage bins, storage bins and storage area, storage area and sawmill, and storage area to storage bins varies according to its position, distance and speed. As all the routes are interconnected and log stacker chooses the minimum distance while travelling. If it travels at a constant speed of 2 meters/second, it costs around 180 ?per/hour.
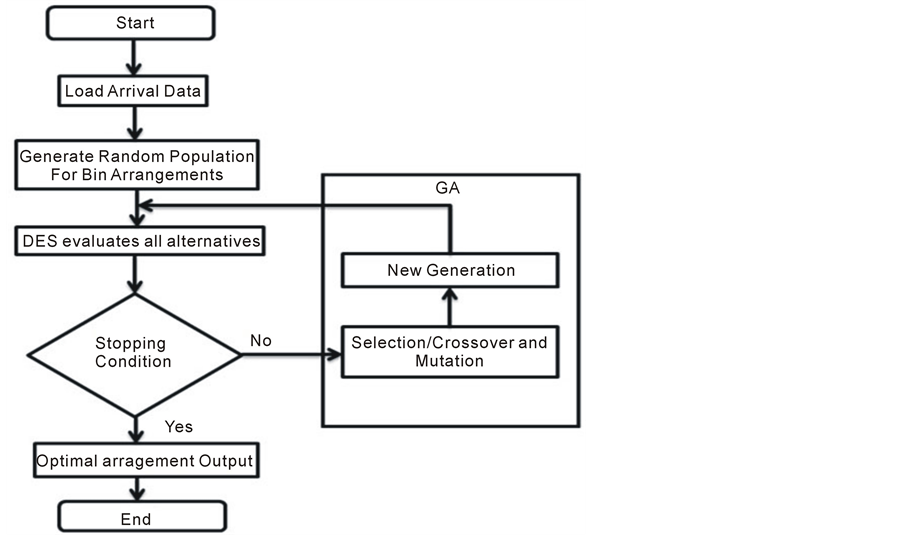
Figure 1. Proposed simulation model (GA).
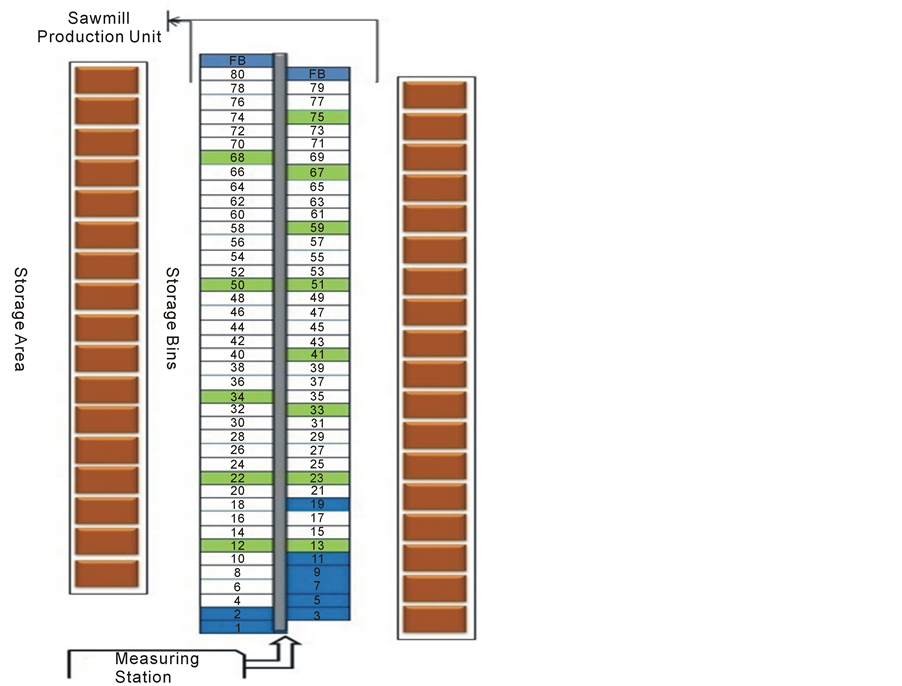
Figure 2. Simulation model of bin arrangement.
3.3.4. Events
In this simulation study, there are 5 events, such as, arrival, loading the bins, unloading the bins, dumping logs in storage area and supplying logs to sawmill for production. First, when logs arrive at the measuring station, an activity is started. The event “log arrival” occurs with regular time intervals and amounts the arrival per minute. Second, “loading event” occurs when the logs passes through measuring station. Third, “unloading bins” occurs when bins are almost full and request a log stacker. Fourth, log stacker responds to the request and serves each bin based on first come first serve basis. Finally, the unloading logs will be either stored in storage area or supplied to sawmill and this will results the final event. Further, this process continues as continuous request comes in from all the bins throughout simulation.
3.3.5. Relationship between Events
The most important activity in this study the behaviour of resources; total distance travelled by log stacker is calculated as the sum of distance travel between sawmill and storage bins and storage bins and storage area and storage area to other storage bins. Further, the total time the log stacker was busy was calculated as the percentage of total time taken by the simulation model and total time taken by log stacker to travel the distance including the emptying and dumping time. Finally, the dynamic bins were evaluated to find out which combination gives less number of logs in dynamic bin.
3.4. Model Validation
Before applying the simulation model, it must be validated to determine whether the constructed model is an accurate representation of the system under research Kelton et al. [24] . If the model is valid, the conclusions drawn from it should be similar to those that could be obtained from physical experiment with the real system. Consequently, when the results from the simulation model are accepted as valid and are used to make decisions, the model can be said to be credible Shin et al. [7] . The validation of the model proposed in this study was performed by comparing the results of existing model with previous simulation study and historical results Asif Rahman et al. [3] and [4] . Further, few test cases were also implemented to tested the credibility of the simulation model. However, a summary of validation results can be seen in sections 6 and 7.
The log stackers travel at the speed of 120 meters/minute and they can only unload a limited number of logs from each bin based on the dimensions of each class. An absolute max value it can unload is the max capacity of each bin. The production plan or sawmill requests has not been included in this study. If we optimize the use of resources based on the current simulation based optimization approach then remaining time of resources can be better utilized by sawmill for production requests.
Further, test results suggested that, the current arrangement used in sawmill takes more time and more distance as compared to the optimal arrangement derived from meta-heuristic algorithms. However, as mentioned earlier, the aim here is to optimise the usage of the log stacker as minimum as possible while satisfying the all constraints of sawmill yard. In this validation, same conditions were applied in the simulation model for both approaches current and optimised one. Based on the actual observations, few values were used, as measuring station aim to process 1000 logs per hour and similarly sawmill process time varies with respect to class, as small (diameter) classes take less and big (diameter) classes take more time. However, the average processing time in sawmill is around 22 logs per minute for all classes and it will process around 1300 logs per hour. Simulation operations were performed on both the approaches and results of log stackers were used for validation.
3.5. Optimization-Meta-heuristic Algorithms
Before one would say that GA is better or worse than SA, let us make a comparison of these algorithms. We will see that these algorithms are very similar in some way to each other. Further, we cannot guarantee that it’s going to find a good solution or not. So, we have to be very careful while choosing the right parameters before testing the algorithms. The current problem in sawmill yard where search space of optimal solution grows exponentially as the size of the problem increases, which makes an exhaustive search for optimal solution infeasible. To search for an optimal solution, Genetic Algorithm and Simulated Annealing have been considered in this study. The aim here is to compare different algorithms because these algorithms can search for near optimal solutions in huge solution space.
3.5.1. Initial Representation
GA operates on a random population of individuals and each individual represents a bin (Figure 3). The length of population represents total number of bins and number in each gene represents the position of the bin, there are few bins which are fixed which cannot be changed/swapped with other numbers (Green and Blue colour bin in Figure 2). Similarly, Simulated Annealing also operates on the initial population of random individuals and initializes the time, maximum size and acceptable limit. It is very similar to creating individuals in GA.
3.5.2. Initial Population
Both the algorithm usually starts with the predefined random population, however, in this study, the random population for only the 59 bin positions where assumed and reaming positions 24 were kept in their respective positions as they can’t be changed. The length and size of the population was 80 for our model excluding the free bins; however, we can test the simulation with different sizes. The bigger the population the more time it takes and also increases the chances of obtaining optimal solution.
3.5.3. Fitness Function and Evaluation
The function which is used to evaluate each population has to returns the distance travelled by the log stacker, number of logs supplied to saw mill and overall busy time for log stacker. After the initial population is generated, the fitness of each solution is evaluated by using simulation model. Fitness values of each population will be obtained and using the best fitness values of half of the population is selected (i.e. 40 sample population). From these selected populations, new population will be created based on roulette wheel selection process and cyclic crossover in GA. The cycle crossover operator identifies a number of so-called cycles between two parent chromosomes. Then, to form a child 1, cycle one is copied from parent 1, cycle 2 from parent 2, cycle 3 from parent 1, and so on. For SA algorithm, the fitness function evaluation is the same as in GA. The program keeps track of the best fitness value found so far and if solution is better or equal than before then it will be the current generation. And it will continue until annealing limit reaches to 0. Since, decreasing annealing limit increases generations.
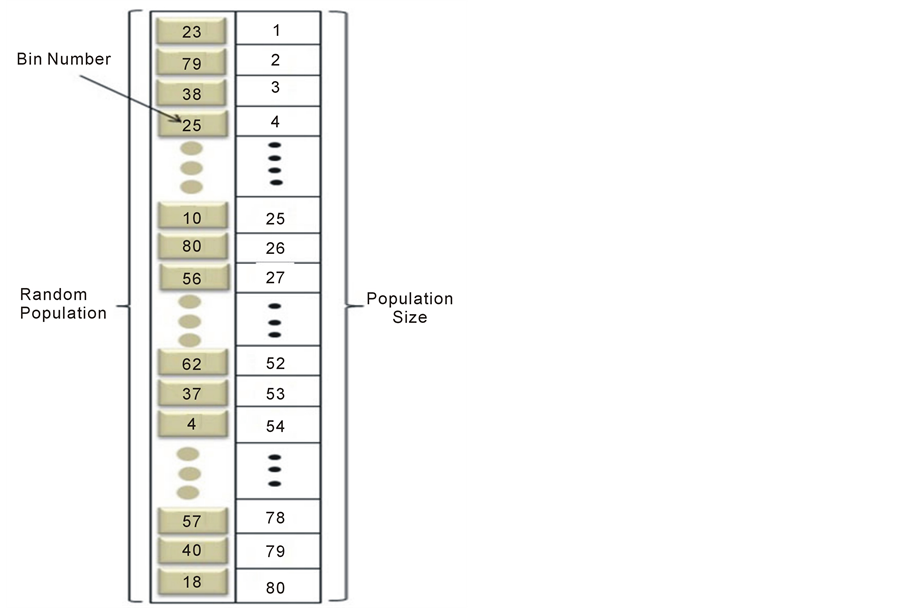
Figure 3. Initial representation.
3.5.4. New Generation
After evaluating all the population using simulation model, the fittest half of initial population will be selected and undergo evolution cycle, which may include selection, crossover and mutation. Selection was performed by selecting any two random populations from the population pool. In this study, the roulette wheel selection process based on the ranking algorithm was applied for selection.
The population of next generation was generated by applying the cyclic crossover operator to the random population obtained from the selection process. The crossover operator selects two parent solutions randomly and does the cyclic crossover where fixed genes occupy same set of position in new child population as they were in parent population, whereas other genes forms a cycle and swap their positions. This crossover will make the fixed bins remain in their respective positions whereas other bins change accordingly based on number of cycles. The positions were swapped for odd cycles and even cycles positions were kept as it is. However, this operator creates two new populations and it will replace original parents in population sample, and this process continuous until all new generation has been created. Further, simulation continues with new generation until end of the generations or stopping condition satisfies. Over the number of generations, genetic operators continuously improve the fitness of population, and consequently, the population evolves towards a solution close to optimal.
3.5.5. Stopping Condition
The simulation model has to stop at one point, either it should satisfy the stopping criteria or maximum generations have to be reached. Further, if there isn’t any improvement in new generations then we can stop the simulation. In this study, based on the first criterion, the stopping condition is set as when the number of generations reaches 50, or when there is no improvement in the optimal solution over 20 generations the simulation stops.
4. Sawmill Yard Operations
4.1. Bergkvist Insjön AB?A Case study
The current simulation model was applied to a sawmill industry, Bergkvist Insjön AB. The aim of this study was to verify that current bin arrangements in sawmill yard is optimal or not. Further, to identify which combination of bins gives you optimal results and how utilization of resources can be minimized. A brief description of the operational routines in sawmill yard has been mentioned earlier.
In this study, the investigation has been done on the behaviour of log stackers based on the different arrangements of bins. The objective is to identify the optimal arrangement, which reduces the workload of resources and increases the overall efficiency in sawmill yard. The log stacker’s responsibilities include unloading storage bins, storing logs in storage area and feeding log to sawmill. However, the sawmill production unit has the top priority and log stackers are obliged to follow the priority and feed the production unit with logs. Because feeding the sawmill is top priority, the log stackers sometimes fail to unload bins on time, which stops the measuring process and leads to inefficiency in measuring station. Similarly, by fulfilling the request of all the bins, log stackers are occasionally unable to meet the requirement of sawmill and this also results in inefficiency in sawmill production. To overcome this problem, a simulation model incorporating genetic algorithm and simulated annealing has been investigated to identify the bottlenecks in the sawmill yard and proposes a storage bins arrangement which optimizes the usage of resources and increases the overall efficiency in sawmill yard.
4.2. Application of theproposed Model
In the sawmill yard, we have two log stacker, one log stacker is responsible for unloading logs from trucks and feeding the logs to measuring station. The second log stacker is responsible for feeding sawmill and unloading storage bins. Further, the responsibilities of log stackers can change and even they can share the responsibilities. However, results from previous simulation study on working routines suggested that resources having individual responsibilities give better results compared to sharing responsibilities Asif Rahman et al. [3] . Keeping the earlier results in mind, we have tested this simulation study with one log stacker.
4.3. Properties of Simulation Model
For simulation operations, some conditions such as, arrival of logs, bin capacity and log stacker grapple size were assumed according to current constraints in sawmill yard. Further, the time taken for processing and distance and speed were also set based on the perfect conditions in sawmill yard. These conditions and properties must be set carefully because they affect the simulation result.
In particular, the arrival of logs in this case study was defined in accordance with real time situations without any breakdowns in the measuring station. The proposed method results in shortest distance travel by the log stacker while performing his responsibilities of unloading and storing logs and even supplying logs to sawmill at random. Therefore, this approach is reasonable for optimal bin arrangements in sawmill yard.
5. Results and Discussion
To verify the results, the algorithms and currently used arrangement results were compared. The results for all the cases are summarized in table 1 and table 2. The total distance travelled by log stacker for currently used storage bin arrangement was higher, as compared to meta-heuristic algorithms. Further, the performance of GA was much better compared SA The results for finding the optimal storage bin arrangement in sawmill yard that increases efficiency has been shown in (figure 4), where, the distance travel by log stacker decrease as generations increases and at certain point there were no improvements and we stopped the simulation model.
The Meta-heuristic algorithms based optimal arrangement was tested with different data sets with respect to months and combination of few months. The results suggested that the GA based arrangement was better compared to other algorithm and currently used bin arrangements in the sawmill yard.
Run Time: Time taken by each algorithm will be same, since, number of arriving logs is constant. Further, meta-heuristic algorithms show that time complexity increases exponentially with increase in number of logs in
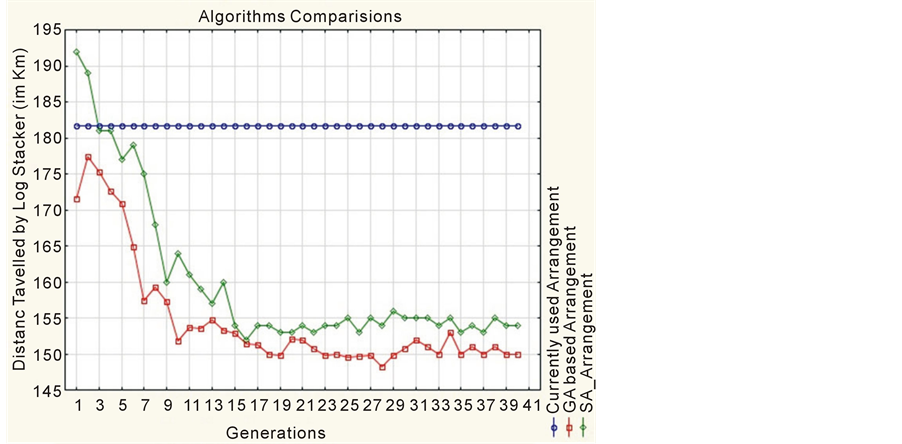
Figure 4. Results of one week data (i.e. 43,000 logs).

Table 1. Results of simulation model.
Table 2. Distance travelled by log stacker (Km).
data sets.
Solution Quality: The set of parameters and their values are very crucial in determining the solution quality. The GA based optimal bin arrangement produces good results compared to other algorithms. SA produces near optimal results with moderately high temperature and cooling rate very close to 1. To some extent, all meta- heuristic algorithms are very good solvers and can provide optimal solutions if the right set of parameters are selected. Further, it should not affect the number of iterations and quality of solution. From the algorithm based optimal arrangement the average distance travel by log stacker was significantly less compared to actual arrangement used in sawmill for all the data sets. Further, if we convert distance into cost, the differences were significantly more for one month data and increases greatly for the total of one year or even more. The proposed model provided an optimal alternative that satisfied cost and time constraint simultaneously. These results revel that the DES model using optimization algorithm is reasonable and appropriate solution for finding optimal arrangement of storage bins in a sawmill yard. Further, it saves lot of time in assessing different scenarios, which can be used as alternatives solutions.
6. Sensitivity Analysis (Genetic Algorithm)
Simulation model consists of many different components that analyst cannot estimate in perfect precision and results are always subjective to some level of uncertainty. So, sensitivity analysis of system dynamics models should be conducted in order to reach more reliable conclusion.
The input data i.e. arrival pattern has been randomly distributed and tested several times with each arrangement current, GA and SA and outputs were calculated (see Table 2). Further, overall mean has been calculated with respect to two types of data sets, one month data samples and three months data samples covering the whole one year data. figure 5 and figure 6 suggested that there is significant difference between two arrangements with respect to distance travel by log stackers. Further, the distance increases even more as the data size increases.
The average difference between two storage bin arrangements is around 114 km for one month data and 222 km for three months data. As the input sample size increases the distance travel by log stacker also increases. Further, if we analyse the impact of addition distance travelled by log stacker based on the current bin arrangements is around 70,000 ?additional cost every year.
The log stackers travel at a speed of 2 m/sec and costs around 180 ?hour. The average distance we saved using GA based optimal arrangement is around 114 km/month. If we convert it to hours it will be around 16 hours per month. The cost for 16 hours is around 3000 ?and it is only for one month and one log stacker. Similarly, if use two or three log stackers then the addition cost per year will be more than 70,000 ?plus the additional cost for drives and more wear and tear for the log stackers which will result in nearly 100,000 ?additional costs. However, the third log stacker will be used in emergency situations, like log arrivals in a train or inundated flow of trucks carrying logs. With this GA based optimal arrangement we can save minimum of 100,000 ?every year plus increases the usability and life span of log stackers and improves the overall efficiency in sawmill yard.
ANOVA Analysis
ANOVA uses the F test to determine whether there exists a significant difference among means or not by rejecting or accepting null hypothesis. If the null hypothesis (i.e. no difference among means for both the arrangements current and GA based) is accepted, there is an implication that no relation exists between the random arrival patterns and the distance travel by log stackers. When the F test rejects the null hypothesis, thorough analysis then, there exists a significant difference between two arrangements.
The GA based optimal arrangement of bins gives effective results as compared to the current arrangement in the sawmill yard. So, to test the sensitivity of the simulation model statistical sensitivity method has been used in order to determine the association between different inputs and outputs and how variance of both solutions behaves. The input data has been randomly distributed and tested several times and each time output were calculated. Further, the one-way analysis of variance (ANOVA) is used to determine whether there are any significant differences between the means of two solutions. It is important to realise that the one-way ANOVA is an omnibus test statistic and cannot tell you which specific groups were significantly different from each other; it only tells you that at least two groups were different Laerd Statistics [25] .
Data transformations are commonly-used tools that can serve many functions in quantitative analysis of data, including improving normality of a distribution and equalizing variance to meet assumptions and improve effect sizes, thus constituting important aspects of data cleaning and preparing for your statistical analyses Osborne [26] . Before applying ANOVA analysis it was important to normalise the data. So, we have used Boxcox Trans- formation to normalized data. The descriptive tables (Table 3 and Table 4) provides some very useful statistics regarding mean, standard deviation and 95% confidence intervals for the dependent variable (distance), for each separate group (Current_ Arrangement and GA based Optimal Arrangement), as well as when all groups are combined (Total). Further, from the results of ANOVA analysis we can see that the significance level is 0.027 (p = 0.027), which is below 0.05 and, therefore, there is a statistically significant difference between the two group
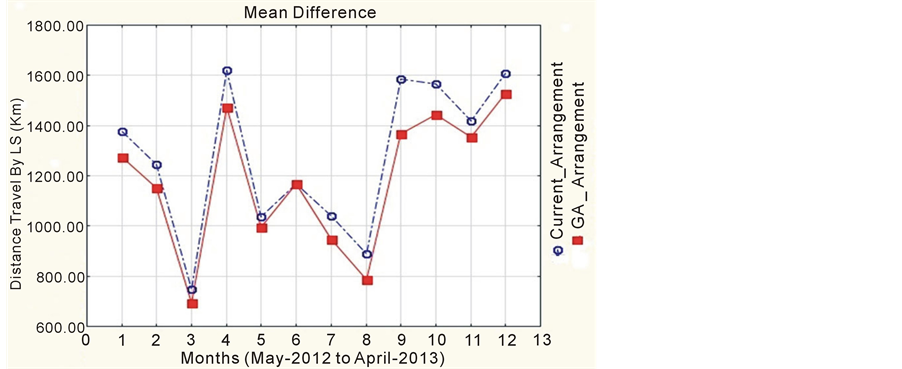
Figure 5. Mean difference between arrangements (one month data sample).
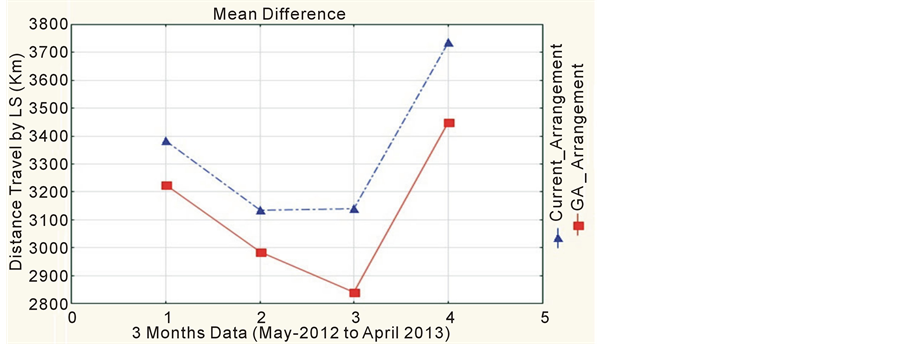
Figure 6. Mean difference between arrangements (3 months data sample).
Table 3. ANOVA analysis results.
Table 4. Least squares means.
of means i.e. current and GA based arrangements and we can reject the null hypothesis.
7. Conclusion and Future work
Solving combinatorial optimization problems are really hard, and there is no good algorithm known for this kind of problem. That is the reason, why Genetic Algorithm or Simulated Annealing can be used very well to solve these problems. It can be seen that the problem and its basics hugely related to problems from the real word. Nowadays, when the resources are expensive and optimization is very important, these methods might be a very good choice. It is cannot be said that Genetic Algorithm or Simulated Annealing is better. It can be said that both of them are effective algorithms, when carefully selected. It is worth thinking both of these algorithms, when we face these problems.
The proposed simulation model using GA and SA for optimal arrangement of storage bins in a sawmill yard has been investigated. To verify its applicability and the effect of proposed model, it was tested with the real data sets and compared with actual arrangements in sawmill yard. In the experiment, the results of both meta- heuristic algorithms based optimization model and currently used model in sawmill yard were compared. The proposed model i.e. GA showed more optimal results and also greatly reduced the cost while satisfying the constraints and proved to be a better approach to planning and optimizing bin arrangements in a sawmill yard. The simpler structure of SA does not search a big part of the solution space compared to GA. GA mainly uses mutation and crossover to jump to another part of solution space and to create a new solution from previously known best results. While GA operates with these two effective methods, SA only replaces some of its elements by the defined neighbourhood function. So, there is a difference between final optimal solutions. However, both the al- gorithms provide promising results compared to current arrangement in sawmill. However, further studies are necessary before it can be actually implemented in the sawmill yard. Additional experiments are necessary to determine the best positions for dynamic bins in order to maximize its utilization. The extension of simulation model form arrival to processing will help analyse appropriate time to implement the additional log stackers and even log stacker can be assigned additional responsibilities when they are free.
Acknowledgements
The authors would like to thank the anonymous reviewers for their valuable comments that will greatly help us to improve the contents of this paper.
References
- Silva, C.A., Sousa, J.M. and Runkler, T.A. (2008) Rescheduling and Optimization of Logistics Process Using GA and ACO. Journal of Engineering Application of Artificial Intelligence, 21, 343-352. http://dx.doi.org/10.1016/j.engappai.2007.08.006
- Liu, S.S. and Papageorgiou, L.G. (2013) Multi-Objective Optimization of Production, Distribution and Capacity Planning of Global Supply Chain in the Process Industry. Journal of Omega, 41, 369-382. http://dx.doi.org/10.1016/j.omega.2012.03.007
- Asif, R., Vald, S., Pascal, R. and Siril, Y. (2012) Multi-Agent Simulation of Sawmill Yard Operations. IASTED Proceedings of Simulation and Modelling, Napoli.
- Asif, R., Siril, Y. and Mark, D. (2011) Image Processing Technique to Count the Number of Timber Logs in a Truck. IASTED Proceedings of Signal and Image Processing, Dallas.
- Chen, E.J., Lee, Y.M. and Selikson, P.L. (2002) A Simulation Study on Logistic Activities in a Chemical Plant. Journal of Simulation Modelling Practice and Theory, 10, 235-245. http://dx.doi.org/10.1016/S1569-190X(02)00102-8
- Azadivar, F. and Wang, J. (2000) Facility Layout Optimization Using Simulation and Genetic Algorithm. International Journal of Production Research, 38, 4369-4383. http://dx.doi.org/10.1080/00207540050205154
- Shin, Y., Cho, H. and Kang, K. (2011) Simulation Model Incorporating Genetic Algorithm for Optimal Temporary Hoist Planning in High-Rise Building Construction. Journal of Automation in Construction, 20, 550-558. http://dx.doi.org/10.1016/j.autcon.2010.11.021
- Shin-ike, K. and Iima, H. (2011) A Method for Determining Classroom Seating Arrangements by Using Genetic Algorithm. SICE Annual Conference, Tokyo.
- Yeh, J.Y. and Lin, W.S. (2006) Using Simulation Techniques and Genetic Algorithm to Improve the Quality Care of a Hospital Emergency Department. Journal of Expert System with Applications, 32, 1073-1083. http://dx.doi.org/10.1016/j.eswa.2006.02.017
- Goldspink, C. (2002) Methodological Implications of Complex Systems Approach to Sociality: Simulation as a Foundation for Knowledge. Journal of Artificial Societies and Social Simulation, 5, 1-19.
- Albino, V., Carbonara, N. and Gainnoccaro, I. (2007) Supply Chain Cooperation in Industrial Districts: A Simulation Ana- lysis. European Journal of Operation Research, 117, 261-280. http://dx.doi.org/10.1016/j.ejor.2005.12.007
- Javadi, A.A., Farmani, R. and Tan, T.P. (2005) A Hybrid Intelligent Genetic Algorithm. Journal of Advance Engineer- ing Informatics, 19, 255-262. http://dx.doi.org/10.1016/j.aei.2005.07.003
- Ceylan, H. and Ozturk, H.K. (2004) Estimating Energy Demand of Turkey Based on Economic Indicators Using Gene- tic Algorithm Approach. Journal of Energy Conversion and Management, 45, 2525-2537. http://dx.doi.org/10.1016/j.enconman.2003.11.010
- D’souza, C., Omkar, S.N. and Senthilnatj, J. (2012) Pickup and Delivery Problem Using Meta-Heuristic Techniques. Journal of Expert System with Applications, 39, 328-334. http://dx.doi.org/10.1016/j.eswa.2011.07.022
- Daniels, A.S. and Parson, M.G. (2007) Development of Hybrid Agent Genetic Algorithm Approach to General Arran- gements. Proceedings of Computer Applications and Information Technology in the Maritime Industries.
- Michalewicz, Z. and Fogel, D.B. (2003) How to Solve It: Modern Heuristics. Springer, Berlin.
- Xin, Z., Hongnian, Y. and Anthony, A. (2008) An Overview of Simulation in Supply Chains. Advanced Design and Ma- nufacture to Gain a Competitive Edge, Book Chapter 3. 407-416.
- Reeves, C. (1990) Modern Heuristic Techniques for Combinatorial Problems. John Wiley & Sons, Chichester, England.
- Vaidyanathan, J. and Anthony, R. (2003) A Simulated Annealing Methodology to Distribution Network Design and Management. European Journal of Operation Research, 144, 629-645. http://dx.doi.org/10.1016/S0377-2217(02)00153-4
- Hamid, R.S. and Keivan, G. (2009) A Simulated Annealing Approach for Multi-Periodic Rail-Car Fleet Sizing Problem. Journal of Computers & Operation Research, 36, 1789-1799. http://dx.doi.org/10.1016/j.cor.2008.05.004
- Allaoui, H. and Artiba, A. (2004) Integrating Simulation and Optimization to Schedule a Hybrid Flow Shop with Main- tenance Constraints. Computers & Industrial Engineering, 47, 431-450. http://dx.doi.org/10.1016/j.cie.2004.09.002
- Suman, B. (2004) Study of Simulated Annealing Based Algorithms for Multiobjective Optimization of a Constrained Problem. Computers and Chemical Engineering, 28, 1849-1871. http://dx.doi.org/10.1016/j.compchemeng.2004.02.037
- Mahmoud, A., Ali, D., Ameen, A., Raid, A. and Nishat, F.M. (2013) Simulated Annealing for Multi Objective Stocha- stic Optimization. International Journal of Science and Applied Information Technology, 2, 18-21.
- Kelton, W.D., Sadowski and Swets, N. (2009) Simulation with Arena. 5th Edition, McGraw Hill, New York.
- Laerd Statistics (2013) One way ANOVA Analysis. https://statistics.laerd.com/statistical-guides/one-way-anova-statistical-guide.php
- Osborne, J. (2010) Improving Your Data Transformations: Applying the Box-Cox Transformation. Practical Assessment, Research & Evaluation, 15, 2010.
NOTES

1http://www.bergkvist-insjon.se/
2http://www.gpstimber.se