Journal of Water Resource and Protection
Vol.07 No.06(2015), Article ID:55601,19 pages
10.4236/jwarp.2015.76040
Chemical Evolution of the Continental Terminal Shallow Aquifer in the South of Coastal Sedimentary Basin of Benin (West-Africa) Using Multivariate Factor Analysis
Abdoukarim Alassane1*, Rim Trabelsi2, Léonce F. Dovonon3, Diane J. Odeloui1, Moussa Boukari1, Kamel Zouari2, Daouda Mama1
1Laboratoire d’Hydrologie Appliquée, Faculté des Sciences et Techniques, Université d’Abomey-Calavi, Abomey-Calavi, Bénin
2Laboratoire de Radio-Analyse et Environnement, Ecole Nationale d’Ingénieurs de Sfax, Université de Sfax, Sfax, Tunisie
3Laboratoire d’Etude et de Recherche en Chimie Appliquée, Ecole Polytechnique d’Abomey-Calavi, Université d'Abomey-Calavi, Abomey-Calavi, Bénin
Email: aalassane@yahoo.fr, abdoukarim.alassane@uac.fast.bj, *aalassane@yahoo.fr
Copyright © 2015 by authors and Scientific Research Publishing Inc.
This work is licensed under the Creative Commons Attribution International License (CC BY).
http://creativecommons.org/licenses/by/4.0/


Received 3 March 2015; accepted 9 April 2015; published 14 April 2015
ABSTRACT
In southern Benin, where population is growing and water demand for domestic activities is increasing, water balance assessment constitutes a serious concern about sustainability of water resources. Major ions have been employed with statistical methods to identify geochemical processes controlling groundwater quality. Multivariate statistical analysis (principal component analysis “PCA” and hierarchical cluster analysis “HCA”) revealed the main sources of groundwater mineralization. According to the hydrochemical data and the methods of treatment, groundwater mineralization in the investigated aquifer is caused by four main processes: 1) mixing with Nokoué lake and Porto-Novo lagoon salt water causing salinity to increase in the southern part of the aquifer; 2) anthropogenic activities; 3) cation exchange process; and 4) soil CO2 diffusion providing a large proportion of bicarbonates.
Keywords:
Hydrogeochemical Process, Pollution, Shallow Groundwater, Continental Terminal, Benin

1. Introduction
The Continental Terminal is the Mio-Pliocene formations made with sand, clay, clayed-sand, sandy-clay and gravels in the south of coastal sedimentary basin of Benin, Togo and southwestern Nigeria. The shallow aquifer of these formations constitutes the main water resource in that region most urbanized and where the densities of population, in Benin part, reach 5000 to 7000 inhabitants/km2 [1] . That region is affected by environmental modification due to land use and land cover changes [2] while the growth of population and economic continues with an increase of groundwater demand. Moreover, this aquifer is located in marginal-littoral zone with ocean, lake and lagoon salt waters, as several coastal groundwaters in West-Africa. Consequently, to improve water resource management in these regions, it is important to understand the main process that controls groundwater mineralization. Groundwater quality could be influenced by many factors including climate, aquifer lithology, surface water recharge, seawater intrusion [3] [4] , waste water pollution, etc. Geochemical signatures of ground water combined with statistical methods could be used to identify the chemical processes that control hydrogeochemistry [5] -[8] . Therefore, geochemical and hydrochemical investigations of groundwater resources are important to observe the suitability of water for a particular use.
Several studies have investigated the Continental Terminal aquifer in Benin part to define its structure [9] - [12] , to estimate the hydrodynamic parameters and model the flow paths [10] [13] [14] , to evaluate the vulnerability of pollution [15] [16] and to evaluate the impact of human activities on the quality of the aquifer [17] - [22] .
The aim of this work is to use statistical analysis methods, particularly principal components analysis (PCA) and hierarchical cluster analysis (HCA) in treatment of geochemical data.
The PCA is a mathematical technique that is successfully applied to investigate problems in geological investigation, such as geochemistry [23] and environmental science [24] . This statistical method has several advantages over classical graphical approaches as it takes into consideration a huge amount of spatial and temporal data of water quality. The PCA is widely used as it is an unbiased method which can indicate associations between samples and/or variables [25] . This method is employed to reduce the dimensionality of the data set by explaining the correlation among a large set of variables in terms of a small number of underlying factors, or principal components, without losing much information [26] -[28] and allows assessment of associations between variables, since they indicate participation of individual chemical species.
The HCA indicates groupings of samples by linking inter-sample similarities and illustrates the overall similarity of variables within the data set [29] .
In this study, we use hydrochemical information to identify the natural and artificial processes that control groundwater mineralization in the Continental Terminal formations of coastal sedimentary basin of Benin. The integration of hydrological, geochemical data with statistical methods is used for delineating hydrochemical processes, identifying the consequences of the water-rock interaction and the mixing with surface water (lake, lagoon and Atlantic seawater).
2. Study Area
The coastal sedimentary basin is located in the southern of Benin and extends over the entire width of the territory from the borders of Togo in the west to Nigeria in the east. It is limited in the north by the Precambrian basement composed of magmatic and metamorphic rocks and in the south by the Atlantic Ocean (Figure 1).
The coastal sedimentary basin, whose surface is about 12,000 km2, occupies 10% of Beninese territory, but contains about 35% of groundwater resources of the country [30] with 65% of the national population evaluated at 6,752,569 inhabitants in 2002 [1] .
The studied basin is in a subequatorial zone characterized by warm and wet climate with two rainy seasons (from mid-March to mid-August and from mid-September to November) and two dry seasons (from mid-August to mid-September and from December to mid-March). Average annual rainfall increases from the west (900 mm/year) to the east (1400 mm/year) [32] . The mean annual temperature is 27˚C and the evapotranspiration is about 1300 mm/year.
The coastal sedimentary deposits of Benin are part of the vast sedimentary basin of the Guinea Gulf (Keta basin) that extends from Ghana (in the West) to Nigeria (in the East) [33] . These deposits have a monoclinal structure characterized by a growing differential subsidence towards the southeast [34] . Eight stratigraphic units are identified based on the lithology and sedimentary indicators and extending from the upper Cretaceous (Tu-
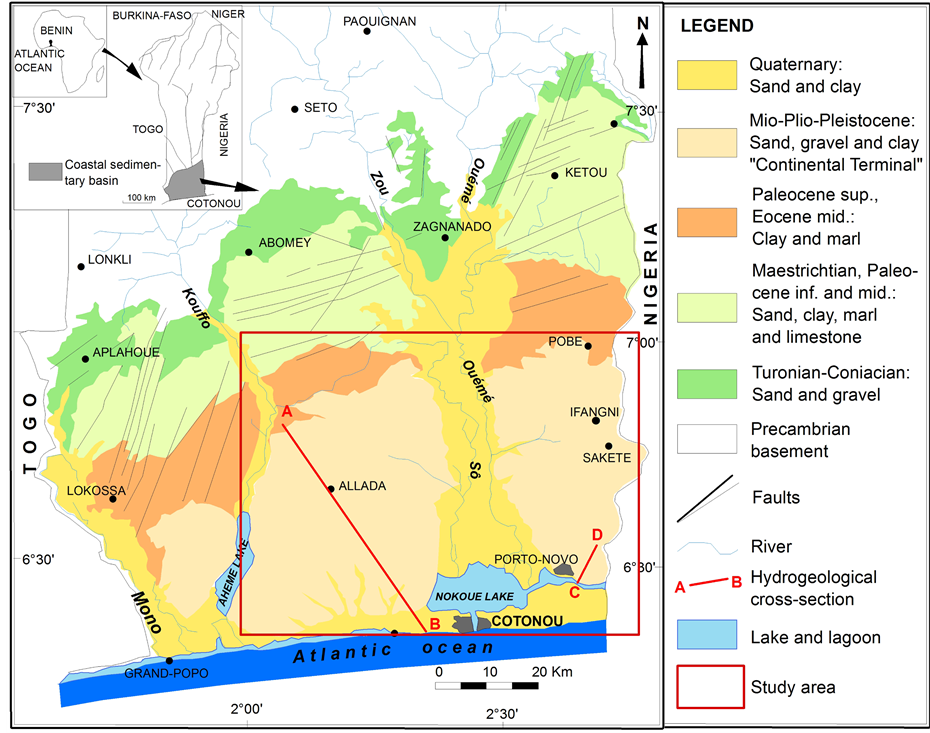
Figure 1. Location and geological map of coastal sedimentary basin of Benin [31] .
ronian-Conianian) to the Quaternary [31] [35] . The thickness and the lithology of these formations vary widely from the north to the south and from the east to the west. They consist of detrital formations (sand, gravel and clay), marls and limestones (Figure 1).
The coastal sedimentary deposits contain four aquifers (aquifers of Turonian-Coniacian-Lower Unit I, Paleocene-Lower Unit II, Continental Terminal-Units V, VI and VII and Quaternary-Unit VIII), separated from each other by clay and marls layers [34] . The most important aquifers are those of Turonian-Coniacian and the Continental Terminal.
The present study focuses on the Continental Terminal aquifer which is logged in Miocene-Pliocene-Pleisto- cene continental deposits. According to [33] [31] , the Continental Terminal begins with a sandy clay marine layer containing glauconite; the following deposits are continental and consist of sand, sandy clay, clay and sandstone, so more detrital and coarse. Layers are discontinuous and irregular with lenticular forms.
The hydrogeological cross sections of Figure 2 and Figure 3 show the structure and geometry of the Continental Terminal aquifer in Allada and Sakété plateaus. These cross sections show 3 to 5 layers in the Continental Terminal consisting of sand, gravel, clay, sandy clay and clayey sand. Three horizons of aquifer are identified in these Continental Terminal layers; the aquifer reservoir is made of sand, gravel, and clayey sand [10] [12] . All these aquifer levels are hydraulically connected because of discontinuities and lenticular forms of layers especially in the southern of Allada and Sakété plateaus (Figure 3). The Continental Terminal deposits thickness ranges between 60 meters in the north and about 200 meters in the southern of plateaus (Figure 2 and Figure 3).
The piezometric maps of Continental Terminal shallow aquifer in the study zone [10] [12] indicate a north- south flow direction from the depression of Lama towards Atlantic ocean, Porto-Novo lagoon, Nokoué and Ahémé lakes, which constitute the main discharge areas. Hydraulic gradients are generally low (0.1% to 0.3%)

Figure 2. Hydrogeological cross section of Continental Terminal on Allada plateau following AB direction of the Figure 1 [10] .

Figure 3. Hydrogeological cross section of Continental Terminal in Ouando wellfield following CD direction of the Figure 1 [12] .
without any preferential direction of flow [10] [12] . The aquifer is recharged by infiltration of rainwater through the first reddish sandy clay layer called “Terre de barre” and through some marshy depressions into the plateaus; the thickness of this first layer varies from 5 to 15 meters. The mean permeability of the shallow aquifer is 8 × 10⁻⁴ m∙s−1 in the southern of Sakété plateaus [12] ; its horizontal transmissivity varies from 4 × 10⁻³ to 14 × 10−3 m2∙s−1 and the storage coefficient ranges between 2 × 10⁻⁴ and 9 × 10⁻⁴.
3. Material and Methods
3.1. Sampling and Measure of Parameters
For the assessment of the Continental Terminal shallow aquifer quality, 99 water samples were collected (95 from groundwater and 04 from surface water) from April 2005 to August 2011 in the study area (Figure 4). The temperature, pH, and electrical conductivity (EC) were measured in the field. Also, the bicarbonates ( )
)

Figure 4. Location map of studied wells.
were determined in the field by titration with 0.1 mole/L of HCl against methyl orange indicator. Chemical elements as Na+, Ca2+, Mg2+, K+, Cl−,  and
and  were analysed at the Laboratory of Applied Hydrology of the University of Benin by means of ion liquid chromatography DIONEX ICS-1000 equipped with IonPac CS12A Analytical Column for cations, using methanesulfonic acid as eluent, and IonPac AS14A-7 μm Analytical Column for anions, using AS14A Eluent concentrate. The overall detection limit for ions was 0.04 mg/L. The ionic balance for all samples is between −5% and +5%.
The data of chemical analyses of the investigated groundwater samples are presented in Table 1.
3.2. Water Types Analysis and Hypothetical Salt Combination Evaluation
Hydrochemical data were used to determine water types with Piper diagram. To confirm the results of Piper diagram, the hypothetical salt combination [36] is used to estimate different assemblages of (Na + K)Cl, MgCl2, CaCl2, CaSO4 and Ca(HCO3)2, etc.
3.3. Statistical Analysis
All statistical evaluations were carried out using XLSTAT 2006 for windows [37] . In order to identify the most important factors controlling the groundwater geochemistry, PCA was performed. Thirteen (13) hydrochemical

Table 1. Geochemical data for the Continental Terminal aquifer and surface water.
nd = not determinated.
variables (including EC, pH, temperature, Na+, Ca2+, Mg2+, K+,  , Cl−,
  ,
,  ,
,  and
and ), and ninety nine (99) samples were treated using multivariate statistical techniques. The values of the different variables (Table 1) were standardized prior to the multivariate analyses. Table 2 presents the matrix of correlation coefficients for the hydrochemical data in Continental Terminal aquifer system. The correlation coefficient matrix measures how well the variance of each parameter can be explained by relationships with other constituents. Diagonalization of the correlation matrix transforms the original p correlated variables into p uncorrelated (orthogonal) variables called principal components, which are weighted linear combinations of the original variables [25] [28] [38] .
The characteristic roots (eigenvalues) of the principal components are a measure of their associated variances and the sum of eigenvalues coincides with the total number of variables. Correlation of principal components and original variables is given by loadings and individual transformed observations are called scores. Eigenvalues and eigenvectors were calculated for the covariance matrix. Then, the data were transformed into factors. Table 3 presents the eigenvalues and the cumulative percentages of variance associated with each factor. Factor score coefficients are derived from the factor loadings. Factor scores are computed for each sample by a matrix multiplication of the factor score coefficient with the standardized data. The value of each factor score (Table 4) represents the importance of a given factor at the sample site. A factor score >+1 indicates intense influence by the process. Very negative values (<−1) reflect areas virtually unaffected by the process, and near zero scores reflect areas with only a moderate effect of the process.
In the HCA method, the distance between samples is used as a measure of similarity [29] . Among the hierarchical agglomerative cluster analysis techniques, such as the complete linkage (furthest neighbor), average lin-
Table 2. Pearson correlation among physicochemical properties in Continental Terminal shallow aquifer. Bold values indicate a significant correlation factor.
Table 3. Loading of the components obtained from principal component analysis, with two factors: eigenvalue derived by factor analysis, and cumulative percentage explained by factors.
kage (between and within groups) and Ward’s method, the last one was selected for this study. Ward’s method clustering algorithm, using squared Euclidean distances as a measure of similarity/diversity metric, has been proven to be an extremely powerful grouping mechanism [39] . The same variables were used to classify all samples in this second analysis in order to identify the major processes of Continental Terminal shallow ground- water mineralization.
For HCA, the Euclidean distance was chosen as the distance measure, or similarity measurement, between sampling sites. Cluster analysis allows the grouping of water samples according to their similarities in terms of
Table 4. Factor scores of chemical data (in meq/L) of the current samples.
physico-chemical characteristics and major ions contents.
4. Results and Discussion
4.1. Hydrogeochemistry Analysis
Electrical Conductivity (EC), pH, water temperature (T˚C) and major element concentrations measured between 2008 and 2011 are reported in Table 1. The pH ranges from 4.02 to 7.1 with an average value of 5.4 which indicate that the Continental Terminal shallow groundwaters are acidic. The temperature varies from 26.8˚C to 32˚C; the mean of temperature (29˚C) reflects the atmospheric temperature (28˚C) owing to the fact that the investigated aquifer is superficial. Electrical conductivity varies between 36 and 1246 µS/cm with an average of 201 µS/cm. About 60% of the 96 samples gave values inferior of 100 µS/cm (from 36 to 98.7 µS/cm), 27% between 100 and 500 µS/cm and 14% between 500 and 1246 µS/cm. The waters of the Continental Terminal aquifer are characterized by low mineralization (Table 1) according to the reservoir which contains detrital deposits (gravel, sand and clayey sand). But, some points located on the edges of Nokoué lakes, Porto-Novo lagoon and Atlantic Ocean (Figure 4) present medium and high mineralization (Example of samples No 81 and 84 in Godomey well field and wells No 92, 93, 94, 95 located on the edge of Porto-Novo lagoon).
The Piper diagram of Figure 5 shows that 76% of groundwater samples are Cl-Na-Ca water type and 24% are HCO3-Ca-Na water type. Almost all the samples with electrical conductivity superior of 500 µS/cm are Cl-Na water type and have a Na/Cl ratio close to the ratio of Porto-Novo lagoon and Nokoué lake water (≈1) sampling in the same period. Moreover, lake and lagoon waters are Cl-Na-Ca water type (Figure 5) such as the majority of studied groundwater. This indicates a high impact of surface salt water in their mineralization. The other samples (with EC < 500 µS/cm), located in the centre and northern of the plateaus are characterized by Cl-Na, Cl-Ca and HCO3-Ca water types.
The mineralization of Continental Terminal aquifer is then determinated by the predominance of Cl− (1.5 to 285.8 mg/l), Na+ (0.002 to 168.07 mg/l), Ca2+ (0.61 to 58.7 mg/l), and  (0 to 175.7 mg/l).
To identify the origin and processes contributing to groundwater mineralization, some plots of relations between major elements are presented. The plot of Na+ versus Cl− (Figure 6(a)) shows a lot of points situated along the halite dissolution line. There is a high correlation between Cl− and Na+ (Table 2 and Figure 6(a)) which correlate very well with electrical conductivity (r = 0.9); these two ions contribute a lot in studied ground- water mineralization and have a same source. Continental Terminal deposits do not contain evaporates. According to the lithology of the aquifer (sand and clay), Na+ and Cl− come from the mixing with lagoon, lakes and ocean salt water and the dissolution of sea sprays by infiltrated rain water. Some points (samples No 6, 7, 8, 9, 14, 16, 55, 63, 64, 70, 74, 77, 80, 83) show a deficit of Na content on the plot of Na+ and Cl− (Figure 6(a)). Almost the same samples present an excess of Ca concentration on the plot of Ca2+ and  (Figure 6(b)). The pro- cesses in these points are indicative of reverse cation exchange reaction leading to a Na+ adsorption on clay min-

Figure 5. Piper diagram of the analysed groundwater samples.
erals and a simultaneous release of Ca2+ ions [40] . This exchange takes place by reaction with clay minerals existing in the matrix of Continental Terminal deposit [31] [33] . This hypothesis is supported by the graph in Figure 6(c) which reveals an increase inCa2+ contents and a decrease in Na+ contentsespecially in samples N˚ 63, 64, 70, 74, 77, 80, 83 and a lot of samples with EC < 100 µm/Cm. Some points (samples No 72, 76, 85 and a lot of points with EC < 100 µm/Cm) in the same graph show the cation exchange reaction (Ca2+ adsorption on clay minerals and a simultaneous release of Na+ ions).
There are discreet correlations between  and Ca2+ (r = 0.78) (Table 2 and Figure 6(b)),
  and Mg2+ (r = 0.51) and between Ca2+ and Mg2+ (r = 0.76) (Table 2). The plot of Ca2+ versus
  (Figure 6(b)) shows a lot of points along the carbonates dissolution line indicating calcite and dolomite indices dissolution. The contents of
  (0 to 165.9 mg/l) exceed the suitable limit (50 mg/l) for drinking water [41] in 11 samples (Table 1) which had been taken in the most populated parts of localities (wells No 86, 87, 88, 89, 92, 93 and 95 in Porto-Novo and Godomey). Anthropogenic activities contribute therefore to the mineralization of Continental Terminal shallow groundwaters.
The calculated of the hypothetical salt combination [36] shows that the assemblage (Na + K)Cl, NaNO3, MgCl2 and Ca(HCO3)2 characterizes the majority of water with electrical conductivity upper of 100 µS/cm (samples No 58 - 95) (Table 5). The NaCl water type dominates with more than 55% and concerns all waters with electrical conductivity superior of 500 µS/cm (samples No 83 - 95) ; the samples No 60, 61, 65, 66, 67, 75 and 79 show a high domination of Ca(HCO3)2 hypothetical salt combination ; these results confirm piper diagram interpretation. The nitrates salts characterize groundwaters of the most populated parts of Porto-Novo town with 22.9% to 50 % of NaNO3 water type within the salt combinations in samples No 68, 69, 79, 86, 88, 89 and 95. The occurrence of CaCl2 water type, with a range of 27.2% - 49.4%, and the absence of NaCl water type within the salt combinations in samples No 63, 70, 74, 77 and 83 might reflect the reverse cation exchange processes (Figure 6(c)) especially as the Continental Terminal deposits are characterized by the presence of clays in lenticular forms [31] [33] . In conclusion, the variation in the salt assemblages among the studied groundwater samples is due to the difference in the hydrochemical compositions.

Figure 6. Relationships between major elements in the analyzed sampled water: Na/Cl (a), Ca/HCO3 (b) and [(Na + K)- Cl]/[(Ca + Mg)-(SO4 + HCO3)] (c).
Table 5. The hypothetical salt combination (%) of the studied groundwater samples with EC > 100 µS/cm.
4.2. Principal Component Analysis (PCA)
The obtained factors of PCA of collected groundwater samples are presented in Table 3 and Table 4. The first factor has the highest eigenvalue sum and represents the most important source of variation in the data. Two factors, all describing 70.8% of the total variance of the data, are extracted to represent statistically the contributions influencing chemical composition of groundwater samples (Table 3).
The first component (F1), explaining 56.7% of the total variance, has highly positive loadings for the variables EC, Cl−, Na+, Ca2+, Mg2+, K+,  , and
, and  (Figure 7). The strong association of Na, Ca, Mg and Cl with EC on F1 indicates that these ions have dominant contribution to the explanation of this component which characterizes groundwater global mineralization. In the study zone, the only source of Cl− is the ocean salt water because there are no evaporites in the Continental Terminal formations. The high correlation between Na+ and Cl− (r = 0.9) and the discreet correlations between Cl− and Ca2+ (r = 0.7), Mg2+ (r = 0.5), K+ (r = 0.72) and
  (r = 0.54) (Table 2) indicate that the component F1 represents salt waters (of lagoon, lakes and Atlantic Ocean) influence in the mineralization of Continental Terminal shallow groundwater.
The second principal component (F2), explaining 14.08% of the total variance, opposes alkalinity (as ),
),

Figure 7. PCA diagram for variables loadings.
pH and  with temperature (T˚C). This axis describes anthropogenic inputs and soil CO2 diffusion in groundwater mineralization. It represents strong positive correlations characteristic of pollution by agricultural chemical fertilizers and decomposition of organic matter. The organic matter decomposition, producing CO2 in the soil, provides a large proportion of
  in shallow groundwater. The opposite evolution of
  and T˚C means that the increase of nitrates contents in groundwater is essentially observed where water table depth is lower (water table depth < 20 m, with lower temperature). So, the upper horizon of the Continental Terminal aquifer, which is captured by wells, is affected by pollution because it receives more water recharge, by infiltration of rain water, than the lower horizons exploited by boreholes. Factor F2 represents also the water-rock interaction. In fact, the infiltration water containing CO2 dissolves the indices of minerals and provides a part of Ca2+, Mg2+ and
 .
.
The spatial repartition of factor scores for F1 and F2 shows high values at water points with electrical conductivity greater than 500 µS/cm (Figure 8) which are characterized by Cl-Na water types (Figure 5) and located in more populated parts of localities on the edges of Porto-Novo lagoon and Nokoué lake (Figure 4). This spatial distribution of factor scores confirms the movements of F1 as the component of salt water contribution and F2 as the component of anthropogenic pollution and CO2 diffusion in studied groundwater mineralization.
4.3. Hierarchical Cluster Analysis (HCA)
The results of the HCA are presented in Figure 9 and Table 6. The phenon line was drawn across the dendrogram at a linkage distance of about 10 (Figure 9). Thus, samples with a linkage distance lower than 10 are grouped into the same cluster. This position of the phenon line allows a division of the dendrogram into three (03) main groups which can be further divided in five (05) clusters of groundwater samples, named C1, C2, C3, C4 and C5. As mentioned by [42] , the number of clusters could be defined by moving the position of the phenon line up or down on the dendrogram. Observation of the dendrogram reveals some indications of the level of similarity between the five (05) clusters (Figure 9). The first group (Group 1) is formed by clusters C1 and C2 and contains samples showing particularly higher values of electrical conductivity (EC > 500 µS/cm). These samples, located on the edges of Nokoué lake and Porto-Novo lagoon and in more populated part of localities, present Na-Cl water type and high contents of nitrates which strongly supports the hypothesis of the mixture with salt water and anthropogenic pollution in that region of studied aquifer. The group 2 is composed by clus-

Figure 8. PCA diagram for observations loadings.

Figure 9. Dendrogram based on agglomerative hierarchical clustering (Ward’s method) for the 96 samples taken in Continental Terminal aquifer.
Table 6. Samples contained in each of dendrogram clusters of Figure 9.
ters C3 and C4 and is characterized by samples with electrical conductivity comprised between 100 and 500 µS/cm. This group corresponds to samples with Cl-Na-Ca water type located in the center and southern parts of plateaus; in majority, these samples are concerned by cation Exchange processes (Figure 6). The third group consists of samples of clusters C5 presenting lower mineralization (EC < 100 µS/cm). Almost all HCO3-Ca water types are in this group but Cl-Ca-Na facies are predominant.
This analysis therefore confirms the conclusions obtained by classical hydrochemistry study and Principal component analysis (PCA).
5. Conclusions
This study has successfully demonstrated the utility of multivariate statistical tools including factor analysis to characterize the groundwater mineralization processes in Continental Terminal shallow aquifer in the south of Benin.
The results of the factor analysis showed 2 factors (F1 and F2) that explained 70.8% of the total variance in the groundwater quality. The evolution according to F1 means impact of salt water which characterizes the southern part of Allada and Sakété plateaus, in particular, on the edges of Nokoué lake and Porto-Novo lagoon where the samples present electrical conductivity higher than 500 µS/cm and Cl-Na water-type. Moreover, the movement of F2 means influence of anthropogenic activities reflected by high nitrate contents in the samples taken in the most populated parts of Porto-Novo town. The Component F2 explains also the diffusion of soil CO2, origin of water alkalinity (as ) and HCO3-Ca water type in the center and northern parts of plateaus. The water characterized by electrical conductivity inferior of 100 µS/cm is all implicated in Base Exchange processes.
The results of PCA are confirmed by HCA which defines three groups of samples based on electrical conductivity, water types and base exchange processes.
The results obtained through this work help to find the correlations between the sampling sites and the variables obtained by physical and chemical measurements, which can be used to construct a fast decision model for separating different water quality samples. The information could be helpful to official authorities in optimizing the groundwater management plan and enhancing their pollution control action in the south of Benin.
Acknowledgements
The authors gratefully acknowledge IAEA and IAEA experts (Prof. Yves Travi, Prof. Gendouz, Dr. Gourcy Laurence) for their contributions. We also thank the technical staff at the Laboratory of Radio-Analyses and Environment of the National Engineering School of Sfax (ENIS-Tunisia) and Laboratory of Applied Hydrology of the University of Abomey-Calavi (UAC-Benin) for their constant help and assistance during laboratory analyses.
References
- INSAE (2003) Troisième recensement général de la population et de l'habitation, février 2002: Synthèses des résultats. Rapport, Direction des études démographiques, Cotonou, Bénin.
- Totin, H.S.V., Alassane, A., Boukari, M., Faye, S. and Boko, M. (2010) Climate and Land Use Change Impacts on Groundwater Quality in the Beninese Coastal Basin of the Transboundary Aquifer System Benin-Nigeria-Togo. International Conference “Transboundary Aquifers: Challenges and New Directions” (ISARM 2010), Paris, 6-8 December 2010, 184.
- Pulido-Leboeuf, P. (2004) Seawater Intrusion and Associated Processes in a Small Coastal Complex Aquifer (Castell de Ferro. Spain). Applied Geochemistry, 19, 1517-1527. http://dx.doi.org/10.1016/j.apgeochem.2004.02.004
- Chekirbane, A., Tsujimura, M., Kawachi, A., Isoda, H., Tarhouni, J. and Benalaya, A. (2013) Hydrogeochemistry and Groundwater Salinization in an Ephemeral Coastal Flood Plain: Cap Bon, Tunisia. Hydrological Sciences Journal, 58, 1097-1110. http://dx.doi.org/10.1080/02626667.2013.800202
- Trabelsi, R., Abid, K. and Zouari, K. (2011) Geochemistry Processes of the Djeffara Palaeogroundwater (Southeastern Tunisia). Quaternary International, 257, 43-55. http://dx.doi.org/10.1016/j.quaint.2011.10.029
- Lakshmanan, E., Kannan, R. and Senthil Kumar, M. (2003) Major Ion Chemistry and Identification of Hydrogeochemical Processes of Ground Water in a Part of Kancheepuram District, Tamil Nadu, India. Environmental Geosciences, 10, 157-166. http://dx.doi.org/10.1306/eg100403011
- Kumar, M., Ramanathan, A.L., Rao, M.S. and Kumar, B. (2006) Identification and Evaluation of Hydrogeochemical Processes in the Groundwater Environment of Delhi, India. Environmental Geology, 50, 1025-1039. http://dx.doi.org/10.1007/s00254-006-0275-4
- Cloutiera, V., Lefebvrea, R., Therrienb, R. and Savardc, M.M. (2008) Multivariate Statistical Analysis of Geochemical Data as Indicative of the Hydrogeochemical Evolution of Groundwater in a Sedimentary Rock Aquifer System. Journal of Hydrology, 353, 3-4. http://dx.doi.org/10.1016/j.jhydrol.2008.02.015
- Maliki, R. (1993) Etude hydrogéologique du littoral béninois dans la région de Cotonou (A.O). Thèse de Doctorat de 3ème cycle, Université, C. A. Diop de Dakar, Sénégal.
- Boukari, M. (1998) Fonctionnement du système aquifère exploité pour l’approvisionnement en eau de la ville de Cotonou sur le littoral béninois. Impact du développement urbain sur la qualité des ressources. Thèse Doctorat ès- Science, Université C. A. Diop de Dakar, Sénégal.
- Boukari, M., Oyédé, L.M., Alidou, S., Gaye, C.B. and Maliki, R. (1995) Identification des aquifères de la zone littorale du Bénin (Afrique de l’Ouest): Hydrodynamique, hydrochimie et problèmes d’alimentation en eau de la ville de Cotonou. Africa Geoscience Review, 2, 121-139.
- Alassane, A. (2004) Etude hydrogéologique du Continental Terminal et des formations de la plaine littorale dans la région de Porto-Novo: Identification des aquifères et vulnérabilité à la pollution de la nappe superficielle. Thèse de doctorat de 3ème cycle, Université C. A. Diop de Dakar, Sénégal.
- Pallas, P. (1988) Contribution à l’étude des ressources en eau souterraine du bassin côtier du Bénin. Confrontation ressources―Besoins. Rapport du Projet PNUD.
- Boukari, M., Viane, P. and Azonsi, F. (2008) Three-Dimensional Modelling of a Coastal Sedimentary Basin of Southern Benin (West Africa). In: Adelana, S.M.A. and MacDonald, A.M., Eds., Applied Groundwater Study in Africa (2008): IAH Selected Papers on Hydrogeology, CRC Press/Balkema, Leiden, 437-456.
- Boukari, M., Alassane, A. and Azonsi, F. (2009) Evaluation par la méthode DRASTIC de la vulnérabilité de la nappe phréatique de Cotonou (Bénin méridional, Afrique de l’Ouest). Africa Géoscience Review, 16, 175-188.
- Alassane, A., Faye, A., Boukari, M. and Cissé Faye, S. (2009) Aquifer Vulnerability and Its Implication for Community Water Supply of Porto-Novo Region (South-East of Benin). In: Xu, Y.X. and Braune, E., Eds., Sustainable Groundwater Resources in Africa (2009): UNEP Selected Papers on Hydrogeology, Indexed in CRC Press, Taylor and Francis/Balkema, Leiden, 107-117. www.crcpress.com/
- Dovonou, F. (2012) Diagnostic qualitatif et environnemental de l’aquifère superficiel du champ de captage intensif de Godomey au Bénin (Afrique de l’Ouest): Eléments pour un plan d’actions stratégiques de protection des ressources en eau souterraine exploitées. Thèse de doctorat unique, Université d’Abomey-Calavi, Bénin.
- Dovonou, F., Babadjidé, C., Alassane, A., Yalo, N., Mama, D. and Boukari, M. (2012) Impact de la pollution chimique et bactériologique sur l’aquifère superficiel de la zone de captage intensif de Godomey au Sud-Bénin. Climat et Développement, 14, 55-67.
- Totin, V.S.H., Boukari, M., Odoulami, L. and Edorh, P. (2012) Qualité bactériologique des eaux souterraines et sources de pollution dans le bassin sédimentaire côtier du Bénin. Climat et Développement, 13, 16-27.
- Boukari, M., Gaye, C.B., Faye, A. and Faye, S. (1996) The Impact of Urban Development on Coastal Aquifers near Cotonou, Benin. Journal of African Earth Sciences, 22, 403-408. http://dx.doi.org/10.1016/0899-5362(96)00027-9
- Boukari, M., Alassane, A., Dovonon, F.A.L., Tossa, A. and Zogo, D. (2006) Groundwater Pollution from Urban Development in Cotonou City, Benin. In: Xu, Y. and Usher, B., Eds., Groundwater Pollution in Africa: UNEP Selected Papers on Hydrogeology Publication, Taylor and Francis/Balkema, Leiden, 125-138.
- Boukari, M. and Alassane, A. (2007) Les ressources en eaux souterraines du bassin sédimentaire côtier de la République du Bénin. Africa Geoscience Review, 14, 283-301.
- Chen, K., Jiao, J.J., Huang, J. and Huang, R. (2007) Multivariate Statistical Evaluation of Trace Elements in Groundwater in a Coastal Area in Shenzhen, China. Environment Pollution, 147, 771-780. http://dx.doi.org/10.1016/j.envpol.2006.09.002
- Liu, C.W., Lin, K.H. and Kuo, Y.M. (2003) Application of Factor Analysis in the Assessment of Groundwater Quality in a Blackfoot Disease Area in Taiwan. The Science of the Total Environment, 313, 77-89. http://dx.doi.org/10.1016/S0048-9697(02)00683-6
- Wenning, R.J. and Erickson, G.A. (1994) Interpretation and Analysis of Complex Environmental Data Using Chemometric Methods. Trends in Analytical Chemistry, 13, 446-457. http://dx.doi.org/10.1016/0165-9936(94)85026-7
- Helena, B., Pardo, R., Vega, M., Barrado, E.M., Fernandez, J. and Fernandez, L. (2000) Temporal Evolution of Groundwater Composition in an Alluvial Aquifer Pisuerga River. Spain by Principal Component Analysis. Water Research, 34, 807-816. http://dx.doi.org/10.1016/S0043-1354(99)00225-0
- Jackson, J.E. (1991) A User’s Guide to Principal Components. Wiley, New York. http://dx.doi.org/10.1002/0471725331
- Meglen, R.R. (1992) Examining Large Databases: A Chemometric Approach Using Principal Component Analysis. Marine Chemistry, 39, 217-237. http://dx.doi.org/10.1016/0304-4203(92)90103-H
- Vega, M., Pardo, R., Barrado, E. and Deban, L. (1998) Assessment of Seasonal and Polluting Effects on the Quality of River Water by Exploratory Data Analysis. Water Research, 32, 3581-3592. http://dx.doi.org/10.1016/S0043-1354(98)00138-9
- Direction de l’hydraulique (2000) Vision Eau 2025, Bénin. Rapport, Direction de l’Hydraulique, Bénin.
- IRB (1987) Etude de cartographie géologique et prospection minérale de reconnaissance au Sud du 9ème parallèle. Rapport. Istituto Recerche Breda, FED-OBEMINES.
- Le Barbé, L., Ale, G., Millet, B., Borel, Y. and Gualde, R. (1993) Les ressources en eaux superficielles de la Répub- lique du Bénin. ORSTOM Editions, Paris.
- Slanski, M. (1968) Contribution à l’étude géologique du bassin sédimentaire côtier du Dahomey et du Togo. Thèse, Université de Nancy, Nancy.
- Dray, D., Giachello, L., Lazzaroto, V., Mancini, M., Roman, E. and Zuppi, G. (1989) Etude isotopique de l’aquifère crétacé du bassin sédimentaire côtier béninois. Actes du séminaire sur le développement des techniques isotopiques et nucléaires, 3, 167-177.
- Oyédé, L.M. (1991) Dynamique sédimentaire actuelle et messages enregistrés dans les séquences quaternaires et néogènes du domaine margino-littoral du Bénin (Afrique de l’Ouest). XIIème Congrès INQUA, Montréal, Abstract 237.
- Palmer, C. (1911) The Geochemical Interpretation of Water Analysis. USGS Bulletin, 479, 4-31.
- Addinsoft, Inc. (2006) XLSTAT for Windows (Computer Program Manual).
- Mellinger, M. (1987) Multivariate Data Analysis: Its Methods. Chemometrics and Intelligent Laboratory Systems, 2, 29-36. http://dx.doi.org/10.1016/0169-7439(87)80083-7
- Willet, P. (1987) Similarity and Clustering in Chemical Information Systems. Research Studies Press, Wiley, New York.
- Stephen Fisher, R. and Mullican, W.F. (1997) Hydrochemical Evolution of Sodium-Sulfate and Sodium-Chloride Groundwater beneath the Northern Chihuahuan Dezert, Trans-Pecos, Texas, USA. Hydrogeology Journal, 5, 4-16. http://dx.doi.org/10.1007/s100400050102
- WHO (1993) Guidelines for Drinking Water Quality. 2nd Edition, Geneva. http://www.who.int/water_sanitation_health/dwq/gdwq2v1/en/
- Güler, C., Thyne, G.D., McCray, J.E. and Turner, A.K. (2002) Evaluation of Graphical and Multivariate Statistical Methods for Classification of Water Chemistry Data. Hydrogeology Journal, 10, 455-474. http://dx.doi.org/10.1007/s10040-002-0196-6
NOTES

*Corresponding author.