Journal of Minerals and Materials Characterization and Engineering
Vol.06 No.02(2018), Article ID:83147,17 pages
10.4236/jmmce.2018.62016
Characterisation of Geomechanical Properties of Bentonite Clay Used for Plug and Abandonment Operations of Coal Seam Gas Wells
Heinz-Gerd Holl1, Alexander Scheuermann2
1School of Chemical Engineering, University of Queensland, Brisbane, Australia
2School of Civil Engineering, University of Queensland, Brisbane, Australia

Copyright © 2018 by authors and Scientific Research Publishing Inc.
This work is licensed under the Creative Commons Attribution International License (CC BY 4.0).
http://creativecommons.org/licenses/by/4.0/


Received: February 13, 2018; Accepted: March 17, 2018; Published: March 20, 2018
ABSTRACT
Compressed bentonite in the form of pellets or plugs is used for the abandonment of production wells for the oil and gas industry. The design of the abandonment systems is based on the hydro-mechanical behaviour of the compressed bentonite defined by mechanical parameters that are used from published data rather than quantified for the used material by laboratory investigations. This paper presents an experimental study on characterising the swelling and shear strength behaviour of raw and polymer (polyvinylpyrrolidone, PVP) treated bentonite. Dislodgement tests consist of three hydrated bentonite plugs inserted in steel casings with the failure mechanism characterised. The bentonite used comes from a local mine (in Queensland, Australia) and is comparable to other bentonites usually used for the abandonment of wells or for other problems where mineral sealing is required (e.g. basal clay barriers of landfills). The experiments have shown that polymer treated bentonite shows significantly larger shear strengths than raw bentonite with simultaneously less swelling. More compressed samples also showed higher shear strengths and less swelling. The dislodgement tests have characterised for the first time the cascaded failure mechanism of a series of plugs forming an abandonment system. This investigation is the first step towards the development of an improved design for abandonment systems for wells using bentonite plugs.
Keywords:
Bentonite Plugs, Swelling Pressure, Shear Testing, Mechanical Dislodgement

1. Introduction
Highly compacted bentonite can be used as material to produce plugs or pellets for the abandonment of wells [1] [2] [3] [4] . In order to improve emplacement and subsequent plugging performance, at the University of Queensland bentonite is pressed into a bullet geometry with a cone shaped tip and a center hole that allows fluid to pass through and stabilise the fall of the plug to the final setting depth [4] [5] . Bentonite products in different forms have also been used for abandonment operations on various well types. Shallow water wells and seismic shot holes can be plugged using coarse grained bentonite [6] . ZoniteTM is a compressed bentonite product for well abandonment operations, exhibiting a large nodule geometry. ChevronTexaco Australia Pty Ltd. used it for plug and abandonment operations in Western Australia [7] . Being irrespective of the product used, the bentonite is expected to become nearly saturated after placing in a borehole. It is important to understand the saturation process in detail to provide input parameters for predictive modelling of the plug transient geomechanical properties and well abandonment performance.
Geomechanical data used in the modelling of the hydro-mechanical behavior to date is based on literature reviews and includes high uncertainties because it is based on different bentonite materials [4] [8] . In order to directly determine hydro-mechanical parameters of bentonite it is necessary to conduct mechanical tests at well-defined hydraulic conditions [9] [10] . Therefore, in this study a testing procedure has been developed allowing the quantification of the mechanical properties of hydrated bentonite using standard testing equipment. Direct shear testing of the hydrated bentonite increases the robustness of predictive modeling [11] . A staged laboratory program was designed to gather the swelling pressure and shear strength parameters required to simulate the hydro-mechanical behavior of bentonite plugs under the influence of water. This laboratory study involved three main components:
・ An oedometer set-up to conduct swelling tests at constant normal stress that can observe the residual swelling for different stress states;
・ Direct shear tests to determine strength parameters at different hydration states. The results of the oedometer tests are required to define the hydration state at which the mechanical tests have to be conducted; and
・ Mechanical dislodgement tests of hydrated bentonite plugs in steel casings using an electro-mechanical self-reacting loading frame to measure the force required to dislodge the plugs within the casing.
2. Materials and Sample Preparation
Two different compositions of bentonite samples have been tested: samples with a composition of raw bentonite and a bentonite/polymer mixture (polyvinylpyrrolidone, PVP). The polymer was added as a binding agent [8] . An additional effect of the PVP is the suppression of colloidal suspension of montmorillonite (the major clay mineral within the bentonite) during swelling, which stabilises the hydrated plugs. All samples were made out of the crude, dried and crushed sodium dominated bentonite derived from the CETCO Drilling Products (an AMCOL company) Gurulmundi mine in Queensland, Australia. A detailed mineralogical analysis of the bentonite material is presented in Section 4.1. The bentonite was sieved to a grainsize of <3.35 mm and compressed in a round steel container using a hydraulic press with top load and using two different masses (9.2 and 18.3 metric tons). The different compaction states of these samples cover the range of compression values that are used in the bentonite plug production. The resulting dry densities of the samples are 1.95 g/cm3 ± 0.05 for 9.2 metric tons and 2.05 g/cm3 ± 0.04 for 18.3 metric tons compression.
Samples were prepared using a hydraulic press in the laboratory of the School of Chemical Engineering. Spherical discs of 71 mm diameter and approximately 4 mm height were produced. After preparation, samples were sealed and stored for further use. The gravimetric water content of the samples was determined to be 12% ± 1%.
The bentonite plugs for the mechanical dislodgement tests were compressed in a vertical hydraulic press. Plugs were prepared out of raw bentonite material and the bentonite/PVP mixture. The hydraulic ram applied 17.2 MPa (2500 psi) pressure, which is equivalent to 14.2 metric tons using the press geometries for the 140 mm (5.5”) diameter plugs. The compressional force was applied onto the bentonite in a bullet shaped mould (sample chamber) for 2 minutes.
The plugs were loaded into 80 cm long 177.8 mm (7”) outer diameter steel pipes (161.7 mm/6 3/8” inner diameter). Each pipe contained three plugs. Overall, 14 pipe sections were set up (7 raw bentonite/7 bentonite/PVP mixture) and hydrated over 42 days, maintaining wet conditions by filling water to the top of the pipe daily.
3. Methods
3.1. X-Ray Analysis
X-Ray Diffraction (XRD) analysis was conducted to determine the bulk mineralogy of the bentonite and clay mineral analysis on the separated <2 µm clay fraction.
The bulk sample was split, crushed then weighed and a specimen prepared for XRD analysis. A randomly oriented sample was prepared for XRD analysis spiked with an internal corundum standard (Al2O3) at 10 weight % for a quantitative phase analysis. The specimens were micronized in a McCrone mill using zirconia beads and ethanol as a fluid and dried in an oven at 40˚C to evaporate the ethanol.
A small portion of the bulk sample was disaggregated and dispersed in water. The fine fraction (<2 μm) was transferred to a low background plate and allowed to settle and dry. This preparation is used to concentrate the fine (clay dominant) fraction and aids identification of the clays present. The fine fraction specimens were then further treated with ethylene glycol (which expands some clays) and re-examined. Additionally the sample was heated to 375˚C and measured again. This process caused the smectite (001) reflection to collapse, producing a diffraction pattern which is similar to illite [12] .
Step scanned XRD patterns were collected using a PANalytical vertical diffractometer using cobalt Kα radiation. Intensities were measured at a step size of 0.0167˚ 2 Theta, 43.2 s/step and a scan range from 4˚ - 90˚ 2 Theta using a 0.5˚ fixed divergence slit. Generator voltage was 40 kV and tube current 40 Ma. The collected data was analysed using JADE software for phase identification and SIROQUANT software for quantitative phase analysis using the Rietveld method. The known concentration of corundum facilitates reporting of absolute concentrations for the modelled phases. The sum of the absolute concentrations is subtracted from 100 weight % to obtain a residual, also sometimes called “amorphous content”. The residual represents the unexplained portion of the pattern: it may be non-diffracting content but will also contain unidentified phases or poorly modelled phases.
3.2. Oedometer Tests
The oedometer tests were conducted with a conventional loading frame. For the implementation of oedometer tests specific to bentonite, several modifications have been trialed and introduced compared to standard oedometer tests to avoid bentonite being squeezed out of the sample holder during swelling and to ensure repeatability of tests. As a result of these preliminary investigations, very thin (4 mm) cylindrical samples had to be prepared and used for all tests. Swelling tests have been conducted with different vertical stresses. For a vertical stress smaller than the swelling pressure, swelling occurred. Whereas the sample is compressed for a vertical stress above the swelling pressure. The swelling pressure of the compressed sample was then determined by fitting the strain at equilibrium versus the applied vertical stress. These results were used to quantify the swelling pressure and to set the initial conditions for the implementation of shear tests.
The testing program for the oedometer tests was developed through a series of pre-tests using different sample holders, disc dimensions and pre-conditioning procedures. The final testing procedure includes short-term tests over 48 hours and additional long-term tests over several days up to a week, which were then used for the final analysis of the swelling behavior. Three repetitions of short-term-tests were conducted to ensure repeatability of test results.
3.3. Direct Shear Tests
Shear tests were conducted using the direct shear module for circular samples of the loading frame also used for the oedometer tests. Three different normal stresses have been applied, namely 500, 1000 and 2000 kPa. The samples were preconditioned to establish a consistent hydration state for all tests, by applying a stress of 1000 kPa to all samples. Under this vertical stress, the sample swells until reaching equilibrium. The strain at equilibrium finally defines the hydration state of the sample.
After this preconditioning, a new stress state was adjusted and shearing initiated. No new stress condition was applied in the case of a normal stress during shearing at 1000 kPa. Changing the stress level after swelling results in further swelling if the stress level is reduced, or compression when the stress level is increased, which can alter the effective stress during shearing. However, shearing is induced at a fast rate (0.2 mm/min) to ensure the implementation of undrained conditions, i.e. shearing at constant volume within the shear zone. The influence of the overlapping processes of shearing and vertical deformation in the form of swelling and compression, especially in terms of the impact on effective stresses, is subject to future investigations. However, the primary aim of this procedure was to conduct tests at constant hydration states, which corresponds to constant densities. This was only possible by starting the shear tests immediately after changing the normal stress without awaiting a new equilibration. The hydration state did not change significantly during shearing, since shearing takes place faster than swelling or compression occurs.
3.4. Mechanical Dislodgement Tests
The mechanical dislodgement tests were conducted using an Instron 250 kN Electro-Mechanical self-reacting loading frame (Figure 1). The steel casings were installed 20 mm above the lower surface of the test rig using a clamp to allow dislodgement of the plug with some additional space for sliding within the pipe, thereby preventing additional compression of the material.

Figure 1. Bentonite plug under test using an Instron 250 kN electro-mechanical loading frame. A split collar was designed to sit against the top face of the cylinder loading seat to guarantee axial alignment of the casing with the test macine.
Each test was deemed to be complete at the point where the applied load caused the plug inside the pipe to be dislodged and move continuously. This is observable from the Load/Displacement curve, which could be monitored in real time during each test. The raw data to generate a Load/Displacement Curve was recorded for each sample. The sampling rate was 10 Hz and the loading rate was defined to be constant at 2 kN/min.
4. Results and Discussion
4.1. Powder Diffraction Measurements/Bulk Mineralogy Bentonite
Bulk mineralogy of the bentonite samples was determined by powder diffraction measurements on randomly oriented samples using an internal corundum standard (Al2O3) at 10 weight % for a quantitative phase analysis. An example for the powder diffraction of bulk bentonite samples is shown in Figure 2.
Figure 3 summarises the results of the mineral quantification of the raw bentonite material. The identified mineral phases coincide with results published by Scogings [13] . He reported the occurrence of mainly dioctahedral smectite (montmorillonite) and lesser quantities of feldspar, kaolinite, quartz and zeolite varying in the different bentonite beds mined in Gurulmundi.
Figure 3 shows a comparison of all powder diffraction measurements and delineates the remarkably consistent bulk mineralogy of the material out of seven bulker bags (three samples/bag) which was used to produce the plugs for the first abandonment field trial in Queensland in July/August 2016 [5] .

Figure 2. Example for powder diffraction measurements on randomly oriented samples of bulk bentonite out of bulker bag #8 with added internal corundum standard (Al2O3). Identified mineral phases with diagnostic peak positions at the bottom of the graph.
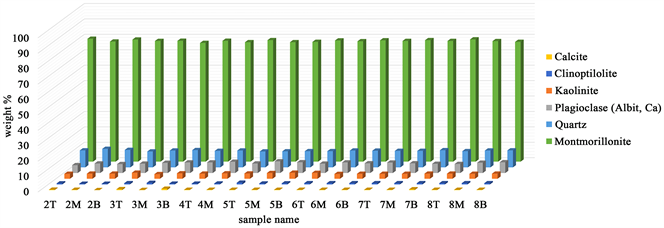
Figure 3. Bulk mineralogical composition of raw bentonite from 7 bulker bags of CETCO’s Gurulmundi bentonite deposit. Each bag was sampled three times (Top/Middle/Bottom).
The XRD measurements confirm the existence of montmorillonite, quartz and traces of kaolinite. Traces of calcite and clinoptilolite, a zeolite mineral, were also identified. The average bulk mineralogical composition of the raw bentonite is shown in Table 1.
4.2. Clay Mineralogy/Oriented Specimen < 2 µm
An example for a clay diffraction pattern (oriented specimens < 2 µm) is shown in Figure 4. The samples were measured air-dried, after being treated with ethylene glycol and after heated up to 375˚C. This is a standard procedure in clay mineralogical determinations to characterise swelling clay minerals [12] .
The position of the (001) reflections of the montmorillonite of the air-dried sample (dark blue curve in Figure 4 at 8.1˚ 2 Theta/d = 12.7 Å) can be used to estimate the interlayer cation composition and the hydration state of the clay mineral (e.g. [14] ). Treating the samples with ethylene glycol will produce very strong (001) peaks at lower 2 Theta angles (shifted to the left in Figure 4, green curve). These (001) peaks are sharp and symmetrical and show no low-angle shoulder, proving that no interstratified illite is present. The sample was then heated up to 375˚C and measured again. The montmorillonite (001) peak collapses to higher 2 Theta angles (shifted to the right in Figure 4, red curve) and is losing intensity.
The (001) reflections of the montmorillonite in the air-dried samples show asymmetric shoulders (Figure 4 blue curve, Figure 5 all diffraction patterns). The peak doublets were fitted to model position and intensity of the distinct peaks. The (001) peaks of the <2 μm fraction (Figure 5) are asymmetric with top at 8.1˚ 2 Theta (d = 12.7 Å) and a shoulder on the low angle, high d-value side (6.8˚ 2 Theta, d = 15.1 Å). D-values of (001) peaks of pure Na-montmorillonites with one layer of water molecules in the interlayer are usually close to 12 Å (8.6˚ 2 Theta). The d-values of montmorillonites with divalent cations (Ca2+, Mg2+ etc.) and two layers of water molecules in the interlayer position are in range of 14 - 15 Å (7.3˚ - 6.8˚ 2 Theta) [15] .

Table 1. Average bulk mineralogical composition (weight %) of raw bentonite from seven bulker bags of CETCO’s Gurulmundi bentonite deposit.

Figure 4. Clay XRD pattern, oriented specimen, <2 µm. Blue curve: air dried sample, green curve: ethylene glycol treted sample, red curve: heated sample (375˚C).

Figure 5. Comparison of clay XRD patterns of the oriented specimen, air dried, <2 µm fraction from the Gurulmundi mine bentonite deposit.
The <2 µm fraction of the Gurulmundi bentonite consists dominantly out of Na-montmorillonite. The composition of the montmorillonite is remarkably consistent over the full range of the tested material (Figure 5). Additionally a smaller amount of divalent cations (Ca2+, Mg2+) with two layers of water molecules are present in the interlayer position. Carlson [15] detected similar type of variations of d-values using Wyoming montmorillonite samples in a comparative study of various montmorillonites.
4.3. Swelling Pressure Determination
As a result of the oedometer tests, vertical strains were observed for different normal stresses. Expansion occurred for vertical stresses below the swelling pressure expansion, while compression was caused with stresses larger than the swelling pressure. Figure 6 shows the transient evolution of the short- and long-term strain measurements (swelling) at a normal stress of 4.5 kPa for all samples with and without PVP and compressed with 9.2 and 18.3 metric tons.
The results illustrated in Figure 6 shows further differences between both materials such as:
・ The PVP treated bentonite samples show up to 20% reduced swelling than raw bentonite samples;
・ Swelling of samples compressed with 18.3 tons is up to 30% larger than for samples compressed with 9.2 tons; and
・ Swelling of the PVP treated samples is faster at the beginning of the test. It takes longer for the raw bentonite sample to reach comparable strains. A constant strain value is reached for all samples after a similar hydration time.
Figure 7 shows the analysis of swelling pressure from the long-term oedometer tests. The final swelling/compression strains were plotted versus the applied normal stress and a polynomial fitting function was used to characterise the relationship.
The strain monotonically increased eventually reaching positive values for higher normal stresses, as expected. Only the raw sample compressed at 18.3t (solid red curve) showed a decrease in the strain for the highest applied normal stress. Even for another repeated test, this result was confirmed. It is not entirely clear why the strain reduced for a higher stress for this sample, and it was not further investigated, since the aim to quantify the swelling pressure was reached.
As can be seen from Figure 7, the swelling pressure―as the transition from negative to positive strains―varies between 1580 and 1740 kPa. In the case of samples compressed with 9.2 t, the addition of PVP does not seem to influence the resulting swelling pressure. For samples with higher compression of 18.3 t, the swelling pressure is higher, at least for the samples with PVP addition.
4.4. Shear Strength
The summary of all shear strengths derived from the shear tests is shown in Figure 8 as shear stress versus normal stress. Also shown are the values for friction angle and cohesion according to the Mohr-Coulomb failure criterion.

Figure 6. Comparison of results from oedometer tests at a stress of 4.5 kPa for all sample types. The dashed lines represent test results for samples compressed with 9.2 metric tons and the solid lines show results for samples compressed with 18.3 metric tons. Red curves represent raw samples while blue curves show PVP treated samples. Bold lines show long-term test results and thin lines results of short-term tests. The step change in the curve for 9.2 raw sample is caused by an error in the reading of the vertical extension during the test.

Figure 7. Comparison of all polynominal fits of the stress/strain relationships of the long-term swelling tests. The horizontal dashed line marks the line of no vertical deformation.
From the results in Figure 8 it is evident that there is a distinct difference between raw and PVP treated samples as well as between the samples compressed with different masses.
・ PVP treated samples show a much larger frictional behavior than raw bentonite samples. The friction angle varies between 6.0˚ for 9.2t compressed

Figure 8. Comparison of all shear test results with the Mohr-Coulomb failure criterion for the ultimate shear strength.
samples and 6.7˚ for 18.3 t compressed samples. The friction angles for raw bentonite samples are much smaller, with 1.4˚ for 9.2t and 1.8˚ for 18.3t compressed samples.
・ Samples compressed with 18.3 t show a larger shear strength than samples compressed with 9.2 t, regardless of the material composition. The difference in shear strength is larger for PVP treated samples than for raw bentonite samples. The difference is visible in friction angle and cohesion, though the influence on cohesion is significantly larger.
・ The coefficient of internal friction µ varies from 0.024 (9.2 t) to 0.031 (18.3 t) for the raw bentonite and from 0.105 (9.2 t) to 0.117 (18.3 t) for the polymer treated samples.
One needs to keep in mind that no measurements have been made for stresses smaller than 500 kPa while analysing the results shown in Figure 8. It could be possible that the linear relationship between shear stress and normal stress described by the Mohr-Coulomb failure criterion is not valid in this stress range.
4.5. Mechanical Dislodgement of the Plugs
The experiments using the Instron loading frame for dislodgement of hydrated bentonite plugs showed gradual failure of the stacked plugs within the tested pipe section. The plugs were dislodged after 42 days of hydration. Summary graphs for Load/Displacement curves are shown in Figure 9 and Figure 10.
Some tests were interrupted due to technical issues. Additional continuation measurements were run when these tests were recommenced after failure of the apparatus (e.g. #6 cont in Figure 10).
Load/Time graphs were used to identify the maximum force at peak failure (compare Figure 11 & Figure 12).

Figure 9. Comparison of load/displacement curves of six bentonite/PVP blend samples. Sample numbers are colour coded.

Figure 10. Comparison of load/displacement curves of 6 raw bentonite samples. Continuation measurements had to be conducted for samples #6 and #7 after failure of the rig.
These tests showed for the first time that all stacked bentonite plugs are failing gradually. The final dislodgment of the bentonite/PVP blend happened on average 75 seconds later than the raw bentonite samples (Figure 11 & Figure 12). The gaps between the single plugs and the central hole in each plug were not visible anymore after dislodgment but a clear difference in material stiffness was still detectable.
Each of the red marked areas in the sketch on the left-hand side of Figure 13 undergoes compaction during the dislodgment of the sample. The curve flattens out after slip/failure of the first plug, with continuous movement at an interval of lower force increase when these sections are compacted (red arrows

Figure 11. Comparison of load/time curves of six bentonite/PVP blends. Sample numbers are colour coded.

Figure 12. Comparison of load/time curves of six raw bentonite samples. Continuation measurements had to be conducted for samples #6 and #7 after failure of the rig.
in Figure 13). Then the curve starts getting steeper again after the second plug is dislodged.
This process is repeated with the third plug until final failure of the complete set of plugs occurs and they are pushed out of the casing (yellow arrow in Figure 13). The dislodgment curves clearly show that the force required to dislodge another plug reduces with ongoing testing, which makes sense as the overall friction reduces once a plug has failed and only residual strength exists for parts of the sample leading to this cascaded failure mechanism (Figure 9 & Figure 10).
This observation represents major progress in understanding of the failure process when compared with the results derived from earlier experiments using hydraulic presses equipped with a digital pressure gauge (e.g. Towler et al., 2015).

Figure 13. Simplified load/displacement curve showing stepwise geometry due to gradual failure of the 3 bulled shaped plug segments.
These tests using the Instron loading frame have allowed the characterisation of the detailed dislodgement process for the first time. It is planned to extend these experiments to different casing sizes and tubing with different internal roughness (corrosion states).
An additional outcome of the experiment was the proof of different dislodgement pressure regimes for the materials used. The bentonite/PVP blend showed dislodgement pressure gradients of 599.5 kPa/m ± 29.5 (26.5 psi/ft ± 1.4) after 42 days of hydration, whereas the raw bentonite only went up to a gradient of 400.4 kPa/m ± 43 (17.7 psi/ft ± 1.9). This accords to 6 MPa (870 psi) for the bentonite/PVP mix or 4 MPa (580 psi) for the raw bentonite using a 10 m plug section. The tests show that 33% higher pressures are needed for dislodgment of the bentonite/PVP blend plugs than those composed of raw bentonite.
These observations seem to be in conflict with test results from the oedometer measurements, which showed that the bentonite/PVP material show much reduced swelling when compared with the raw bentonite samples. However, it reflects as well the fact that PVP treated samples have a more pronounced frictional behaviour than samples made of raw bentonite.
An increase in swelling does not necessarily result in an increased shear strength. The shear strength is composed of cohesion and friction. Cohesion always exists while friction depends on the swelling pressure. Friction angle and cohesion are both influenced by the sample structure formed by the clay minerals and influenced by additives such as PVP. The influence of the hydration and the hydration history, especially on the shear strength of bentonite is subject to future experiments. They will help to reveal the influence of PVP in the hydro-mechanical behaviour of treated and untreated bentonite in terms of swelling and shear strength.
5. Conclusions
Standard geotechnical investigations have been conducted with raw and PVP treated bentonite to investigate the swelling and shear strength behaviour of plugs compressed at two different weights for assessing their applicability for the abandonment of wells. Furthermore, dislodgement tests with several hydrated plugs inserted in steel casings have been conducted for characterising the failure process of a short section of an abandonment system. A clay mineralogical investigation gave insight into the composition and nature of the bentonite used in this study. The results of the presented study can be summarised as follows:
・ In terms of the swelling behaviour, raw bentonite shows larger swelling than PVP treated samples with the largest swelling occurring for samples compressed with the larger weight. The swelling pressure of both, raw and PVP treated bentonite, varied only insignificantly between 1580 kPa and 1740 kPa.
・ With regards to the shear strength measured in the direct shear tests, PVP treated samples have revealed a more pronounced frictional behavior compared to raw bentonite. The friction angle of the PVP treated samples is nearly four times larger than the friction angle of the raw bentonite samples. It should be noted that the cohesion of raw bentonite shows larger values than for PVP treated samples. However, as no tests have been conducted at lower stresses, these values might be falsified and are therefore not discussed in detail. As expected, the samples compressed at larger weight always showed the higher shear strength.
・ The dislodgement tests of an abandonment segment consisting of three hydrated plugs revealed for the first time the cascaded failure mechanism of a series of plugs. This mechanism is characterised by the compaction of the soft material between the plugs and the failure of individual plugs within the chain of plugs. PVP treated samples revealed 33% higher pressures required to bring the system to failure than raw samples, which confirm the results of the shear strength investigations, but to some degree contradict the expectations from the swelling tests.
These investigations represent a first step into improving not only our understanding of the coupled hydro-mechanical behaviour of PVP treated bentonite, but will also help to better design more efficient abandonment systems based on compressed bentonite plugs.
Additional investigations were recently conducted to test dislodgment behavior using a well bore simulator. Plugs will be hydraulically dislodged using water pressures up to 1000 psi. The simulator is also designed to perform dislodgment experiments using gas pressure to mimic downhole conditions of Coal Seam Gas Wells.
Modifications of the geotechnical tests are in preparation to improve the accuracy of the parameterization of the compressed bentonite. Observations of the pore water pressure during shear tests will allow measurement of the effective stresses and will create therefore more confidence in the resulting shear strength parameters. Furthermore, the swelling pressure will be directly measured using adjusted oedometer molds.
Acknowledgements
This research was funded by The University of Queensland Centre for Coal Seam Gas (UQ-CCSG) and its industry members (Arrow Energy, Australia Pacific LNG, Santos and Shell/QGC) and the Queensland Government Advance Queensland Innovation Partnerships program.
Cite this paper
Holl, H.-G. and Scheuermann, A. (2018) Characterisation of Geomechanical Properties of Bentonite Clay Used for Plug and Abandonment Operations of Coal Seam Gas Wells. Journal of Minerals and Materials Characterization and Engineering, 6, 218-234. https://doi.org/10.4236/jmmce.2018.62016
References
- 1. Ogden, F.L. and Ruff, J.F. (1991) Setting Time Effects on Bentonite Water-Well Annulus Seals. Journal of Irrigation and Drainage Engineering, 117, 534-545. https://doi.org/10.1061/(ASCE)0733-9437(1991)117:4(534)
- 2. Ogden, F.L. and Ruff, J.F. (1993) Strength of Bentonite Water-Well Annulus Seals in Confined Aquifers. Journal of Irrigation and Drainage Engineering, 119, 242-250. https://doi.org/10.1061/(ASCE)0733-9437(1993)119:2(242)
- 3. Towler, B.F. and Ehlers, G.C. (1997) Friction Factors for Hydrated Bentonite Plugs. SPE Rocky Mountain Regional Meeting, Casper, 18-21 May 1997, SPE 38347. https://doi.org/10.2118/38347-MS
- 4. Towler, B.F., Victorov, H., Zamfir, G. and Ignat, P. (2008) Plugging Wells with Hydrated Bentonite, Part 2: Bentonite Bars. SPE Annual Technical Conference and Exhibition, Denver, 21-24 September 2008, SPE-115524.
- 5. Towler, B.F., Firouzi, M., Holl, H.-G., Gandhi, R. and Thomas, A. (2016) Field Trials of Plugging Oil and Gas Wells with Hydrated Bentonite. Proceeding of SPE Asia Pacific Oil & Gas Conference and Exhibition, Perth, 25-27 October 2016, SPE-182199-MS.
- 6. James, M.C. (1996) Using Coarse Ground Bentonite to Plug and Abandoned Holes. Water Well Journal, 50, 44-47.
- 7. Clark, J. and Salsbury, B. (2003) Well Abandonment Using Highly Compressed Sodium Bentonite—An Australian Case Study. SPE/EPA/DOE Exploration and Production Environmental Conference, San Antonio, 10-12 March 2003, SPE-80592-MS.
- 8. Towler, B.F., Firouzi, M., Mortezapour, A. and Hywel-Evans, P.D. (2015) Plugging CSG Wells with Bentonite: Review and preliminary Lab Results. SPE Asia Pacific Unconventional Resources Conference and Exhibition, Brisbane, 9-11 November 2015, SPE-176987. https://doi.org/10.2118/176987-MS
- 9. Lloret Morancho, A., Villar, M.V., Sanchez, M., Gens Solé, A., Pintado Llurba, X. and Alonso Pérez de Agreda, E. (2003) Mechanical Behaviour of Heavily Compacted Bentonite under High Suction Changes. Géotechnique, 53, 27-40.
- 10. Romero, E., Villar, M.V. and Lloret, A. (2005) Thermo-Hydro-Mechanical Behaviour of Two Heavily Overconsolidated Clays. Engineering Geology, 81, 255-268. https://doi.org/10.1016/j.enggeo.2005.06.011
- 11. Dueck, A., Börgesson, L. and Johannesson, L.E. (2010) Stress-Strain Relation of Bentonite at Undrained Shear. Laboratory Tests to Investigate the Influence of Material Composition and Test Technique. Swedish Nuclear Fuel and Waste Management Company Technical Report TR-10-32, Svensk Kärnbränslehantering AB.
- 12. Moore, D.M. and Reynolds Jr., R.C. (1997) X-Ray Diffraction and the Identification and Analysis of Clay Minerals. 2nd Edition, Oxford University Press, New York.
- 13. Scogings, A. (2014) AMCOL Australia’s Gurulmundi Mine. A Leading Supplier of High Quality Sodium Bentonites. Industrial Minerals Magazine, 2014, 39-43.
- 14. Oueslati, W., Ben Raheim, H., Landson, B. and Ben Haj Amara, A. (2009) Selectivity of Na-Montmorillonite in Relation with the Concentration of Bivalent Cation (Cu2+, Ca2+, Ni2+) by Quantitative Analysis of XRD Patterns. Applied Clay Sciences, 43, 224-227. https://doi.org/10.1016/j.clay.2008.09.010
- 15. Carlson, L. (2004) Bentonite Mineralogy—Part 2: Mineralogical Research of Selected Bentonites. POSIVA Working Report 2004-02.