Journal of Minerals and Materials Characterization and Engineering
Vol.2 No.4(2014), Article
ID:48034,8
pages
DOI:10.4236/jmmce.2014.24034
Statistical Analysis for the Abrasive Wear Behavior of Al 6061
Mohd Shadab Khan1, Zahir Hasan2, Yaqoob Ali Ansari1
1Department of Mechanical Engineering, Integral University, Lucknow, India
2Jahagirabad Institute of Technology, Jahangirabad, India
Email: mdshadabkhan@yahoo.com, zahir_hasan@yahoo.com, yaqoob2006@gmail.com
Copyright © 2014 by authors and Scientific Research Publishing Inc.
This work is licensed under the Creative Commons Attribution International License (CC BY).
http://creativecommons.org/licenses/by/4.0/


Received 2 April 2014; revised 14 May 2014; accepted 3 June 2014
ABSTRACT
In the present study, a mathematical model has been developed to predict the abrasive wear behavior of Al 6061. The experiments have been conducted using central composite design in the design of experiments (DOE) on pin-on-disc type wear testing machine, against abrasive media. A second order polynomial model has been developed for the prediction of wear loss. The model was developed by response surface method (RSM). Analysis of variance technique at the 95% confidence level was applied to check the validity of the model. The effect of volume percentage of reinforcement, applied load and sliding velocity on abrasive wear behavior was analyzed in detail. To judge the efficiency and ability of the model, the comparison of predicted and experimental response values outside the design conditions was carried out. The result shows, good correspondence, implying that, empirical models derived from response surface approach can be used to describe the tribological behavior of the above composite.
Keywords:Abrasive Wear, Orientation, ANOVA

1. Introduction
Wear is related to interactions between surfaces and more specifically the removal and deformation of material on a surface as a result of mechanical action of the opposite surface [1] . The need for relative motion between two surfaces and initial mechanical contact between asperities is an important distinction between mechanical wear compared to other processes with similar outcomes [2] . Wear is a continuous process in which material is degraded at every cycle. Kloss et al. emphasized that the various tools such as wear measuring equipments, mathematical modeling, tribo-meters and simulations were used for measuring wear resistance and wear rate over many decades. It was observed by several authors [3] -[13] that the variation of friction and wear rate depends on interfacial conditions such as normal load, geometry, relative surface motion, sliding speed, surface roughness of the rubbing surfaces, type of material, system rigidity, temperature, stick slip, relative humidity, lubrication and vibration. Al 6061 is widely used in numerous engineering applications including transport and construction where, superior mechanical properties such as tensile strength and hardness are essentially required. This paper is in series with “Effect of Orientation and Applied Load on Abrasive Wear Property of Alumunium Alloy-Al 6061 and Brass 6040” [14] [15] .
The objective of this work is to perform the statistical analysis for the abrasive wear behavior of Al 6061 at different orientation and at different loads and to form the equation wear.
2. Materials and Methods
In order to carry out the experimental work the following procedure is adopted: 1) specimen preparation; 2) materials selection; 3) response surface methodology (RSM).
2.1. Specimen Preparation
The specimen for wear studies was cut from the Al alloy bar. The specimen cross section used was 1 cm × 1 cm with a length of 4.5 cm. The top and bottom surfaces of specimen were made planer by polishing against emery papers of appropriate grits. For the preparation of the surface to be used for wear studies, the final grit size of the emery paper was the same as the one to be used for the wear studies.
2.2. Material for Wear Studies
For wear study, the material selected is Al 6061 alloy. The wear studies were conducted against grinding disc for different load at different orientation. The selection of load and orientation discussed later.
2.3. Selection of Applied Load and the Position of the Specimen
For wear studies the following loads were selected 1) 5 N, 2) 10 N, 3) 15 N, 4) 20 N. For each load the orientation of the specimen was kept at 0˚, 30˚, 45˚, 60˚ and 90˚ respectively.
2.4. Response Surface Methodology (RSM)
RSM is a collection of mathematical and statistical techniques that are useful for the modeling and analysis of problems in which output or response is influenced by several input-variables and objective is to find the correlation between the response and the input-variables. Farias et al. [16] studied the sliding wear of austenitic stainless steels. They adopted to obtain an empirical model of wear rate as a function of applied load and sliding velocity using RSM. A polynomial model of second order type was proposed to represent the relationship between wear loss and tribo test independent variables. In the present work, the input variables are angle of orientation (A) measured in degree and normal applied load (L) measured in Newtons and the output (response) is wear loss (W) measured in milligram (mg). A response surface model given in Equation (1) is usually expressed as:
![]() (1)
(1)
where A is constant of equation. B1, B2, B3, B4, … Bn are the unknown regression coefficients and X1, X2, … Xk are the input variables that influence the response Y, k is the number of input factors. The method of least square is used to estimate the coefficients of the second order model. The response surface analysis is then done in terms of the fitted surface. The degree of significance of the model was tested by analysis of variance (ANOVA) using the software MINITAB-15.
2.5. Design of Experiments (DOE)
A central composite design (CCD) is used with two design factors of each of three levels to describe response of the wear loss and to estimate the parameters in the second-order model. Table 1 shows important factors and their levels for abrasive wear. A central composite design (CCD) has following parameters.

Table 1. Important factors and their levels for abrasive wear.
3. Result and Discussion
3.1. Development of Wear Model
Central composite design of full factorial was used, a total of 14 experiments are conducted and regression coefficients were calculated as shown in Table2
By analyzing the estimated regression coefficients of CCD (Full Model-Uncoded Units) as shown in Table3 The mathematical model of wear loss (W) can be expressed in term of the un-coded values of the independent variables in the Equation (2) given below:
 (2)
(2)
3.2. Analysis of Variance (ANOVA)
Analysis of variance (ANOVA) and the F-ratio test have been performed to check the adequacy of the model as well as the significance of the individual model coefficients. The ANOVA was carried out on the model for a confidence level of 95%. The results of ANOVA tables for wear loss are listed in Table 2 and Table4 Table 2 presents the ANOVA table for the second order model propose for wear loss given in Equation (2). It can be appreciated that the P-value is less than 0.05 which means that the model is significant at 95% confidence level. Furthermore, the significance of each coefficient in the full model was examined by the t-values and P-values and the results are listed in Table4 The larger values of t-test and smaller values of “P” indicate that the corresponding coefficient is highly significant [17] . Hence, the results given in Table 4 suggest that the influence of load (L2) and orientation × load (A × L) are non-significant and therefore can be removed from the full model to further improve the model. By doing so, the full model for the wear loss is expressed in Equation (3).
 (3)
(3)
3.3. Analysis of Variance for Reduced Model
ANOVA was performed on the reduced model and the results are presented in Table 5 in coded units and Table 6 in un-coded units and found that the model is highly significant. Thus, Equation (4) represents the un-coded form of final empirical model for wear loss of Al 6061. It should be noted that the above equations are valid over the range of conditions 0˚ ≤ orientation (angle) ≤ 90˚ and 10 N < normal applied load < 20 N for abrasive wear of above composite against 400 grit size.
By taking regression coefficient values for reduced model, the full model for the wear loss can be reduced as:
 (4)
(4)
3.4. Residual Plots for Wear Loss
The regression model is used for determining the residuals of each individual experimental run. The difference between the measured values and predicted values are called residuals. The residuals are calculated and ranked in ascending order. The normal probabilities of residuals are shown in Figure 1. The normal probability plot is used to vary the normality assumption. As shown in Figure 1, the data are spread roughly along the straight line. Hence it can be concluded that the data are normally distributed [18] .
Figure 2 is used to show the correlation between the residuals and from this, it is emphasized that a tendency to have runs of positive and negative residuals indicates the existence of a certain correlation. Also the plot shows that the residuals are distributed evenly in both positive and negative long the run. Hence the data can be said to be independent.
Table 2. Analysis of variance for wear (full model).
Table 3. Estimated regression coefficients for wear using data in uncoded units.
Table 4. Estimated regression coefficients of wear (full model).
Table 5. Estimated regression coefficients for wear (coded units).
Figure 3 indicates the residuals versus fitted values, which shows only the maximum variation of −0.04 to +0.04 gm in wear loss between the measured and the fitted values. This plot does not reveal any obvious pattern and hence the fitted model is ample.
Table 6. Estimated regression coefficients for wear using data in uncoded units.
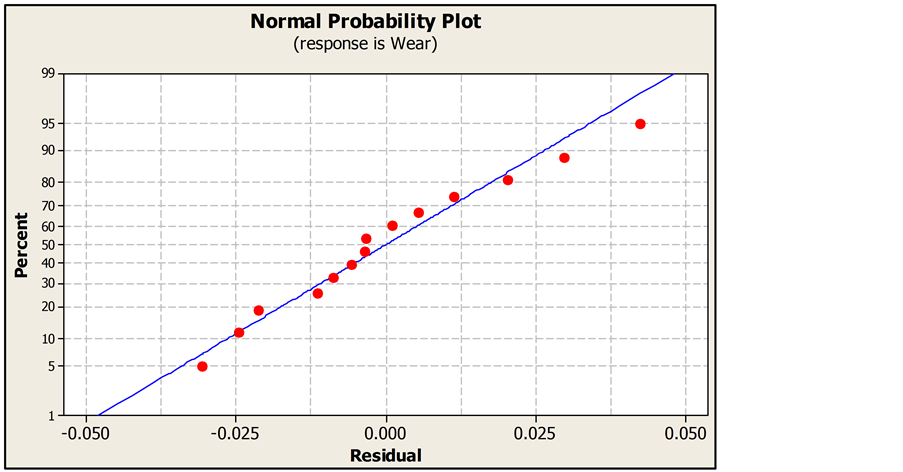
Figure 1. Normal probability plot of the residuals.
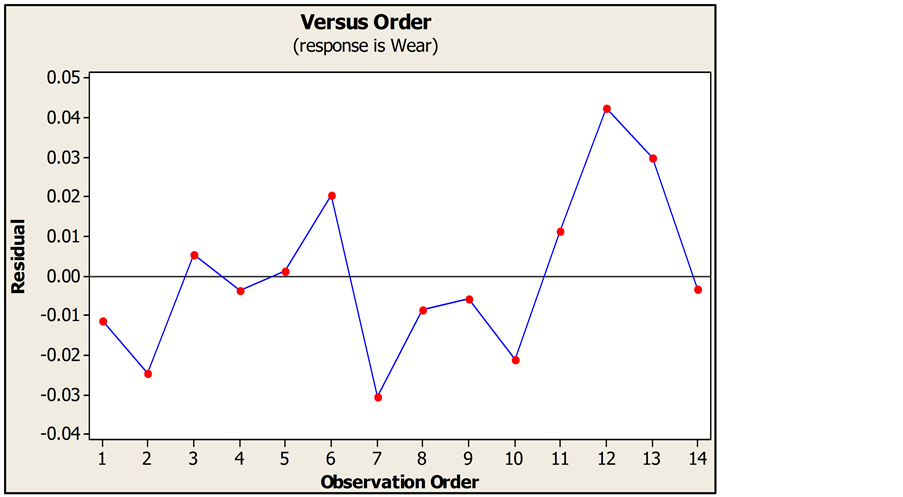
Figure 2. Residual versus order of the data.
3.5. Checking Adequacy of Mathematical Models
The goodness of fit of the mathematical models was also tested by coefficient of determination (R2) and adjusted coefficient of determination (R2 adj). The R2 is the proportion of the variation in the dependent variable explained by the regression model. On the other hand, R2 adj is the coefficient of determination adjusted for the number of independent variables in the regression model. Unlike R2, the R2 adj may decrease if the variables are entered in the model that does not add significantly to the model fit. The R2 and R2 adj values of mathematical models are found 0.974 and 0.967 respectively which clearly indicate the very good correlation between the experimental and the predicted values of the responses.
3.6. Validity of the Models
The performance of the developed model was tested using five experimental data which were never used in the modeling process. The results predicted by the developed model were compared with the measured values and also average percentage deviation (φp) was calculated and presented in the Table7 The results indicate that the model predicted wear loss has good validity with acceptable percentage deviation.
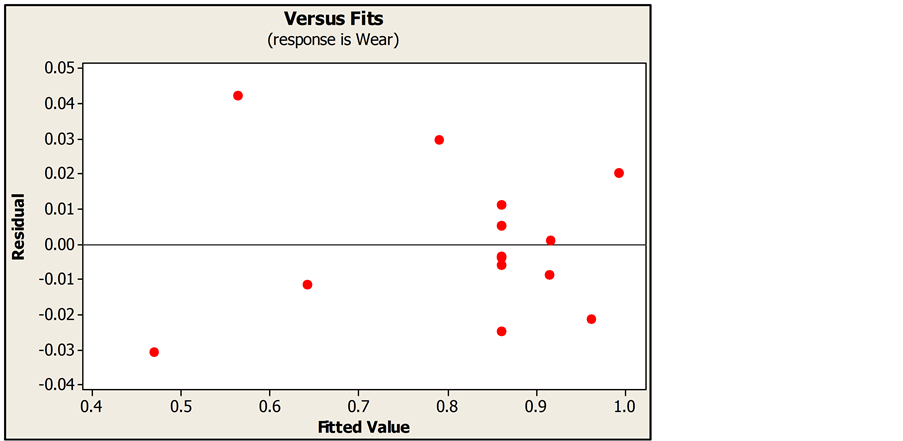
Figure 3. Residuals versus the fitted values.
Table 7. Comparison of the predicted and measured results.
4. Conclusion
The present study has used central composite design of experiments to develop a second-order polynomial equation for describing abrasive wear behavior of Al 6061. The relationship of abrasive wear loss with orientation and applied load has been successfully obtained by using RSM at the 95% confidence level. This model is valid within the ranges of selected experimental parameters of orientation and applied load. The accuracy of the Response Surface Model was verified with three sets of experimental data which were never used in modeling and average percentage deviation calculated as 2.512%. The results obtained are in accordance with the work done on Statistical Analysis for the Abrasive Wear Behavior of Bagasse Fiber Reinforced Polymer Composites [19] .
References
- Rabinowicz, E. (1995) Friction and Wear of Materials. John Wiley and Sons, New York.
- Williams, J.A. (2005) Wear and Wear Particles—Some Fundamentals. Tribology International, 38, 863-870. http://dx.doi.org/10.1016/j.triboint.2005.03.007
- Archard, J.F. (1980) Wear Theory and Mechanisms. In: Peterson, M.B. and Winer, W.O., Eds., Wear Control Handbook, ASME, New York, 35-80.
- Tabor, D. (1987) Friction and Wear—Developments over the Last 50 Years, Keynote Address. Proceedings of International Conference on Tribology—Friction, Lubrication and Wear, London, 157-172.
- Oktay, S.T. and Suh, N.P. (1992) Wear Debris Formation and Agglomeration. ASME Journal of Tribology, 114, 379-393. http://dx.doi.org/10.1115/1.2920897
- Saka, N., Liou, M.J. and Suh, N.P. (1984) The Role of Tribology in Electrical Contact Phenomena. Wear, 100, 77-105. http://dx.doi.org/10.1016/0043-1648(84)90007-3
- Suh, N.P. and Sin, H.C. (1980) On the Genesis of Friction and Its Effect on Wear. In: Cheng, H.S. and Keer, L.M., Eds., Solid Contact and Lubrication, 39, ASME, New York, 167-183.
- Aronov, V., D’Souza, A.F., Kalpakjian, S. and Shareef, I. (1983) Experimental Investigation of the Effect of System Rigidity on Wear and Friction-Induced Vibrations. ASME Journal of Lubrication Technology, 105, 206-211. http://dx.doi.org/10.1115/1.3254566
- Aronov, V., D’Souza, A.F., Kalpakjian, S. and Shareef, I. (1984) Interactions among Friction, Wear, and System Stiffness—Part 1: Effect of Normal Load and System Stiffness. ASME Journal of Tribology, 106, 54-58. http://dx.doi.org/10.1115/1.3260867
- Aronov, V., D’Souza, A.F., Kalpakjian, S. and Shareef, I. (1984) Interactions among Friction, Wear, and System Stiffness—Part 2: Vibrations Induced by Dry Friction. ASME Journal of Tribology, 106, 59-64. http://dx.doi.org/10.1115/1.3260868
- Aronov, V., D’Souza, A.F., Kalpakjian, S. and Shareef, I. (1984) Interactions among Friction, Wear, and System Stiffness—Part 3: Wear Model. ASME Journal of Tribology, 106, 65-69. http://dx.doi.org/10.1115/1.3260869
- Lin, J.W. and Bryant, M.D. (1996) Reduction in Wear Rate of Carbon Samples Sliding against Wavy Copper Surfaces. ASME Journal of Tribology, 118, 116-124. http://dx.doi.org/10.1115/1.2837065
- Chowdhury, M.A., Khalil, M.K., Nuruzzaman, D.M. and Rahaman, M.L. (2011) The Effect of Sliding Speed and Normal Load on Friction and Wear Property of Aluminum. International Journal of Mechanical & Mechatronics Engineering IJMME-IJENS, 11, 45-49.
- Khan, M.S. and Hasan, Z. (2013) Effect of Orientation and Applied Load on Abrasive Wear Property of Alumunium Alloy-Al 6061. International Journal of Mechanical En-gineering & Technology (IJMET), 4, 80-87.
- Khan, M.S., et al. (2014) Effect of Orientation and Applied Load on Abrasive Wear Property of Brass 60:40. Journal of Minerals and Materials Characterization and Engineering, 2, 49-53. http://dx.doi.org/10.4236/jmmce.2014.21008
- Farias, M.C.M., Souza, R.M., Sinatora, A. and Tanaka, D.K. (2007) The Influence of Applied Load, Sliding Velocity and Martensitic Transformation on the Unlubricated Sliding Wear of Austenitic Stainless Steels. Wear, 263, 773-781. http://dx.doi.org/10.1016/j.wear.2006.12.017
- Majumder, A. and Goyal, A. (2008) Enhanced Production of Exocellular Glucansucrase from Leuconostoc Dextranicum NRRL B1146 Using Response Surface Method. Bioresource Technology, 99, 3685-3691. http://dx.doi.org/10.1016/j.biortech.2007.07.027
- Shew, Y.W. and Kwong, C.K. (2002) Optimization of the Plated through Hole Process Using Experimental Design and Response Surface Methodology. International Journal of Advanced Manufacturing Technology, 20, 758-764. http://dx.doi.org/10.1007/s001700200235
- Mishra, P. (2012) Statistical Analysis for the Abrasive Wear Behavior of Bagasse Fiber Reinforced Polymer Composite. International Journal of Applied Research in Mechanical Engineering, 2, 7-11.