Journal of Financial Risk Management
Vol.09 No.03(2020), Article ID:103127,16 pages
10.4236/jfrm.2020.93014
Effects of Monetary Policy on Stock Market Performance in Africa Evidence from Ten (10) African Countries from 1980 to 2019
Michael Asiedu1*, Emmanuel Owusu Oppong2, Orazgylyjova Gulnabat2
1School of Finance, Zhongnan University of Economics and Law, Wuhan, China
2School of Finance, Central Uinversity of Finance and Economics, Beijing, China

Copyright © 2020 by author(s) and Scientific Research Publishing Inc.
This work is licensed under the Creative Commons Attribution International License (CC BY 4.0).
http://creativecommons.org/licenses/by/4.0/


Received: August 15, 2020; Accepted: September 22, 2020; Published: September 25, 2020
ABSTRACT
For a better insight and understanding of how monetary policy and the financial market in less developed countries such as those in Africa are interrelated; there is a need to also understand and appreciate the fundamentals of these economies and the associating imperfections within their financial systems due to the fact that they are less liberalized, relatively young, highly illiquid, logistically constrained among others. This study is a comprehensive analysis of the dynamics in stock market performance following changes in monetary aggregates in ten (10) selected African countries from 1993 to 2019. We adopted three stock market performance indicators; namely S & P global equity index, stock turnover and stock market capitalization as dependent variables and inflation, broad money growth, exchange rate, real interest rate and commercial bank and lender serving as independent variables. We then employed the random effect model based on our results from the Hausman test and VECM after co-integration was established among the variables. The study established the presence of a monetary transmission mechanism following changes in money supply. We found that growth in broad money positively affects the stock market performance through the interest rate channel. Interest rate and inflation recorded negative effects on stock market performance indices. We also found that changes in monetary policy are highly significant in stock market performance in the West African market due to the relatively high level financial openness in the countries under consideration.
Keywords:
Broad Money Growth, Inflation, Exchange Rate, S & P Global Equity Index

1. Introduction
The set of policy actions and communications to achieve full employment, price stability and relatively low long-term interest rates are the key targets pursued by most central banks. In the conduct of monetary policy, central banks manage the level of short-term interest rates and influence the accessibility and cost of loanable funds and credit in the economy through changes in money supply. Changes in money supply directly affect short-term interest rates and indirectly influence long-term interest rates, exchange rates, stock prices, financial derivatives and other assets. These direct and indirect transmission mechanisms of changes in money supply significantly influence micro and macroeconomic variables such as employment levels, the general price level household consumption business investment and production in all economies.
While there is relatively enough empirical evidence about the monetary transmission mechanism following changes in money supply in developed financial markets; the evidence remains scanty for less developed countries; especially those in Southern Sahara Africa. This study therefore focuses on bridging this gap by testing the presence and effects of monetary transmission mechanism on stock market performance in Africa. The efficacy of monetary policy to effectively influence the real sectors of the economy such as real output through a set of transmission mechanisms is a fundamental belief held by the most economists. However; the success of such policy actions is subject to whether or not monetary policy implementation affects the real economy (Laopodis, 2013). The mechanisms by which monetary policy affects the real economy are by money market instruments and through other asset prices such as stock prices (Mishkin, 2001). Monetary policy actions can propel growth in the real sector of the economy given that, they are well channeled into the economy through all the transmission channels; particularly the interest rate transmission channel, consumption transmission channel, and wealth effect transmission channel (Laopodis, 2013). This is also with the general understanding that monetary policymakers can use their control and command over money market interest rate to effectively affect cost of capital and thereafter, spending on fixed investments, real estate, factory inventories and consumer goods. Such changes should lead to changes in aggregate demand and affect production levels (Bernanke & Gertler, 1995). These sets of objectives have always been the key targets of all economies; both developed and under developed as Onyeiwu (2012) noticed. This perspective of influencing growth in the real sectors of the economy through changes in the monetary aggregates is trumpeted by a set of economists known as the Monetarist. The monetarist views are supported by earlier empirical findings including Friedman and Schwarts (1963) and later by Bernanke and Blinder (1992) who found that changes in money fundamentals in the economy are associated with corresponding changes in the real output of the economy which may last at least two years. There is however less consensus about the degree to which monetary policy can impact the economy; this is because the very empirical research that established that changes in monetary aggregate can influence real output is not loud enough about how such changes metamorphosis into real output. The much needed transmission mechanism is not well established and highly inconclusive. Under the New Keynesian theory framework assumption of non-factor price full flexibility, the monetary policymakers can effectively influence short term interest rate and real output by influencing private sector investment and consumption decisions by means of activating the appropriate policy tools such as open market operation, the monetary policy rate, the reserve ratio.
Ioannidis & Kontonikas (2007) found that changes in monetary policy variables significantly also influenced stock market returns over the period of 1972 to 2002 using data from 13 OECD countries. Their findings gave significant support to the belief that monetary policy mechanism works through the stock. Thorbecke (1997) using US data established positive and significant evidence between stock market returns and expansions in monetary aggregates. Rigobon & Sack (2003) found that a 5% decline (increase) in the S & P 500 index raises the likelihood of a 25 basis point easing (contraction) by about a half; hence monetary policy actions strongly react to stock market movements in the US. Laopodis (2013) also using US data examined the relationship between stock market performance and US monetary policy but found no reliable relationship.
In the face of all the existing empirical evidence and literature discussing the existence of inter-relationships between monetary policy and stock market performance; the evidence is mostly limited to developed economies due to data constraints. This study is therefore focusing on the role of monetary policy in the underdeveloped financial markets of Africa; also taking into account the effects within sub-regional blocks (West Africa, East Africa, North Africa, Southern Africa and Central Africa).
2. Literature Review
This paper relates to the existing literature on how changes in monetary policy (broad money growth) affect asset prices through the monetary transmission mechanism. For example, Bjornland & Leitemo (2009) found that significant interdependence exists between changes in interest rate and the real prices of stocks. The real prices of stocks instantly fall by 7% to 9% as a result of unexpected changes in monetary policy that increases the federal rate by 100 basis points. Therefore a shock in the stock price that increases the real price of stocks by 1% leads to a corresponding increase in interest rate close to a basis point of 4. The analysis of interdependence was conducted using the US monetary policy and the S & P 500 through a structural VAR model. Bernanke & Gertler (2000) concluded that it is desirable for monetary policymakers to be interested in the corresponding inflation due to their actions after a careful analysis of the consequences of the volatility of asset prices for monetary policy management. According to their findings, asset prices are only important or significant by the degree to which they are influenced by expected inflation or disinflation hence policies that directly aim at asset prices often have adverse side effects. Chami et al. (1999) argue that real activities in the economy are affected by inflationary property tax on earnings from stocks and income tax on dividend; hence they find the stock market as a major channel for the transmission mechanism of monetary policy. In comparison, inflation taxes stocks much more than bonds hence households change their expected rate of return accordingly with changes in inflation and firms also adjust to meet the demands of their shareholders by adjusting production. Chatziantoniou et al. (2013) found reverse causality between stock market performance and monetary policy such that the performance of the stock market does not only represents response to changes in monetary policy but also serving as a feedback to policymakers concerning the expectations of the private sector with regards to the future direction of other macroeconomic variables. These findings are based on analysis using data on stock market reaction to shocks in fiscal and monetary policy in three (3) developed economies (US, UK and Germany). Coleman & Agyire-Tettey (2008) use quarterly data from the period 1991 to 2005 through co-integration and VECM model found an adverse relationship between banks lending rate and the performance of the stock market. Their study also established that inflation has a negative effect on the performance of the Ghana stock market; this according to them is effective by a lag period. They, however, concluded that investors gained as a result of the depreciation of the domestic currency through exchange rate losses. Hogan et al. (1982) also examined the degree of efficiency at which the stock market in Australia translates new market information related to interest rates and changes in monetary variables into prices. Their study found a strong and significant linkage between yields on government medium term securities and the returns on equity even though no significant link could be established between shocks in monetary variables and the returns on equity. Elbourne (2008) through an SVAR model investigated the significance of the UK housing market through the monetary transmission mechanism. He found that following a positive 100 basis points temporary changes in domestic interest rates; retail sales drop by less than 0.4% as inflation also declines and real estate prices also decline by 0.75%. Consumption, interest rate and the general price level are increased by shocks in housing prices. His findings also suggest that close to one-seventh of the decline in consumption due to interest rate shock is accounted for by house price movements through a combination of shocks in house prices and interest rate. Fama & Schwert (1977) estimated the degree to which various asset classes served as hedges against anticipated and unanticipated elements of inflation for the period 1953 to 1971 in the US. They found that whilst short-term and log-term government debt instruments served as absolute hedge instruments against anticipated inflation; residential private real estate also served as pure hedge instruments against both anticipated and unanticipated inflation. However, labour income exhibited less short-term linkage in either case. Interestingly however, the returns of common stocks were found to be inversely related to anticipated element of inflation and most likely also to the unanticipated components. Friedman (1988) was of the view that the quantity demanded of real money (measured by M2) to the size of income is positively associated with falling equity prices three (3) quarters prior and inversely associated with the current real price of stocks. This view was formulated using quarterly data from 1961-1986. According to the study, the positive association is a reflection of the wealth effect and the inverse relation indicates the substitution effect; however, the positive effect dominated the inverse relation. In addition, the size of transactions has significant impact on the velocity of M1 but not on the velocity of M2. In a related study, Pierluigi (1995) found that production growth exhibited a weak inverse correlation with inflation and stock market returns, and accounts for less of the correlation variance between the two series either than inflation and innovations in interest rates. Suhaibu et al. (2017) through a VAR model found that monetary policy in 12 African countries positively affects stock market performance; however they did not identify a reverse causality. Bordo & Wheelock (2004) in examining the origins of booms in asset prices and the probable adaptation of monetary policy to normalize boom periods. They, however, found no reliable relation between booms in the stock market and inflation, but established that growth in money and credit above average are typically associated with periods of boom. Ibrahim (2003) also revealed that prices of international equities significantly influenced economic variables and equity prices in Malaysia after evaluating the long-term and dynamic relationships between the equity markets of Japan, US, Malaysia and other macroeconomic variables. In conclusion, he pointed out the need for monetary policymakers to exercise much restrain since their actions can have serious financial instability repercussions. Mishkin (2001) also focused his attention on how changes in monetary aggregates affect the economy beyond the usual interest rate transmission medium. The study found that; bad economic results are likely to occur when central bank’s target asset prices in the implementation of monetary policy despite the significance of asset prices in the monetary transmission mechanism. Ioannidis & Kontonikas (2007) in their study of how monetary policy affects stock returns from 1972 to 2002 in thirteen (13) OECD countries found that shifts in monetary significantly impacted returns on stocks, hence endorsing the view of transmission mechanism through the stock market.
3. Methodology
The methodology deployed by this study involves a panel data random effect model to establish the efficacy of monetary policy on the performance of stock markets in African countries with sub-regional considerations. The study also adopted vector error correction model (VECM) to establish the short and long-run causalities respectively after conducting the preliminary test of unit root, lag selection and co-integration.
Model specification for the Pooled OLS and Random effect model
where,
S_Pis the Standards and Poors (S & P) global equity index as the main dependent variable and for the explanatory variables are:
BMG is broad money growth.
R_Int is the annual real interest rate.
Infl is the annual inflation rate.
Exch is the official annual exchange rate to the US dollars.
Cbol is the total credit by commercial banks and other lenders in the economy.
Lgmkt as the log of annual stock market capitalization in US dollars.
LgStock as the log of annual stock market turnover in US dollars.
Also serving as dependent variables are 1) annual stock market trade value and 2) stock market capitalization.
Data Size and Source
The data set for this analysis is panel data constituted from annual series derived from the World Bank database and official central bank website of the countries under consideration from the year 1993 to the year 2019.
Pooled regression model
(1)
where ε is assumed to be independently and identically distributed across samples. j and n, where and is the group and observation identification within each group, respectively. For estimation, it is possible to ignore the unobserved group-level effect, and consider the unobserved heterogeneity simply as a part of the residual.
Because μj is part of the true data generating process of yjn but is ignored in estimation, the pooled regression may suffer from omitted variable bias. By presenting such that z is the set of J − 1 variables for group members and γ is the vector of effects measuring how group-membership affects yjn, then,
Where measures the omitted variable bias
The pooled regression estimates will be biased except;
Another challenge posed by the pooled regression estimate is the problem heteroskedasticity since the error terms are not distributed with the same variance across samples hence the estimates are biased and are inefficient.
In effect, the pooled OLS estimator may end up generating standard errors that are too small or too large for within and between cluster independent variables.
where
(2)
where .
Random effect model
If then the pooled estimator is not biased since the omitted variable bias is zero, but the only problem is the presence of heteroskedasticity in the residuals. Hence to overcome the problem of heteroskedasticity the random effect (RE) estimator is adopted under the assumption that μj has a zero mean and is distributed normally.
(3)
where .
Unit root test results
Presented in Table 1 are the results of the unit root test of the variables. The result indicates that only exchange rate (EXCH) and commercial banks and other lenders (CBOL) are not stationary at level but stationary at their first difference.
Report of summary statistics of the variables
Descriptive Statistics
Table 2 is the descriptive analysis of the variables. Reported in columns (3) and (4) are the means and standard deviations. The table shows that the values of the standard deviations as presented in column (4); the key dependent variables (Logstock, SP and Lgmkt) show very high dispersion from their average. However, the independent variables (Bmg, Infl, Exch, Cbol and R_Int) are stable around their mean values.
The maximum number of observations is 271 as reported in column two for R_Int, however all the other variables (Lgstock, S_P, Lgmkt, Bmg, Infl, Exch, Cbol) fall short due missing values at the beginning and end of some years for some countries.
Pairwise correlations
Table 3 is a summary of the pairwise correlation matrix between the variables

Table 1. Panel unit root test (Levin, Lin & Chu test).
*Indicates the variable is not statistically significant at level.
Table 2. Summary statistics of the variables.
Table 3. Pairwise correlation matrix of the variables.
*Shows significance at the 0.05 level.
at 5% significance level. From Table 3 above, most of the variables are statistically significant at 5% and weakly correlated.
4. Regression Results
Table 4 below presents the main random effect results for the sample using three (3) different measures of stock market performance; namely, stock market turnover (Lgstock), stock market capitalization (Lgmkt) and S & P equity performance index.
The results from Table 4 indicate that growth in broad money has a positive and significant effect on stock market turnover and S & P global equity index at 5% and 10% respectively. This finding is also consistent with the results of Suhaibu et al. (2017) who found that monetary policy positively affects stock market performance in twelve (12) African countries using structural VAR model. We also found that inflation negatively impacts stock market performance variables of market capitalization and S & P index. This result is also consistent with the findings of Coleman & Agyire-Tettey (2008) that inflation negatively affects stock market performance in Ghana.
Sub-regional results
Table 5 below reports the performance for monetary policy (growth in broad money) on stock market performance based on regional groupings of the countries under consideration (West Africa, East Africa, Northern Africa and Southern Africa).
From the results in Table 5 reported, we found a positive and significant
Table 4. Regression results.
Standard errors are in parenthesis; ***p < 0.01, **p < 0.05, *p < 0.1.
Table 5. Regression results.
Standard errors are in parenthesis; ***p < 0.01, **p < 0.05, *p < 0.1.
relationship between growth in broad money and stock market performance in West African markets. We also found a strong and negative relationship between real interest rate and stock market performance in the West African markets. These findings in the West African sub-regional markets are consistent with the findings of Ioannidis & Kontonikas (2007) who found that changes in monetary policy variables significantly influenced stock market returns over the period of 1972 to 2002 using data from 13 OECD countries and Thorbecke (1997) also found a positive and significant evidence between stock market returns and expansions in monetary aggregates using US data. These findings give significant support to the belief that monetary policy mechanism works through the stock. However, the study failed to establish a significant effect of inflation on S & P global equity index in all the other sub-regional markets even though negative coefficients are recorded.
Lag Order Selection
Table 6 below is the lag order selection for the vector error correction model. Based on the Akaike Information Criteria (AIC) a maximum lag of 3 is selected.
Table 6. Lag order selection criteria.
*indicates lag order selected by the criterion.
Test for Co-integration among the variables
Co-integration test is conducted to establish the existence of long-run relationship among the variables. This will also inform the study on the choice of model between the VAR or VECM.
Table 7(a) and Table 7(b) below report the results of the co-integration test indicating at most 4 co-integrating equations from both the Trace statistic and Max-Eigen statistics at 5% significance level. The VECM model is therefore employed in the section of the study.
(a)Trace test indicates 4 cointegrating eqn(s) at the 0.05 level; *denotes rejection of the hypothesis at the 0.05 level.
(b)Max-eigenvalue test indicates 4 cointegratingeqn(s) at the 0.05 level; *denotes rejection of the hypothesis at the 0.05 level.
Table 7. (a) Co-integration Results; (b) Cointegration Results.
Vector Error Correction Model Specification
Base on the results from the co-integration test; our variables are found to be co-integrated and hereby specify and estimate the Vector Error Correction Model with a lag of two (2)
Where k − 1 is the lag length.
and are the long-run dynamic coefficients of the model.
represents the speed of adjustment.
is the lagged value of the residuals obtained from the co-integrating regression of the dependent variable on the independent variables.
is the stochastic error term also known as the impulses or innovations.
Results from the VECM model as reported in Table 7 indicate significant effects of growth in broad money on the stock market performance variable (S & P global equity index) in the short run. The result again finds significant and positive effect of growth in broad money on inflation in the short-run. We found that a percentage change in broad money growth (BMG) is accompanied by 1.324924 and 0.462583 rises in the S & P global equity index on the average among these countries at lag 1 and 2 respectively. Interestingly, the study established a negative relationship between the growth in broad money and inflation. This finding is also in sharp contrast of the quantity theory of money (Friedman, 1956), that inflation is everywhere a monetary phenomenon. In addition, we established a significant and negative relationship between inflation our key variable of interest; the S & P global equity index. The result from the VECM finds it that the previous year’s deviation from the long run equilibrium is corrected at a speed of 1.7%. We also confirm the effect of the transmission mechanism of growth in broad through the interest rate channel. Growth in broad money inversely impacts interest rate, hence on interest bearing assets. Such effect shits investment fund to equity through the stock market. And the error correction term is expressed as below:
VECM impulse response function
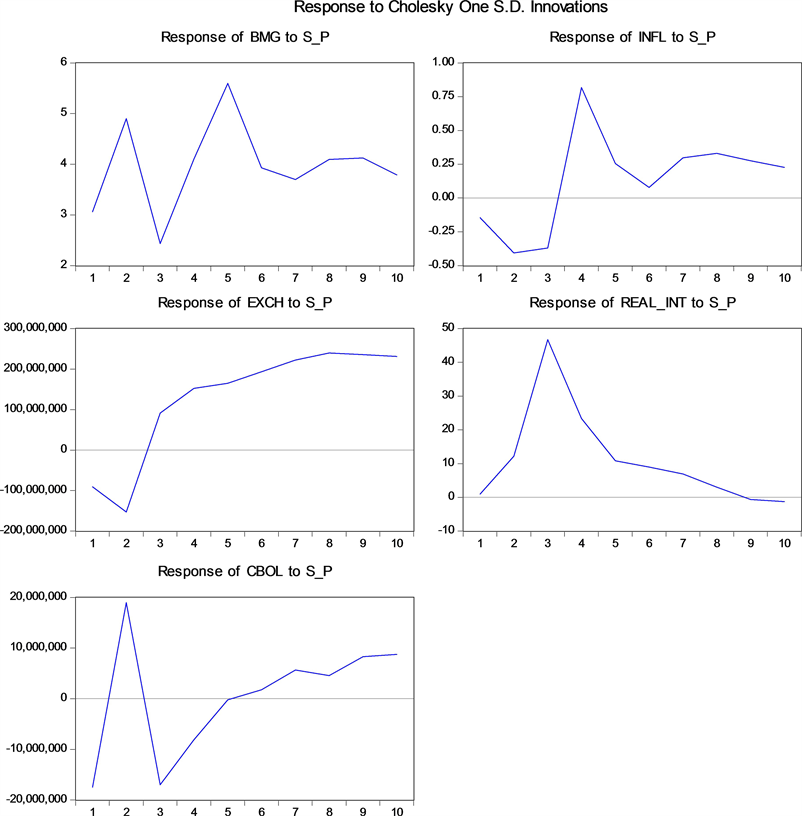
The interpretation of a one standard deviation shock (innovation) to S & P index in Appendix.
1) Response on Broad money growth (BMG): A one standard deviation shock (innovation) to S_P initially causes a very sharp increase on BMG from period 1 to period 2. From the 2nd period, the response falls sharply to period 3 and then bounces to period 4 through to period 5. From period 5, there is another sharp decline to period 6 declines and then rises steadily to period 9 and a decline in period 10. This means that shocks in S_P has moderately positive impact on BMG in the long-run.
2) Response on Inflation (Infl): A one standard deviation shock (innovation) to S_P initially has noticeable impact on Inflation from periods 1 to 2. From the 2nd period, the response sharply rises to the 4th period and falls sharply to period 6 but remains steadily thereafter. This suggests that shocks in S_P have a positive impact on inflation in the short-run and long-run.
3) Response on Interest rate (Int): A one standard deviation shock (innovation) to S_P initially rises sharply from period 1 to 3 and then falls sharply to below the zero line at period 9 and beyond. This is a confirmation that in the long-run growth in money supply will cause decline in interest rate.
4) Response on Exchange rate (Exch): A one standard deviation shock (innovation) to S_P initially has noticeable decline impact on exchange rate from period 1 to period 2. Thereafter it rises steadily to period 10. This means that shocks in S_P will have a positive impact on exchange rate both in the short-run and long-run.
5) Response on Commercial banks and other lenders (Cbol): A one standard deviation shock (innovation) to S_P initially has noticeable impact on commercial banks and other lenders (Cbol) in period 1. It rises significantly to period 2 and thereafter falls significantly in period 3. Beyond the 3rd period, Cbol rises steadily to period 10. This means that shocks in S_P will have a positive impact on Cbol both in the short-run and long-run.
5. Conclusion
The evidence as reported from the random effect model in the main regression and the sub-regional tables lend significant support to the existing literature on monetary transmission mechanism. It also gives further insight to monetary policymakers and capital market regulators about the direction and magnitude of their interventions on the financial markets in their respective countries. Understanding the fundamentals of the African economy and appreciating the imperfections within the financial system due to the fact that they are relatively young, illiquid and logistically constrained; monetary policymakers will be in a better position to implement the right policy tools to achieve the desired results through the monetary transmission mechanism.
The results from the VECM also reveal significant interrelationship between monetary policy and the financial market. Positive changes in money supply have positive impact and stock market performance in the long-run.
Suggestion for Further Studies
It is suggested that further research can be conducted to improve this study by incorporating the debt market indices into the model and consequently assessing how monetary policy affects non-performing commercial bank loans in Africa. It is also suggested individual analysis can be done for specific countries in future studies.
Conflicts of Interest
The authors declare no conflicts of interest regarding the publication of this paper.
Cite this paper
Asiedu, M., Oppong, E. O., & Gulnabat, O. (2020). Effects of Monetary Policy on Stock Market Performance in Africa Evidence from Ten (10) African Countries from 1980 to 2019. Journal of Financial Risk Management, 9, 252-267. https://doi.org/10.4236/jfrm.2020.93014
References
- 1. Bernanke, B. S., & Blinder, A. (1992). The Federal Funds Rate and the Channels of Monetary Transmission. American Economic Review, 82, 901-921. [Paper reference 1]
- 2. Bernanke, B. S., & Gertler, M. (1995). Inside the Black Box: The Credit Channel of Monetary Policy Transmission. Journal of Economic Perspectives, 9, 27-48. https://doi.org/10.1257/jep.9.4.27 [Paper reference 1]
- 3. Bernanke, B. S., & Gertler, M. (2000). Monetary Policy and Asset Price Volatility. Working Paper 7559, Cambridge, MA: National Bureau of Economic Research. https://doi.org/10.3386/w7559 [Paper reference 1]
- 4. Bjornland, H. C., & Leitemo, K. (2009). Identifying the Interdependence between US Monetary Policy and the Stock Market. Journal of Monetary Economics, 56, 275-282. https://doi.org/10.1016/j.jmoneco.2008.12.001 [Paper reference 1]
- 5. Bordo, M. D., & Wheelock, D. C. (2004). Monetary Policy and Asset Prices: A Look Back at Past U.S. Stock Market Booms. Economic Research-Federal Reserve Bank of St. Louis, 86, 19-44. https://doi.org/10.20955/r.86.19-44 [Paper reference 1]
- 6. Chami, R., Cosimano, T. F., & Fullenkamp, C. (1999). The Stock Market Channel of Monetary Policy. IMF Working Paper, Washington DC: International Monetary Fund, WP/99/22. https://doi.org/10.5089/9781451843958.001 [Paper reference 1]
- 7. Chatziantoniou, I., Duffy, D., & Filis, G. (2013). Stock Market Response to Monetary and Fiscal Policy Shocks: Multicountry Evidence. Economic Modeling, 30, 754-769. http://www.elsevier.com/locate/ecmodhttps://doi.org/10.1016/j.econmod.2012.10.005 [Paper reference 1]
- 8. Coleman, A., & Agyire-Tettey, K. F. (2008). Impact of Microeconomic Indicators on Stock Exchange Performance: The Case of the Ghana Stock Exchange. Journal of Risk Finance, 9, 365-378. [Paper reference 2]
- 9. Elbourne, A. (2008). The UK Housing Market and the Monetary Policy Transmission Mechanism: An SVAR Approach. Journal of Housing Economics, 17, 65-87. https://doi.org/10.1016/j.jhe.2007.09.002 [Paper reference 1]
- 10. Fama, E., & Schwert, G. (1977). Asset Returns and Inflation. Journal of Financial Economics, 5, 115-146. [Paper reference 1]
- 11. Friedman, M. (1956). The Quantity Theory of Money: A Restatement. Studies in the Quantity Theory of Money, 5, 3-31. [Paper reference 1]
- 12. Friedman, M. (1988). Money and the Stock Market. Journal of Political Economy, 96, 221-245. https://doi.org/10.1016/0304-405X(77)90014-9 [Paper reference 1]
- 13. Friedman, M., & Schwartz, A. J. (1963). Money and Business Cycles (in Part I: The State of Monetary Economics). The Review of Economics and Statistics, 45, 32-64. https://doi.org/10.2307/1927148 [Paper reference 1]
- 14. Hogan, W. P., Sharpe, I. G., & Volker, P. A. (1982). Capital Market Efficiency and the Relationship between Equity Returns, Interest Rates, and Monetary Aggregates in Australia. Journal of Economics and Business, 34, 377-385. https://doi.org/10.1016/0148-6195(82)90043-1 [Paper reference 1]
- 15. Ibrahim, M. H. (2003). Macroeconomic Forces and Capital Market Integration: A VAR Analysis for Malaysia. Journal of the Asian Pacific Economy, 8, 19-40. https://doi.org/10.1080/1354786032000045228 [Paper reference 1]
- 16. Ioannidis, C., & Kontonikas, A. (2007). The Impact of Monetary Policy on Stock Prices. Journal of Policy Modeling, 30, 33-53. https://doi.org/10.1016/j.jpolmod.2007.06.015 [Paper reference 3]
- 17. Laopodis, N. T. (2013). Monetary Policy and Stock Market Dynamics across Monetary Regimes. Journal of International Money and Finance, 33, 381-406. https://www.elsevier.com/locate/jimf https://doi.org/10.1016/j.jimonfin.2012.09.004 [Paper reference 3]
- 18. Mishkin, F. (2001). The Transmission Mechanism and the Role of Asset Prices in Monetary Policy, Working Paper 8617, Cambridge, MA: National Bureau of Economic Research. https://doi.org/10.3386/w8617 [Paper reference 2]
- 19. Onyeiwu, C. (2012). Monetary Policy and Economic Growth of Nigeria. Journal of Economics and Sustainable Development, 3, 62-70. [Paper reference 1]
- 20. Pierluigi, B. (1995). Stock Returns, Inflation, and the “Proxy Hypothesis”: A New Look at the Data. Economics Letters, 48, 47-53. https://doi.org/10.1162/003355303321675473 [Paper reference 1]
- 21. Rigobon, R., & Sack, B. (2003). Measuring the Response of Monetary Policy to the Stock Market. Quarterly Journal of Economics, 118, 639-669. https://doi.org/10.1162/003355303321675473 [Paper reference 1]
- 22. Suhaibu, I., Harvey, S. K., & Amidu, M. (2017). The Impact of Monetary Policy on Stock Market Performance: Evidence from Twelve (12) African Countries. Research in International Business and Finance, 42, 1372-1382. https://doi.org/10.1016/j.ribaf.2017.07.075 [Paper reference 2]
- 23. Thorbecke, W. (1997). Stock Market Returns and Monetary Policy. Journal of Finance, 52, 635-654. https://doi.org/10.1111/j.1540-6261.1997.tb04816.x [Paper reference 2]
Appendix. Vecm Inpulse Response