B. C. Reed / Natural Science 3 (2011) 323-327
Copyright © 2011 SciRes. OPEN ACCESS
326
2
2
23 15
16
C
Total SSC
S
aZ
UaA aAN
. (14)
With aS = 18 MeV and ao = 1.2 fm, 15aC/16aS ~ 0.0375.
These values are assumed in what follows.
3. PROGRAMS AND RESULTS
Two double-precision FORTRAN programs, ANGLE
and FISSION, have been developed to carry out the cal-
culations described above. Since the geometry of the
process depends only on the emergence angle θ, it is
convenient to have one program (ANGLE) generate a
tabulation of R, d, and S
as functions of θ, and a sec-
ond one (FISSION) carry out the numerical integration
for C
. The programs need only be run once, after
which the run of total energy for any (A, Z) as a function
of θ can be obtained by scaling S
and C
according
as Eq.14. ANGLE is written to step
in increments of
−0.01 radians from π/2 at the start of the process down
to π/6 at the moment of fission.
FISSION has been written to take advantage of the
axial symmetry of the model. The internal and inter-pair
potentials of the N
angular wedges need not be com-
puted for all individual and pairs of wedges since the
internal potentials of all wedges will be identical and the
potentials between all possible pairs of wedges can be
determined by computing the potential between any one
and half of all the others. The equatorial symmetry of the
model was not built into the program in the anticipation
that it might later be used to simulate non-symmetric
fissions. After some experimentation, it was found that
choosing (NZ, NR, N
) = (200, 100, 100) provided for
both reasonably expedient run times and sensible accu-
racy; a complete run requires about 12 hours on a Mac-
intosh G5 and typically returns a starting-configuration
energy accurate to better than 0.1% (see below).
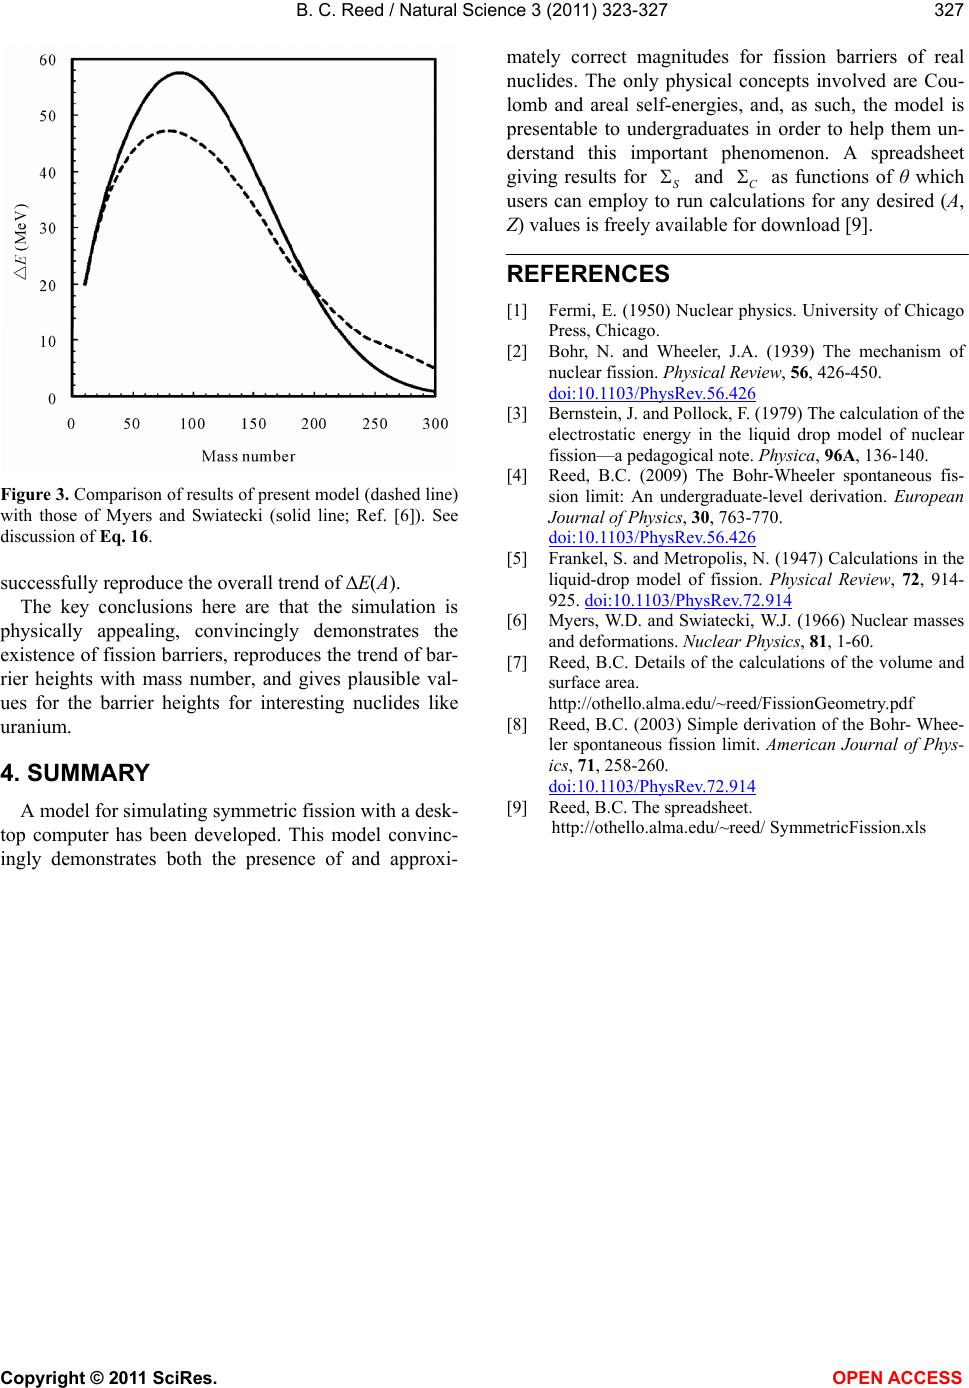
Figure 2 shows results for (A, Z) = (90, 40) and (235,
92), that is, nuclides of zirconium and uranium, respec-
tively. The ordinate is the change in total configuration
energy in the sense (deformed nucleus – original nu-
cleus). Zirconium is used as an example because for real
nuclei, much more sophisticated models, such as that of
Myers and Swiatecki [6], reveal that fission barriers
peak at a value of ~ 55 MeV for nuclei with A ~ 90.
While there is some noise in the simulation due to the
finite number of lattice cells, the computed maximum of
~ 47 MeV for zirconium is in good agreement with this
peak value. For uranium, the computation gives a barrier
of ~ 13 MeV, somewhat high compared to the true value
of ~ 6 MeV but still respectably accurate considering the
simplicity of the model. At the moment of fission, ∆E in
the case of uranium has dropped to about −45 MeV. One
Figure 2. Evolution of (deformed - initial) configuration en-
ergy for nuclides with (A, Z) = (90, 40) (zirconium; upper
curve) and (235, 92) (uranium; lower curve). (aS, aC, ao) =
(0.72 MeV, 18 MeV, 1.2 fm). The limiting value of d/RO is
about 1.3685.
feature to note in Figure 1 is that in the case of uranium
the maximum distortion energy is reached at about the
middle of the fission process, whereas for zirconium the
maximum occurs at very near the end of the process.
The numerical precision achieved with the model can
be judged by examining how well it reproduces the con-
figuration energy for the initial undeformed nucleus.
This can be computed analytically as
2
23
1C
start S
S
aZ
UaA aA
. (15)
For (A, Z) = (235, 92) and (aC, aS) = (0.72 MeV, 18
MeV), this gives Ustart = 1673.0 MeV; the simulation
gives 1673.74 MeV, only 0.04% high.
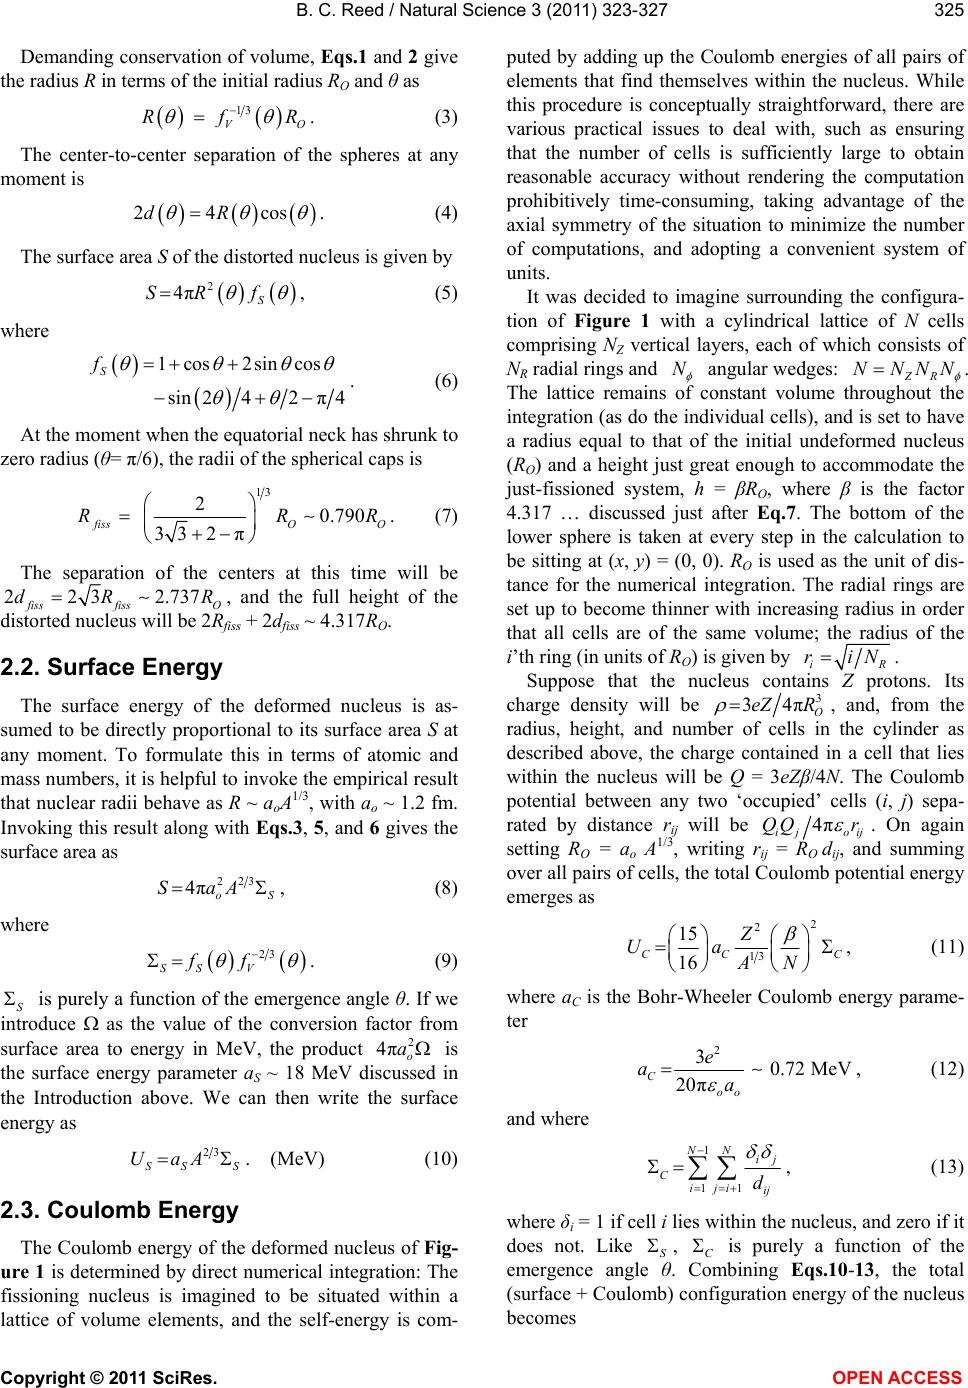
Figure 3 shows how the results of the present model
compare to those Myers and Swiatecki’s seven-parame-
ter model. For the present model, this plot was formed
by computing ∆E(
) for values of A = 10, 15, 20, ···,
300 and searching for the maximum value of ∆E for
each A; the curve is interpolated. In computing these
maximum ∆E values it was assumed that the atomic
number Z for a given value of A could be modeled as Z ~
0.627A0.917 (1 < Z < 98), a purely empirical result based
on the (Z, A) trend of 352 nuclides with half-lives > 100
years [8]. The Myers and Swiatecki curve was generated
by fitting the empirical formula
n
o
AA
p
ECAe
(16)
to Figure 18 of their paper by a least-squares calculation.
The values of the parameters are (C, p, Ao, n) = (5.115
17, 0.592 21, 156.630 3, 2.537 96). This fit predicts a
slightly high peak value for the curve (~ 58 MeV vs. a
true value of ~ 55 MeV), but is convenient for compar-
ing the models. The present model predicts somewhat
high values of
E at both low and high values of A and
somewhat low ones for intermediate values, but it does