R. BORGE ET AL.
OPEN ACCESS
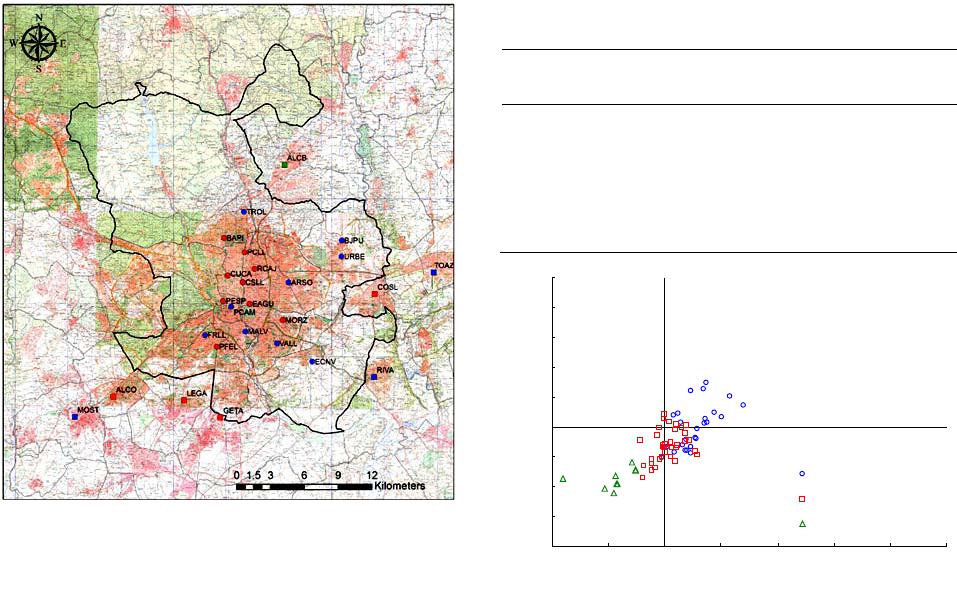
Figure 5.
Expected effect of the Madrid AQP in NO2 concentration. Annual average for year 2007, considered for
the source apportionment study (a) and 2014, temporal horizon of the AQP (b).
served NO2 in Madrid. A similar influence can be attributed to
mobile sources other than road traffic. The contribution of in-
dustry is low in general although it may be important in the
surroundings of the city. According to the source apportion-
ment study performed, the industrial sources in the region are
responsible of 5% and 16% of NO2 levels in the traffic and
urban background stations of the Greater Madrid Region, and
therefore may constitute a sensible target for additional meas-
ures, especially in the east area of the Madrid metropolitan area.
As for the air quality monitoring strategy, the results form
this study indicate that the relative amount of traffic stations,
although high, may be adequate since traffic is mainly respon-
sible for air quality problems in the region. However, further
analysis should be done to understand to what extend this sta-
tions may be providing redundant results (the source appor-
tionment results are very similar in all the stations) and there-
fore the air quality monitoring network may be simplified and
reduced, considering the minimum requirements established in
the Directive 2008/50/EC. On the other hand, the potential need
for some industrial stations in the eastern part of the Madrid
metropolitan area may be considered.
Acknowledgemen ts
The Madrid city Council provided the traffic model and
supported this study. The CMAQ modeling system was made
available by the US EPA and it is supported by the Community
Modeling and Analysis System (CMAS) Center. The authors
also acknowledge the use of emission datasets and monitoring
data from the Spanish and Portuguese Ministries of Environ-
ment as well as air quality monitoring data from the Madrid
city Council and Greater Madrid Region.
REFERENCES
Borge, R., Alexandrov, V., del Vas, J.J., Lumbreras, J., & Rodríguez, E.
(2008a). A comprehensive sensitivity analysis of the WRF model for
air quality applications over the Iberian Peninsula. Atmospheric
Environment, 42, 8560-8574.
http://dx.doi.org/10.1016/j.atmosenv.2008.08.032
Borge, R., de Miguel, I., de la Paz, D., Lumbreras, J., Perez, J., &
Rodríguez, M. E. (2012a). Comparison of road traffic emission mod-
els in Madrid (Spain). Atmospheric Environment, 62, 461-471.
http://dx.doi.org/10.1016/j.atmosenv.2012.08.073
Borge, R., López, J., Lumbreras, J., Narros, A., & Rodríguez, E. (2010).
Influence of boundary conditions on CMAQ simulations over the
Iberian Peninsula. Atmospheric Environment, 44, 2681-2695.
http://dx.doi.org/10.1016/j.atmosenv.2012.08.073
Borge, R., Lumbreras, J., & Rodríguez, M. E. (2008b). Development of
a high-resolution emission inventory for Spain using the SMOKE
modelling system: A case study for the years 2000 and 2010. Envi-
ronmental Modelling & Software, 23, 1026-1044.
http://dx.doi.org/10.1016/j.envsoft.2007.11.002
Borge, R., Lumbreras, J., Pérez, J., de la Paz, D., Vedrenne, M., de
Andrés, J. M., & Rodríguez, M. E. (2014). Emission inventories and
modeling requirements for the development of air quality plans. Ap-
plication to Madrid (Spain). Science of the Total Environment, 466-
467, 809-819.
Borge, R., Lumbreras, J., Pérez, J., de la Paz, D., Vedrenne, M., &
Rodríguez, M. E. (2012b). Emission inventories and modeling activi-
ties for the development of air quality plans in Madrid (Spain). 2012
USEPA International Emission Inventory Conference “Emission In-
ventories—Meeting the Challenges Posed by Emerging Global, Na-
tional, Regional and Local Air Quality Issues”, Tampa, 13-16 Au-
gust 2012.
Byun, D. W., & Ching, J. K. S. (1999). Science algorithms of the EPA
models-3 community multi-scale air quality (CMAQ) modeling sys-
tem. EPA/600/R-99/030, US EPA National Exposure Research
Laboratory, North Carolina.
Byun, D. W., & Schere, K. L. (2006). Review of the governing equations,
computational algorithms, and other components of the models-3
community multiscale air quality (CMAQ) modeling system. Applied
Mechanics Reviews, 59, 51-77. http://dx.doi.org/10.1115/1.2128636
Carmichael, G., & Wild, O. (2010) Global and regional modelling. In:
Hemispheric Transport of Air Pollution. Task Force on Hemispheric
Transport of Air Pollution.
Cohan, D. S., Hakami, A., Hu, Y., & Russell, A. G. (2005). Nonlinear
response of ozone to emissions: Source apportionment and sensitivi-
ty analysis. Environmental Science & Technology, 39, 6739-6748.
http://dx.doi.org/10.1021/es048664m
Denby, B., Douros, I., & Fragkou, L. (2011). Modelling of nitrogen
dioxide (NO2) for air quality assessment and planning relevant to the
european air quality directive. Forum for Air Quality Modelling in
Europe (FAIRMODE) Guidance Document.
European Environment Agency (EEA) (2013). Air quality in Europe—
2013 report. EEA Report No 9/2013.
Guerreiro, C., Horálek, J., de Leeuw, F., Hak, C., Nagl, C., Kurfürst, P.,
& Ostatnicka, J. (2010). Status and trends of NO2 ambient concentra-
tions in Europe. ETC/ACC Technical Paper 19/2010.
Institute for the Environment. SMOKE v2.7 User’s Manual (2009).
University of North Carolina, Chapel Hill.