Journal of Environmental Protection
Vol. 3 No. 3 (2012) , Article ID: 17940 , 10 pages DOI:10.4236/jep.2012.33033
Health Effects of Climate and Air Pollution in Buenos Aires: A First Time Series Analysis*
![]()
1Universidad Nacional de San Martín, Buenos Aires, Argentina; 2Comisión Nacional de Energía Atómica, Buenos Aires, Argentina; 3Centro Nacional del Medioambiente, Santiago, Chile; 4Universidad del Desarrollo, Santiago, Chile; 5National Centre for Atmospheric Research, Boulder, Colorado, USA.
Email: #dawidows@cnea.gov.ar
Received December 16th, 2011; revised January 14th, 2012; accepted February 16th, 2012
Keywords: health; air pollution; climate variability; carbon monoxide; epidemiology
ABSTRACT
Background: The impact of urban air pollution and temperature changes over health is a growing concern for epidemiologists all over the world and particularly for developing countries where fewer studies have been performed. Aim: The main goal of this paper is to analyze the short term effects of changes in temperature and atmospheric carbon monoxide on daily mortality in Buenos Aires, Argentina. Methods: We conducted a time series study focused on three age groups, gender, and cardiovascular and respiratory mortality, with lags up to four days and temporal variables as modifiers. Results: Temperature correlates positively with total mortality for summer months, with a RR = 1.0184 (95%, CI 1.0139, 1.0229) on the same day for each 1˚C increase. In winter this relationship reverses, as 1˚C temperature increase exhibit a protective effect with a RR = 0.9894 (95%, CI 0.9864, 0.9924) at the 3 day lag. Carbon monoxide correlates always positively with mortality, with a RR = 1.0369 (95%, CI 1.0206, 1.0534) for each 1 ppm increase, on the previous day. Conclusions: Climate and pollution parameters measured in Buenos Aires City exhibit a correlation with health outcomes. The impacts of temperature and carbon monoxide vary with age and gender, being elderly the most susceptible subgroup. One day after an increase in CO of 1 ppm, about 4% extra deaths can be expected. The correlation found between increases in CO and mortality for greater lags may be ascribed to the role of CO as a chemical marker of urban air pollution, indicating the co-presence of other pollutants.
1. Introduction
The link between extreme temperatures and air pollution episodes and health is well documented, particularly for extreme episodes [1,2]. However, during the last decades, there has been a growing interest in the chronic or even acute effects of even low levels of air pollution and small changes in temperatures in morbidity and mortality [3-5]. Urban populations’ exposure to particulate matter and to ozone, as well as to nitrogen oxides, carbon monoxide, lead and other metals, has negative impacts on human health, even at levels lower than those established as secure by international standards [6-11].
The cardiovascular system is the most compromised in the thermal regulation of the human body, while the respiratory system is the first one to receive air pollutants into the body [12]. This means that susceptible individuals with chronic pathologies, extreme ages, or metabolic changes due to prescription drug use, are more vulnerable to environmental changes [13,14].
The reviewed literature agrees that temperature constitutes an important factor in explaining mortality values, even in template urban areas [5]. Cold temperatures produce an important cumulative effect that is lagged in time with a lag of up to two weeks after the climatic event, while high temperatures increase mortality for a much shorter period, generally limited to the same day or the following [5,15-17].
At the same time, respiratory caused mortality presents larger lags (between 3 and 6 days) while cardiovascular caused deaths occur between the same day of the climatic event and the two following days [18]. This is coherent with the underlying biological mechanisms of disease.
Existing scholarship emphasizes the importance of considering the characteristics of the analyzed region. Even when some generalizations can be established from comparative studies (through typifying cold and hot settlements, for example), the climatic peculiarities of each location result in different health outcomes [16].
Finally, [5] highlight the complexity of such determinants of the relationship between temperatures and mortality as the socioeconomic characteristics of the populations. This is especially important in urban centres of developing countries, but very few papers analyze this issue for Latin American cities. References [18,19] performed time series analysis for the cities of Santiago (Chile) and Sao Paulo (Brazil). Specifically in Argentina there are few studies with different approaches. Reference [20] performed synoptic analysis for hospital emergency consults in Buenos Aires City, while [21] used the same methodology to analyze asthmatic patients in the city of Rosario. Reference [22] described a strong relationship between meteorological variables and health outcomes as cardiovascular hospitalizations and emergency consultations for asthma, in Bahía Blanca.
In this work we explore the correlation between temperature and air pollution with mortality for the City of Buenos Aires, thought a temporal series study. To the best of our knowledge this is the first Time Series study performed at the mega city’s level.
2. Materials and Methods
2.1. The City of Buenos Aires
Buenos Aires lies in the Pampa region, on the western shore of the estuary of the Río de la Plata. It has a warm and humid climate (See Table 1). Summer days and nights are hot, while cold days and colder nights prevail in winter, when minimum, average and maximum temperatures drop about 10˚ from their summer values. Autumn and spring present transitional weather characteristics, determined by mild temperatures during the days and colder during the nights. The river’s proximity and its longitudinal location make Buenos Aires a city with few extreme temperature episodes.
The metropolitan area of Buenos Aires (MABA) is composed of the city of Buenos Aires, the Federal District or capital of the country, and 24 surrounding districts that are part of the province of Buenos Aires. Being the 10th megalopolis in the world and the 3rd in Latin America, it concentrates 32% of the total population in only 0.14% of the national territory. The city itself comprises only the 7% of the total MABA area, yet it concentrates about 25% of its population, the highest of the country. Even when considering the megacity as a whole would be the best approach, as MABA constitutes a unique atmospheric basin, the administrative fragmentation between local authorities imposes difficulties regarding availability of the data needed to perform a time series analysis. For this reason we only included data on the city.
Although Buenos Aires differs slightly from the whole country in demographic terms (e.g., its gender composition is similar to national one, with a low predominance of females (55%), a very important difference of relevance for public health is given by the age composition of its population in two ways 1) The percentage of elderly people (64 and more) is significantly higher at the city level (17%) than at the national level (10%); 2) And infants (under 15 years) make only 17% of the total city population, being almost 30% of the national population. For this, factors that affect the health of elderly, as air pollution, grow in importance.
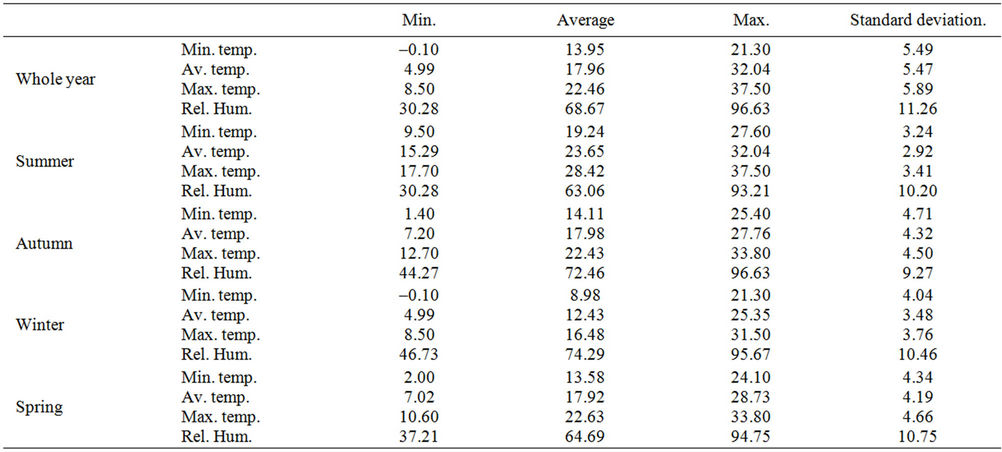
Table 1. Descriptive statistics for temperature and humidity in Buenos Aires City, 2002-2006.
2.2. Data
Daily maximum, minimum and average temperatures were obtained using hourly data from the Villa Ortúzar meteorological station, National Weather Service (NWS). Dew point data was used to calculate hourly relative humidity applying Iribarne and Godson expressions (1981) [23]. Seasonal analysis was conducted, following the parameters used by the NWS, which defines seasons by the frequent presence of climatic conditions (NWS 2010) [24] as follows: summer from December to February; autumn from March to May; winter from June to August and spring from September to November.
Air quality data series are scarce in Buenos Aires. There has been only one monitoring station working for the last two decades, and three more stations have been recently installed by the City Government. However, studies carried by the scientific sector [25,26] allow us to establish that carbon monoxide (CO), sulphur dioxide (SO2) and Particulate Matter 10 (PM10) levels are usually below the international standards [27,28]; while nitrogen oxides (NOx) and Particulate Matter 2.5 (PM2.5) show exceedance of international standards. Unfortunately O3 has not been systematically measured in the city of Buenos Aires.
Air quality data was provided by Buenos Aires City Government for the only monitoring station with historical data, located in a densely populated neighborhood of the city. Only carbon monoxide (CO) data cover a series of daily averages long enough to perform a time series analysis. The longest trustable set of continuous data ran from Feb. 5th 2003 to Nov. 30th 2004, which was then chosen as the study period. The series had 5.26% missing registers, grouped into two relatively long periods and some isolated data. Specifically, the series has 21 missing data that were substituted through a regression approach.
A series with 24 hour average daily values ranging from 0 to 4.3 ppm was constructed to run the air quality analysis.
Mortality data are provided by the National Health Ministry’s Statistics Direction. Original databases were well organized and complete. Data is classified by the International Classification of Diseases and Related Health Problems (ICD-10). 2712 registers were obtained for the period of 2002-2006. QC checks of the data were performed and 4.32% incomplete or wrong entries and were discarded. Accidental deaths were also eliminated and from the resulting database the count of deaths due to cardiovascular (I00-I99) and respiratory (J00-J98) diseases was extracted. Buenos Aires City has an average of about 86 daily deaths (see Table 2), of which about 33% are due to cardiovascular causes and 23% are due to respiratory causes.
Interestingly, despite of its template climate and its relatively short temperature range between seasons, Buenos Aires City mortality rates peak during the winter months, most likely associated with seasonal illness outbreaks (Figure 1).

Table 2. Daily average mortality variables for Buenos Aires City, 2002-2006.

Figure 1. Maximum, average and minimum temperture and mortality values, 2002-2006.
2.3. Methods
Most of the air pollution epidemiological studies use ecological time series, case cross-over, panel and cohort studies to explore the relationship between temperature and air pollution and health [29,30]. Each of these designs has advantages and disadvantages. In our case a Temporal Series design was chosen, because is best suited for estimating the acute health effects of pollution and meteorological determinants and has the advantage of its simplicity, that allows to extract the confounding factors (seasonality, temporality and weather), and delivering results that allow for comparisons with a other cities.
Temporal Series studies imply a regression analysis between temporal variables (generally air pollution, temperatures, humidity, atmospheric pressure) taken as independent, and health outcomes as dependent variables [31]. Generally, a minimum squares method is used to build the prediction equation through generalized additive models, which allow incorporating control variables or confounders. Depending on the design and the data distribution, other non linear or non additive models can be used.
The reviewed literature applies control variables to identify possible artificial associations between mortality and temperatures, which are used in the analysis of air pollution effects. References [4,16] use barometric pressure, log trend run and weekday as control variables. Reference [32] use weekdays and atmospheric pollution. Reference [33] develops a time series analysis, considering the wind velocity as a control variable. Reference [34] study the impact of ozone levels over mortality incorporating cloud cover, and [15] add cultural schemes, air conditioning availability, and urban planning as factors that modify climate variables over mortality effective values. Other variables related with individual habits, like eating, smoking, activities, exercise patterns, may have a relevant influence at the individual level, but they are expected to stay relatively stable at a population level during the study period. In this study, we controlled by weekday and month, and long time trend, and used four separate databases for each season of the year.
Temperature is a complex variable, which usually correlates in an U shape with health outcomes [32], meaning that if temperatures are low (either in cold climates or in winter season), their increase has a protective impact over health, while in hot climates or summer seasons an increment in temperatures may have an adverse impact on health. Keeping this in mind, as well as the warm climate in Buenos Aires, our analysis was run for four separate seasons of the year.
Following the APHEA (Air Pollution and Health: A European Approach) and EMACAM (Estudio Multicéntrico Español sobre la Relación entre la Contaminación Atmosférica y la mortalidad) approach, our analysis model was built progressively in three steps. First the relationship between weekday and monthly confounders and health outcomes was established for each of the analyzed groups. Weekdays and months showing a correlation with health outcomes were selected and included in a second analysis correlating mortality with maximum, minimum temperature and relative humidity. Then a model correlating air pollution (carbon monoxide) and mortality was constructed, considering the relationship with temperatures and humidity as non linear. Each of the second and third steps was run to get the correlation with the same day variables and with those of a 4 days lag.
The models were run for the whole total, cardiovascular and respiratory deaths as well as for 6 subgroups: male/female and three age-groups (0 to 14 years old, 15 to 64 and 65 and older).
A General Additive Model (GAM) was run for each of the groups for each season of the year (Dominici et al., 2006) [35]. For the air pollution analysis, a model was run also for the year as a whole. Even if seasonal variations in the correlations existed, due to the size of the data, the whole set of the records was used to allow for statistically significant results.
The models were run in the R software [36], using a Quasi Poisson regression [37], as the data was over disperse (Table 2). We built a model following the standardized formula for temperature and air pollution time series [38]:
 (1)
(1)
where Y is the daily mortality count, E(Y) is the expected value of death count, β0 is the intercept, β1 is the estimator, X1 is the covariate, and Si is the smooth function. β1 describes the increase in mortality per unit increase in temperature or air pollution level.
The residuals of the regression were analyzed to establish the adjustment of the selected model.
3. Results
The results are presented in terms of Risk Ratio (RR), defined as the difference between death cases of both people who have been exposed and non exposed to the risk factor (increase or decrease in temperature and presence of CO in the air), with the formulae
 (2)
(2)
3.1. Temperature
The analysis shows a consistent relationship between temperature and mortality, for all mortality types (Figures 2, 3 and 4). This association is stronger and more significant during the summer and winter, and weaker during the autumn and spring. Nevertheless, some effects of daily temperature changes over mortality were found even for these transition seasons. Cardiovascular mortality was, for all seasons and groups, more strongly correlated to temperature changes than respiratory mortality.
For almost all the lags, average temperature shows a stronger influence than minimum or maximum temperatures. Therefore the presentation of results will focus on average temperature values. Humidity shows a weak correlation with mortality values, only significant for the 2 day lag in winter and summer. For those seasons the correlation is negative, meaning that an increase of the relative humidity corresponds with a decrease in mortality, both total and discriminating between causes of death.
3.1.1. Summer
Temperature exhibits positive and direct correlation with mortality. For total mortality, a 1˚C increase in average temperature is linked with a RR of 1.0184 (95%, CI 1.0139, 1.0229), indicating that with a 1˚C increase in temperature, total count of deaths of the day will increase in 1.8% (95%, CI 1.3 to 2.3). A consistent relationship was found for the first 3 days. The strongest impact appears on the same day and the slope diminishes as days pass (Figure 2). This is consistent with the underlying biological mechanisms leading to dead by heat and also with the results of other studies undertaken for other cities [3,5]. The statistical significance of the correlation also weakens with increased day lags.
The impact of temperature is stronger for females than for males (RR = 1.0216, 95%, CI 1.0156, 1.027552 and RR = 1.0135, 95%, CI 1.0076, 1.0195 respectively). The elderly are another sensitive group for summer (RR = 1.0209, 95%, CI 1.0160, 1.0259).
Figure 3 shows that cardiovascular caused deaths have a heavy weight in the correlation, with a RR = 1.020 (95%, CI 1.012, 1.028) integrated mainly for the impact over women (RR = 1.027, 95%, CI 1.017, 1.037) and elderly (RR = 1.022, 95%, CI 1.013, 1.030).
Respiratory caused mortality during summer presents lower correlations, but strong enough to be considered (Figure 4). The relationship is consistent through days, and again women and elderly are particularly affected. (RR = 1.020, 95%, CI 1.007, 1.032 and RR = 1.021, 95%, CI 1.011, 1.031 respectively). On the following day (lag 1) the slope is slightly lower and the correlation gets stronger, weakening again at a 2 day lag.
3.1.2. Winter
As expected, during the winter temperature increases have a protective effect over human health. There is a lag between the temperature change and the observable deaths (Figure 2). Temperature does not have a strong impact over the same day death count, and the strongest protective impact of temperature increase is seen in a 3 and 4 days lag. Again, for the winter season there is a strong correlation between temperature and cardiovascular mortality.

Figure 2. Risk Ratio for 1˚C average temperature increase, by season: Total mortality.>Error bars: upper and lower dots represent 95% CIs. The solid horizontal line indicates RR = 1.

Figure 3. Risk Ratio for 1˚C average temperature increase, by season: Cardio vascular mortality.>Error bars: upper and lower dots represent 95% CIs. The solid horizontal line indicates RR = 1.

Figure 4. Risk Ratio for 1˚C average temperature increase, by season: Respiratory mortality.>Error bars: upper and lower dots represent 95% CIs. The solid horizontal line indicates RR = 1.
Figure 4. Risk Ratio for 1˚C average temperature increase, by season: Respiratory mortality.
For total mortality, a 1˚C increase in temperature has a protective effect with a RR = 0.9894 (95%, CI 0.9864, 0.9924) at the 3 day lag. Males and the elderly are the most protected groups (RR = 0.9899, 95%, CI 0.9857, 0.9941 and RR = 0.9881, 95%, CI 0.9848, 0.9914). For females, RR = 0.9889, (95%, CI 0.9850, 0.9928).
The same tendency is seen when analyzing cardiovascular mortality: RR = 0.9833, 95%, CI 0.9781, 0.9884; RR = 0.9815, 95%, CI 0.9743, 0.9887; RR = 0.9845, 95%, CI 0.9774, 0.9916 y RR = 0.9831, 95%, CI 0.9776, 0.9887 for total cardiovascular, males, females and elderly at a 3 day lag. The decrease in cardiovascular mortality related to the winter temperature increase affects also the adult (15 to 64 years old) group (RR = 0.9831, 95%, CI 0.9706, 0.9957).
The temperature relationship with respiratory mortality is slightly lower, but still significant at a 2 days lag, getting its maximum strength at the 4 day lag (Figure 4). A 1˚C average temperature increase correlates with a decrease of total respiratory mortality, and of elderly respiratory mortality (RR = 0.9896, 95%, CI 0.9839, 0.9954, RR 0.9892, 95%, CI 0.9831, 0.9954 respectively), but also with males and females, being the former the most vulnerable group (RR = 0.9861, 95%, CI 0.9772, 0.9950 and RR 0.9921, 95%, CI 0.9851, 0.9992).
3.1.3. Spring and Autumn
These are transition seasons regarding temperature and humidity in Buenos Aires. Therefore a weaker correlation between meteorological and mortality variables is expected. Regarding the variables of interest of this study, both seasons present similar characteristics to those of winter months, as on one hand mortality correlates inversely with temperature and on the other, effects are best seen on a variable lag, longer than for summer months. The exception to this is the autumn mortality of the same day of a temperature increase (lag 0), in which an increase of mortality occurs. In autumn, a temperature increase of 1 Celsius centigrade is associated with a respiratory mortality of RR 1.0136 (95%, CI 1.0059, 1.0123), particularly for the elderly (RR = 1.0139, 95%, CI 1.0055, 1.0224) on the same day of the exposure.
Autumn’s correlation between temperature and mortality presents a RR = 0.9921 (95%, CI 0.9889, 0.9952), composed mainly by the 64 years and older group (RR = 0.9917, 95%, CI 0.9883, 0.9952), while males and females present a better correlation at 2 day lag (RR = 0.9907, 95%, CI 0.9862, 0.9952 y 0.9947, 95%, CI 0.9906, 0.9988 respectively). Cardiovascular death causes correlate their best at the 3 day lag for all the analyzed groups, being the males the most benefited group (RR = 0.9857, 95%, CI 0.9794, 0.9920).
In spring the biggest effect is seen at the 3 day lag for total and cardiovascular mortality, while respiratory mortality correlates better with the 2 previous day’s temperature (Figures 2, 3 and 4).
Finally, relative humidity acts as a respiratory mortality risk factor for people 14 years and younger at a 3 day lag. This effect could be caused by a viral situation not considered in this study.
3.2. Carbon Monoxide
Figures 5 to 7 show RR results for the whole corpus of data as well as for seasonal analysis. A strong and positive association was found between CO and mortality, for the same and for the next day. As can be seen in Figure 5, 1 ppm CO increase presents a RR = 1.01868 (95%, CI 1.0021, 1.0355 and RR = 1.0369 (95%, CI 1.0206, 1.0534) respectively, being this last association statistically stronger.
The same day increase in mortality is evident in males (RR = 1.0265, 95%, CI 1.0040, 1.0495), while for the two following days (lag 1 and 2) a statistically significant correlation is found for females (RR = 1.0299, 95%, CI 1.0081, 1.0522 and RR = 1.0267, 95%, CI 1.0058, 1.0479). For the following day, even when the statistical significance is stronger for women than for men (p = 0.001, vs. p = 0.01), RR is practically the same for both groups (RR = 1.029, 95%, CI 1.00, 1.05).
Focusing on age groups, the most affected are adults between 15 and 64 years old, for the same and following day (RR = 1.0355, 95% CI 1.0173, 1.0541). For elderly the greater impact is seen at the three following days (lags 1, 2 & 3), with a RR = 1.0355, 95% (CI 1.0173, 1.0541), RR = 1.0162, 95% (CI 0.9984, 1.0343) and RR = 1.0162, 95% (CI 0.9985, 1.0342) respectively. The values obtained for the age group 0 to 14 years old do not allow to make conclusions, due to the low number of cases in this group.
Cardiovascular mortality correlates weakly with CO for lags 1 and 2, being RR = 1.0247, 95%, CI 0.9966, 1.0536 and RR = 1.0238, 95%, CI 0.9962, 1.0523 (Figure 6). This situation is driven by an increasing in female

Figure 5. Risk Ratio for 1 ppm CO level increase, by season and year: Total mortality.Error bars: upper and lower dots represent 95% CIs. The solid horizontal line indicates RR = 1.

Figure 6. Risk Ratio for 1 ppm CO level increase, by season and year: Cardio vascular mortality.Error bars: upper and lower dots represent 95% CIs. The solid horizontal line indicates RR = 1.

Figure 7. Risk Ratio for 1 ppm CO level increase, by season and year: Respiratory mortality.Error bars: upper and lower dots represent 95% CIs. The solid horizontal line indicates RR = 1.
mortality (1.0341, 95%, CI 0.9966, 1.0729 and RR = 1.0645, 95%, CI 1.0283, 1.1021, with a very statistically strong significance for this last value (p < 0.001). The association weakens at a 3 day lag, but re appears at a 4 day lag with a relatively high correlation, RR = 1.0552, 95%, CI 1.0195, 1.0921 and p = 0.01. Similar is the case for the 64 and older group, with a lightly weaker association and less pronounced association (RR = 1.0291, 95%, CI 0.9985, 1.0606; RR = 1.0314, 95% CI 1.0011, 1.0627 & RR = 1.0278, 95%, CI 0.9976, 1.0590 for lags 1, 2 & 4). Male cardiovascular mortality only correlates with CO levels for the same day (RR = 1.0386, 95%, CI 0.9984, 1.0804). Based on the well known quick effect of carbon monoxide over the cardiovascular system, the values obtained suggest that deaths in Buenos Aires may be not only influenced by CO increases, but also by the presence of other air pollutants that were not possible to consider in this study because of the lack of complete and consistent series of measured data. This result is consistent with other study [39] that indicates the strong correlation between CO and fine particulate matter concentrations in the atmosphere of Buenos Aires during autumn and winter periods.
In general terms the association between CO and respiratory mortality is limited, presenting values with significance only for the same day.
The impact of air pollution on mortality may fluctuate depending on atmospheric conditions as well as other variables like indoors spent time, activity patterns, etc, that may convey to heterogeneous exposition patterns, that usually present a seasonal behaviour. To account for this, in addition to the GAM model already developed, a seasonal analysis has been conducted.
Seasonal analysis shows that in Buenos Aires the stronger correlation between CO concentration and mortality occurs during winter, and less during spring. During summer and autumn no consistent relationship was found. For winter months we found a positive correlation between CO levels and total mortality for the day following the increasing (RR = 1.0328, 95%, CI 1.0073, 1.0590). Males and elderly are the most affected groups (RR = 1.0404, 95%, CI 1.0047, 1.0774 and RR = 1.0303, 95%, CI 1.0013, 1.0601 respectively). The association is lost at lag 2 days, but reappears at the 3 day lag practically with the same values and the same statistic strength, remaining for lag 4 with lower RR value. Lag 4 correlation disappears for males and elderly. At the same time, limited correlation between CO level and total and male cardiovascular mortality can be found (RR = 1.0443, 95%, CI 0.9956, 1.0954 and RR = 1.0557, 95%, CI 0.9907, 1.1250 respectively).
Spring months show the most plausible biological association as values of mortality because of cardiovascular causes correlate with the days closest to the increases in CO. On the same day of the CO increases, we found an increase in cardiovascular and respiratory female mortality (RR = 1.0885, 95% CI 1.0065, 1.1771 and RR = 1.0864, 95% CI 0.9972, 1.1836 respectively), as well as the respiratory mortality for the adults (between 15 and 64 years old) group (RR = 1.3310, 95% CI 1.0796, 1.6409). Lags 1 and 2 days present correlation for total and cardiovascular deaths; being women and elderly the most affected groups. Likewise, at lag 1 we found an increase in adults respiratory caused deaths (RR = 1.2502, 95% CI 1.0137, 1.5419), which moves to the elderly group at lag 2 (RR = 1.1095, 95% CI 1.0296, 1.1955). The following days CO values do not present correlation with any causes of death.
4. Discussion
Of all weather parameters studied, average temperature exhibits a stronger correlation with mortality outcomes. The aggregated analysis of the results shows that the larger concern in connection with climate is related with the high temperatures during summer. Regarding air pollution effects the matter of consideration is the CO presence during the whole year and particularly in winter and spring, during the following days that pollutant high concentration was detected (Figure 8).
Females and elderly are the most affected groups for the temperature increase during summer, both in their cardiovascular and respiratory systems. Elderly are also the most vulnerable to temperature changes during winter for both causes. The 15 to 64 years old group is the most affected by the atmospheric CO presence; this could be due to activity patterns and time of exposure. During winter time, males and elderly are the most vulnerable groups.
The homogeneity presented by the geographical and emissions patterns of Buenos Aires, allows us to assign the same correlations obtained for one monitoring site and one meteorological station, to the whole studied area. However the design of effective tools for health policies must consider also individual exposition and other socio economic and cultural variables, not accounted for in this study, that mediate between exposition and health impact.
As a temporal series study, the present study covers an acceptable period of time for statistics. Nevertheless it has to be remarked the need of being cautious at the time of generalizing these results to other periods, mainly because the temperature range in the analyzed period was a warm one, compared to previous years in the same area. Moreover, due to the lack of disaggregated and reliable air quality data, only carbon monoxide series could be built and the CO-mortality correlation found may be masking the influence of other pollutants not analyzed in this study.
5. Conclusions
This work’s main contribution is to provide information, processed with scientific world accepted methodologies, with results that are locally valid and coherent with those obtained for populations with similar characteristics.
This allows us to state that, even when the quantity or quality of the raw data presented some limitations, available data allows for conclusions, for Buenos Aires City, that are consistent with the state of art. We found correlations between temperature changes and total, cardiovascular and respiratory mortality. This correlation is direct during summer months, and stronger for shorter lags, and inverse and stronger for longer lags for the winter months. Autumn and spring also show an inverse correlation between temperature and mortality, although the slopes are smoother and statistical significance is lower. Respiratory mortality presents, for all the seasons, weaker correlations.
Consistently with other reviewed research works [13, 40], we found an impact over death very close in time to a temperature increase. This constrains the implementation of preventive health actions after a temperature increase, and calls for the understanding of the underlying conditions’ that would allow preventive policies.
Results show that about 4% extra deaths can be expected on the day following of a 1ppm CO increase. The correlations found for greater lags are hard to explain by biological causes, and may be reflecting the effect of co presence of other pollutants like particulate matter.
In general terms, the elderly are the most vulnerable, both to climate variables and pollution levels. Considering Buenos Aires City has a relatively aged population, the results of this work highlights that climate and pollution impose a greater demand of this group over the health system.
While Buenos Aires lacks a comprehensive health policy that addresses environmental issues, there are initiatives to improve this situation, such as the high temperature alert spread during summer provided by the meteorological weather service.
Currently the situation regarding the lack of information on both air quality and health statistics for the City of Buenos Aires is being reversed. Recently installed monitoring stations and better processing of health information may be used to expand these results to longer time series, including the effects of other compounds not only on mortality but also on morbidity.
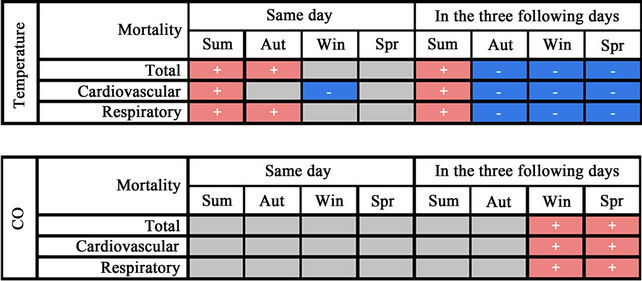
Figure 8. Seasons of larger concern regarding temperatures and CO effects. By cause of death and by lag effect.
6. Acknowledgements
The authors thank the collaboration of Sergio Ibarra Espinoza in the processing of the data. The authors are thankful for information and support provided by Adrián Santoro from the National Ministry of Health; the National Weather Service and the Statistics Direction of the Buenos Aires City Government.
REFERENCES
- S. Whitman, G. Good, E. R. Donoghue, N. Benbow, W. Shou and S. Mou, “Mortality in Chicago attributed to the July 1995 Heat Wave,” American Journal of Public Health, Vol. 87, No. 9, 1997, pp. 1515-1518. doi:10.2105/AJPH.87.9.1515
- D. Levy, T. Lumley, L. Sheppard, J. Kaufman, H. Checkoway, “Referent Selection in Case-Crossover Analyses of Acute Health Effects of Air Pollution,” Epidemiology, Vol. 12, No. 2, 2001, pp. 186-192.
- A. L. Ferreira-Braga, A. Zanobetti and J. Schwartz, “The Lag Structure between Particulare Air Pollution and Respiratory and Cardiovascular Deaths in 10 US Cities,” Journal of Occupational and Environmental Medicine (JOEM), Vol. 43, No. 11, 2001, pp. 662-667.
- A. L. Ferreira-Braga, A. Zanobetti and J. Schwartz, “The Effect of Weather on Respiratory and Cardiovascular Deaths in 12 US Cities,” Environmental Health Perspectives, Vol. 110, No. 9, 2002, pp. 859-863.
- A. El-Zein and M. Tewtel-Salem, “On the Association between High Temperature and Mortality in Warm Climates,” Science of the Total Environment, Vol. 343, No. 1-3, 2005, pp. 273-275. doi:10.1016/j.scitotenv.2004.12.024
- G. Touloumi, K. Katsouyanni, D. Zmirou, et al., “ShortTerm Effects of Ambient Oxidant Exposure on Mortality: A Combined Analysis within the APHEA Project,” American Journal of Epidemiology, Vol. 146, No. 2, 1997, pp. 177-185.
- J. M. Samet, F. Dominici, F. C. Curriero, I. Coursac and S. L. Zeger, “Fine Particulate Air Pollution and Mortality in 20 U.S. Cities, 1987-1994,” New England Journal of Medicine, Vol. 343, No. 24, 2000, pp. 1742-1749. doi:10.1056/NEJM200012143432401
- R. W. Atkinson, H. R. Anderson, J. Sunyer, J. Ayres, M. Baccini, J. M. Vonk, et al., “Acute Effects of Particulate Air Pollution on Respiratory Admissions. Results from APHEA 2 Project,” American Journal of Respiratory and Critical Care Medicine, Vol. 164, No. 10, 2001, pp. 1860-1866.
- M. Saez, F. Ballester, M. A. Barceló, S. Pérez-Hoyos, J. Bellido, J. M. Tenías, et al., On Behalf of the Emecam Group, “A Combined Analysis of the Short-Term Effects of Photochemical Air Pollutants on Mortality within the EMECAM Project,” Environmental Health Perspectives, Vol. 110, No. 3, 2002, pp. 221-228. doi:10.1289/ehp.02110221
- F. Ballester, M. Sáez, S. Pérez-Hoyos, C. Iñíguez, A. Gandarillas, A. Tobías, et al., On Behalf of the Emecam Group, “The EMECAM Project: A Multicentre Study on Air Pollution and Mortality in Spain: Combined Results for Particulates and for Sulfur Dioxide,” Occupational and Environmental Medicine, Vol. 59, No. 5, 2002, pp. 300-308. doi:10.1136/oem.59.5.300
- I. Romieu, F. Meneses, S. Ruiz, J. J. Sienra, J. Huerta, M. C. White and R. A. Etzel, “Effects of Air Pollution on the Respiratory Health of Asthmatic Children Living in Mexico City,” American Journal of Respiratory and Critical Care Medicine, Vol. 154, Part 1, 1996, pp. 300- 307.
- J. Rosales-Castillo, V. Torrez-Meza, G. Olaiz-Fernandez and V. Borja-Aburto, “Los Efectos Agudos de la Contaminación del Aire en la Salud de la Población,” Revista Salud Pública de México, Vol. 43, No. 6, 2001, pp. 544- 555.
- R. Basu and J. M. Samet, “Relation between Elevated Ambient Temperature and Mortality: A Review of the Epidemiologic Evidence,” Epidemiologial Review, Vol. 24, No. 2, 2002, pp. 190-202. doi:10.1093/epirev/mxf007
- M. A. McGeehin and M. Mirabelli, “The Potential Impacts of Climate Variability and Change on TemperatureRelated Morbidity and Mortality in the United States,” Environ Health Perspectives, Vol. 109, Suppl. 2, 2001, pp. 185-189. doi:10.2307/3435008
- J. Díaz Jiménez, C. Linares Gil and R. García Herrera, “Impacto de las Temperaturas Extremas en la Salud Pública: Futuras Actuaciones,” Revista Española de Salud Pública, Vol. 79, No. 2, 2005.
- A. L. Ferreira-Braga, A. Zanobetti and J. Schwartz, “The Time Course of Weather-Related Deaths,” Epidemiology, Vol. 12, No. 6, 2001, pp. 662-667.
- M. S. O’Neill, A. Zanobetti and J. Schwartz, “Modifiers of the Temperature and Mortality Association in Seven US Cities,” American Journal of Epidemiology, Vol. 157, No. 12, 2003, pp. 1074-1082. doi:10.1093/aje/kwg096
- D. Grass and M. Cane, “The Effects of Weather and Air Pollution on Cardiovascular and Respiratory Mortality in Santiago, Chile, during the winters of 1988-1996,” International Journal of Climatology, Vol. 28, No. 8, 2008, pp. 1113-1126. doi:10.1002/joc.1592
- N. Gouveia, S. Hajat and B. Armstrong, “Socioeconomic Differentials in the Temperature-Mortality Relationship in São Paulo, Brazil,” International Journal of Epidemiology, Vol. 32, No. 3, 2003, pp. 390-397. doi:10.1093/ije/dyg077
- M. Rusticucci, L. Betolli and M. A. Harris, “Association between Weather Conditions and the Number of Patients at the Emergency Room in an Argentine Hospital,” International Journal of Biometeorology, Vol. 46, No. 1, 2002, pp. 42-51. doi:10.1007/s00484-001-0113-z
- J. Hoffmann, R. Arnolt, M. Daguerre and L. Calcagno, “Correlaciones Entre los Ataques de Asma en Pediatría y las Condiciones Meteorológicas en ROSARIO,” Meteorológica, Vol. 14, 1983, p. 87
- C. Piccolo, G. Perillo, C. Ramon and V. Didio, “Outbreaks of Asthma Attacks and Meteorologic Parameters in Bahia Blanca, Argentina,” Annals of Allergy, Vol. 60, 1988, pp. 107-110.
- J. B. Iribarne and W. L. Godson, “Atmospheric Thermodinamycs,” D. Reidel Publishing Company, Holland, 1981.
- National Weather Service, 2010. http://www.smn.gov.ar/?mod=clima&id=5
- P. Smichowski, D. Gómez, L. Dawidowski, A. C. Giné, B. Sánchez and S. Reich, “Monitoring Trace Metals in Urban Aerosols from Buenos Aires city. Determination by Plasma-Based Techniques,” Journal of Environmental Monitoring, Vol. 6, 2004, pp. 286-294. doi:10.1039/b312446k
- H. Bogo, M. Negri and E. San Román, “Continuos Measurement of Gaseous Pollutants in Buenos Aires City,” Atmospheric Environment, Vol. 33, 1999, p. 2587.
- World Health Organization, “Environmental Health Criteria 213. Carbon Monoxide (Second Edition),” ISBN 92 4 157213 2, Geneva, 1999.
- World Health Organization, “WHO Air Quality Guidelines for Particulate Matter, Ozone, Nitrogen, Dioxide and Sulfur Dioxide. Global update 2005, Summary of Risk Assessment,” WHO/SDE/PHE/OEH/06.02, 2005.
- J. Schwartz, “Who Is Sensitive to Extremes of Temperature? A Case-Only Analysis,” Epidemiology, Vol. 16, No. 1, 2005, pp. 67-72.
- R. Peng and F. Dominici, “Studies of Air Pollution and Health in Statitsical Methods for Environmental Epidemiology with R,” A Case Study in Air Pollution and Health, Springer, 2008.
- V. H. Borja-Aburto, “Estudios Ecológicos,” Salud pública Méx, Vol. 42, No. 6, 2000, Cuernavaca.
- H. Kan, S. London, H. Chen, G. Song, G. Chen, L. Jiang, N. Zhao, Y. Zhang and B. Chen, “Diurnal Temperature Range and Daily Mortality in Shanghai, China,” Environmental Research, Vol. 103, No. 3, 2007, pp. 424-431. doi:10.1016/j.envres.2006.11.009
- L. S. Kalkstein, “A New Approach to Evaluate the Impact of Climate upon Human Mortality,” Environmental Health Perspectives, Vol. 96, 1991, pp. 145-150. doi:10.1289/ehp.9196145
- S. A. Lacour, M. De Monte, P. Diot, J. Brocca, N. Veron, P. Colin and V. Leblond, “Relationship between Ozone and Temperature during the 2003 Heat Wave in France: Consequences for Health Data Analysis,” BMC Public Health, Vol. 6, 2006, p. 261. doi:10.1186/1471-2458-6-261
- F. Dominici, R. D. Peng, M. L. Bell, L. Pham, A. McDermott, S. L. Zeger and J. M. Samet, “Fine Particulate Air Pollution and Hospital Admission for Cardiovascular and Respiratory Diseases,” The Journal of the American Medical Association, Vol. 295, No. 10, 2006, pp. 1127-1134. doi:10.1001/jama.295.10.1127
- R. Development Core Team, “R: A Language and Environment for Statistical Computing,” R Foundation for Statistical Computing, Vienna, Austria, ISBN 3-900051- 07-0, 2010.
- A. Zeileis, C. Kleiber and S. Jackman, “Regression Models for Count Data in R,” Journal of Statistical Software, Vol. 27, No. 8, 2008, pp. 1-25.
- J. Schwartz, “Generalized Additive Models in Epidemiology,” Invited Papers, 17th International Biometric Conference, Hamilton, Ontario, 8-12 August 1994.
- H. Bogo, et al., “Study of Atmospheric Particulate Matter in Buenos Aires City,” Atmospheric Environment, Vol. 37, No. 8, 2003, pp. 1135-1147. doi:10.1016/S1352-2310(02)00977-9
- F. C. Curriero, K. S. Heiner, J. M. Samet, et al., “Temperature and Mortality in Eleven Cities of the Eastern United States,” American Journal of Epidemiology, Vol. 155, No. 1, 2002, pp. 80-87. doi:10.1093/aje/155.1.80
NOTES
*This work was carried out with the aid of a grant from the Inter-American Institute for Global Change Research (IAI) CRN II 2017 which is supported by the US National Science Foundation (Grant GEO-0452325) within the framework of the project South American Emissions, Megacities and Climate—Adaptation to the health impacts of air pollution and climate extremes in Latin American cities (ADAPTE) and support from the San Martín National University (UNSAM).
#Corresponding author.