Journal of Human Resource and Sustainability Studies
Vol.2 No.2(2014), Article ID:46509,11 pages
DOI:10.4236/jhrss.2014.22006
The Relationship between Environmental Management and Economic Performance: A New Model with Accumulated Earnings Ratio
Ting Ting Chen1, Tomonori Honda2, Eiji Hosoda3, Kohji Hayase1
1Graduate School of Integrated Arts and Sciences, Hiroshima University, Higashi, Hiroshima, Japan
2Research Institute of Science for Safety and Sustainability, National Institute of Advanced Industrial Science and Technology, Tsukuba, Japan
3Faculty of Economics, Keio University, Tokyo, Japan
Email: d102355@hiroshima-u.ac.jp
Copyright © 2014 by authors and Scientific Research Publishing Inc.
This work is licensed under the Creative Commons Attribution International License (CC BY).
http://creativecommons.org/licenses/by/4.0/


Received 10 April 2014; revised 13 May 2014; accepted 23 May 2014
ABSTRACT
We empirically investigate the relationship between environmental management and economic performance using such data as environmental rating, credit rating, and accumulated earnings ratio of companies listed in the manufacturing sector on the first section of the Tokyo Stock Exchange. We performed a path analysis using two types of structural equation modeling: Model A with a terminal economic performance path and Model B with a terminal environmental management path. As a result, we found that Model B has better goodness of fit in the path analysis than does Model A. This is because it is natural to place the economic performance path before the environment management path since companies pursue profits for stockholders. We also confirmed that in Model B, the path from the accumulated earnings rate to environmental management has a significantly negative coefficient. This suggests that two groups of enterprises exist: profitoriented and environment-oriented companies. Since our results are based on Japanese companies, it is advisable to investigate further to generalize the results worldwide.
Keywords:Accumulated Earnings Ratio, Environment Management, Economic Performance, Company Size, Sustainable Management

1. Introduction
In recent years, environmental problems such as global warming have become more serious; they have become urgent global concerns. These problems are due to the rapid increase in the amount of waste discharged, as human production activity has progressed quickly. Environmental problems have a great influence on the safety of our everyday lives. In order to cope with global environmental problems, attention has been given to the establishment of an international environmental protection organization, national environmental regulations, laws, and corporate social responsibility (CSR). While social concern about CSR increases, the idea of socially responsible investing (SRI), which considers environmental issues, has gained popularity. Because of these social demands, financial products such as “SRI funds” and “environmental rating loans,” which invest in companies excellent at dealing with environmental problems, are becoming more popular. Here, a dilemma arises between environmental protection, that is, environmental management, and economic development or economic performance.
The previous research includes many studies that examine models in which environmental management measures such as environmental regulation or an environmental impact index are used as antecedent factors (explaining variables) and economic performance is used as an explained variable. We call these types of models “Model A.” Model A assumes that the promotion of environmental management provides some sort of benefit to corporate management. References - found positive correlations between environmental management and economic performance. References - , however, found negative correlations between the two. There is also research that uses economic performance as an antecedent factor (explaining variable) and environmental management as an explained variable . We call the model used in this research “Model B.” Model B assumes that the economic performance of a company advances its efforts at environmental management. Walley and White head claim that economic performance and environmental management have a trade-off relationship. It has not yet been verified which model best describes the relationship between environmental management and economic performance. In this study, in order to reveal the relation mechanism of environmental management and economic performance, we clarify which serves as an explaining variable and an explained variable using data on company size, financial indicators, environmental management, and economic performance.
Nikkei Inc.’s environmental management rating research is the first environmental rating of companies in Japan. Now, several publishing and newspaper companies provide similar environmental rating evaluations. Several studies use environmental ratings to study the relationship between environmental management and economic performance. Russo and Fouts used the environmental rating of the Franklin Research and Development Company, and Managi used the environmental rating of the Sustainable Management Rating Institute. The environmental rating of Nihon Keizai Shimbun is used in - . While the environmental rating is used as a nonfinancial ranking, credit rating ranks companies based on financial value. A company’s credit rating evaluates whether it has the ability to pay the principal and interest of adebenture within the term of redemption. Thus, a high credit rating enables a company to lower the cost of fundraising. Furthermore, disclosure to the credit rating agency and improving management transparency result in increased management efficiency . Ratings play an important role in addressing the “asymmetry of information” between investors and issuers. Therefore, it is understood that the environmental rating and credit rating are important information, providing an indispensable infrastructure for financial markets.
In this study, we use the credit ratings of the Ranking Investment Advisory Center (R & I) to measure economic performance and the environmental rating of Nihon Keizai Shimbun as an evaluation of environmental management. In previous studies on the relation between environmental management and economic performance, sales or the number of employees have been often used as indexes of company size . We examine these two company size indexes and then define a new company index more suitable for our study. The financial indicators we use here are the accumulated earnings ratio, the interest-bearing debt ratio , and cash flow. Since the accumulated earnings ratio is a measure of a company’s surplus benefits , and it affects the enterprise’s actions and decision making, it is interesting to investigate empirically the accumulated earnings ratio’s effect on environmental management and economic performance .
The purpose of this research is as follows. First, we introduce a new index, the standardized index of company size from sales and number of employees (SICS) , which incorporates both sales and the number of employees, and verify the appropriateness of the new index through path analysis. Second, we use path analysis to investigate environmental management and economic performance in terms of the mechanism of company ma-
nagement and clarify which is the antecedent factor (explaining variable) or explained variable. Finally, we study the influence of a surplus of benefits (accumulated earnings ratio) on environmental management and economic performance, and from the results, we show the existence of a company group investing a surplus of benefits in environmental management.
This paper is organized as follows. The data we use in this study are described in Section 2. Section 3 presents our method of analysis. In Section 4, we discuss company size indexes and define a new company size index. In Section 5, we compare Models A and B. In Section 6, we discuss the accumulated earnings ratio’s effect on environmental management and economic performance. Finally, we conclude in Section 7.
2. Data
The companies we consider here belong to the manufacturing industry and are listed on the first section of the Tokyo Stock Exchange. We used the data disclosed in 2010-2013 after the economic downturn precipitated by the Lehman Brothers bankruptcy in 2008 and chose 142 companies that disclosed data every year during the period 2010-2013 (31 chemistry and medical supply companies, 23 electrical machinery and apparatus companies, 17 machine companies, 13 transportation apparatus companies, 15 food companies, 10 companies producing other products, seven pulp and paper companies, six precision instrument companies, five nonferrous metals companies, five glass and soil-and-stone product companies, four textile companies, three steel companies, two rubber companies, and one oil and coal products company).
2.1. Environmental Management Data
The environmental rating data, which quantify environmental management, were extracted from the 13th (2010), 14th (2011), 15th (2012), and 16th (2013) Nikkei Environmental Management Rating Research Investigation Reports by Nihon Keizai Shimbunsya [27] -[30] .
The Nikkei environmental management rating (environmental rating) evaluates the environmental management of companies based on five items: environmental management promotion, countermeasures against pollution, resource circulation, environmental measures applied to products and global warming. We used the total score for the five items as the environmental rating.
2.2. Economic Performance Data
We used companies’ credit ratings to measure their economic performance. The data were obtained from the credit ratings by Rating & Investment Information Inc. (R & I) in February 2010 [31] , March 2011 [32] , March 2012 [33] , and March 2013 [34] . The credit ratings were originally evaluated using letter grades—AAA, AA+, etc.—but in this research we performed the numeric conversion shown in Table 1.
2.3. Company Size and Financial Indicators
We used two company size indexes: sales and number of employees. The financial indicators we consider here are the accumulated earnings ratio, the interest-bearing debt ratio, and cash flow. The data on company size and financial indicators were extracted from the Spring 2010-2013 Japan Company Hand books by Toyo Keizai Shinpo Sha [35] . The accumulated earnings ratio is defined as accumulated earnings to gross assets. The interest-bearing debt ratio is defined as interest-bearing debt to gross assets. Cash flow means the value of the operating cash flow over interest-bearing debt.
3. Method of Analysis
In this research, we assume that some relationships exist between company size, financial indicators, environmental management, and economic performance. To reveal the relationships, we performed path analysis using Amos version 21.0. Various models were examined in the path analysis, and the models were evaluated using goodness of fit indexes such as root mean square error of approximation (RMSEA), goodness of fit index (GFI), adjusted GFI (AGFI) and comparative fit index (CFI). The better model is indicated by the lower RMSEA. In general, when the RMSEA is less than 0.06, the model is considered good enough [36] . When the RMSEA is more than 0.10, the model is not good enough. The maximum value of the GFI is 1, and a good model is indicated by a value close to 1. The AGFI is an adjusted version of the GFI; it also takes 1 at the maximum. If the AGFI is greater than 0.90, then the model is considered good enough. The maximum value of the CFI is 1, and a good model is indicated by a value close to 1.
We consider two models as described in Figure 1 and Figure 2, which illustrate the initial paths in the path analysis. To investigate the relations among attributes (sales, number of employees, accumulated earnings ratio, interest-bearing debt ratio, and cash flow), we first drew bidirectional arrows among all of them. To avoid complexity, some of the bidirectional arrows are omitted in the figures. The model in Figure 1 (Model A) has a path that ends with the credit rating, and the model in Figure 2 (Model B) has a path that ends with the environmental rating. We performed the path analysis as follows. First, to examine the correlations among the four antecedent factors of company size (sales and the number of employees), accumulated earnings ratio, interest-bearing debt ratio, and cash flow, we drew bidirectional arrows (paths). Next, we drew single-direction arrows (paths) to environmental management (environmental rating) and economic performance (credit rating) from all four antecedent factors. Then, we tried to find the optimal solution by discarding the insignificant paths one by one. The path analysis was performed for Models A and B, and the goodness of fit was measured using RMSEA, GFI, AGFI, and CFI.
4. Introduction of a New Company Size Index
4.1. Sales and Number of Employees as a Company Size Index
For Models A and B, using the two variables of sales and number of employees, we performed path analysis to environmental rating and credit rating with the other financial indicators as initial factors: the accumulatedearnings ratio, interest-bearing debt ratio, and cash flow. Then, we examined which measure of company size was a better index. Figure 3 shows the result of the path analysis for Model A-1 with the data from 2013. In the figure, the values shown by unidirectional arrows indicate standardized regression coefficients and the values shown by bidirectional arrows indicate correlation coefficients. Hereafter, these indications are also applied for other figures. The result shows that while sales have no significant influence on environmental rating, they have a positive influence on credit rating. On the other hand, number of employees has no significant influence

Table 1. Numeric conversion of credit ratings.
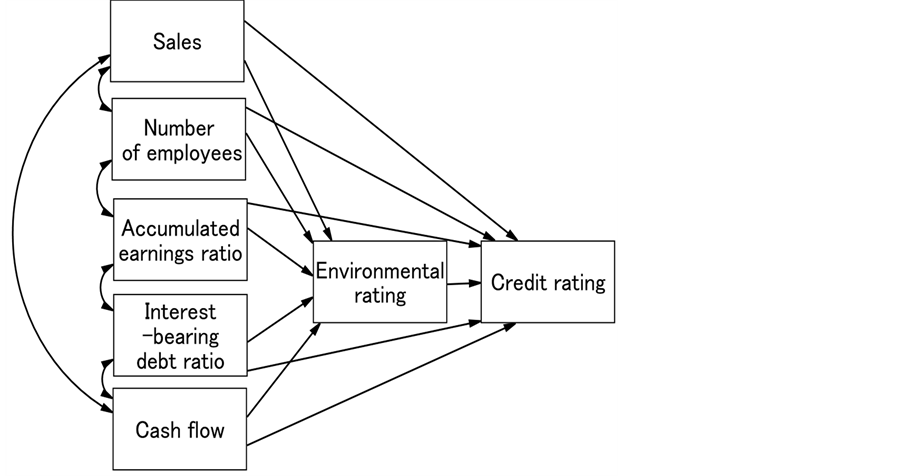
Figure 1. Model A: Environmental rating is placed before credit rating.

Figure 2. Model B: Credit rating is placed before environmental rating.
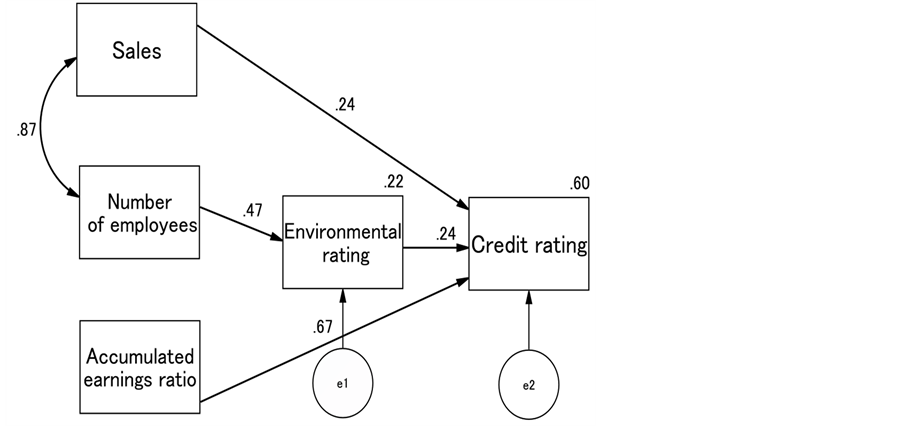
Figure 3. Model A-1: Results from the data in 2013; (a) Fit measures: RMSEA = 0.029, GFI = 0.985, AGFI = 0.954, CFI = 0.998; (b) Squared multiple correlations (SMC): environmental rating (0.22), credit rating (0.60); (c) p < 0.05 (including p < 0.001 and p < 0.01).
on credit rating, but it has positive influence on environmental rating. It turned out that sales and number of employees have different influences on environmental rating and credit rating. Thus, sales and number of employees cannot be considered the same variable having the same properties. Our other findings are as follows. The accumulated earnings ratio has significant positive influence on credit rating. The interest-bearing debt ratio and cash flow are not significant. Environmental rating was found to have significant influence on the credit rating. Figure 4 shows the results of Model B-1 using path analysis. We find that sales have significant positive influence only on credit rating, and number of employees has significant positive influence only on environmental rating. Model B-1 is similar to Model A-1 with regard to influence of sales and number of employees on credit rating and environmental rating. Moreover, while the accumulated earnings ratio has significant influence on credit rating, it has significant negative influence on environmental rating. It is also verified that the interest-bearing

Figure 4. Model B-1: Results from the data in 2013. (a) Fit measures: RMSEA = 0.068, GFI = 0.982, AGFI = 0.932, CFI = 0.998; (b) SMC: environmental rating (0.54), credit rating (0.29); (c) p < 0.05 (including p < 0.001 and p < 0.01).
debt ratio and cash flow have no significant influence in Model B-1. Credit rating has significant positive influence on environmental rating.
From the results of Model A-1 and B-1, we find that sales and number of employees
are inconsistent as an index of company size. Therefore, it is preferable to use
another, better index that produces consistent results. In order to construct an
effective index of company size, we propose to use the SICS [26] , which consists
of a sum of the standardized sales and the standardized number of employees, and
examine the SICS using path analysis. The SICS is defined as follows. Let
 and
and
 be sales and number of employees, respectively, for the i-th company. These values
are standardized as
be sales and number of employees, respectively, for the i-th company. These values
are standardized as
 and
and
 &nbs
p; (1)
&nbs
p; (1)
where
 and
and
 are average values of sales and number of employees, respectively, and
 and
and
 are standard deviations of sales and number of employees, respectively. Using
 and
and , we define a new company index as
 . (2)
. (2)
We call this the SICS.
4.2. Analysis Using SICS
Figure 5 and Figure 6 show the results of Models A-2 and B-2, respectively, with SICS. It is found that SICS has significant positive influence on both environmental rating and credit rating. The goodness of fit results are found to be RMSEA = 0.029 (Model A-1), RMSEA = 0.068 (Model B-1), RMSEA = 0.000 (Model A-2), and RMSEA = 0.000 (Model B-2). Thus, Models A-2 and B-2, which use SICS, have better goodness of fit results. Other fit indexes such as GFI, AGFI and CFI are also consistent with this. Therefore, SICS is considered to be more effective than other company size indexes. Hereafter, we use SICS as the company size index.
5. Comparison: Models A and B
In order to verify which model is more suitable to describe the relation mechanism of environmental management (environmental rating) and economic performance (credit rating), we performed the path analysis for

Figure 5. Model A-2: Results from the data in 2013. (a) Fit measures: RMSEA = 0.000, GFI = 0.994, AGFI = 0.970, CFI = 1.000; (b) SMC: environmental rating (0.20), credit rating (0.60); (c) p < 0.05 (including p < 0.001 and p < 0.01).

Figure 6. Model B-2: Results from the data in 2013. (a) Fit measures: RMSEA = 0.000, GFI = 0.999, AGFI = 0.986, CFI = 1.000; (b) SMC: credit rating (0.54), environmental rating (0.28); (c) p < 0.05 (including p < 0.001 and p < 0.01).
Models A and B using the data for each single fiscal year of the period 2010-2013. Furthermore, we also performed path analysis using the data for all four years (2010-2013). When we used all the data, the data for each index were standardized for each year. It turns out that the optimum paths obtained for each single fiscal year’s data and for the four-year data are the same path. Figure 7 and Figure 8 show the optimum paths obtained by the path analyses for Models A and B, respectively. The path coefficient signs are also indicated in the figures. The results of the path coefficients and the goodness of fit index are given in detail in Table 2 and Table 3.
First, let us consider Model A. In Model A (Figure 7), we find that SICS has significant positive influence on both environmental management (environmental rating) and economic performance (credit rating). This is in agreement with the results in Section 4, regardless of the fiscal year. Environmental management (environmental rating) has significant positive influence on economic performance (credit rating). The accumulated earnings ratio is not significant to environmental management (environmental rating), although significant positive influ-
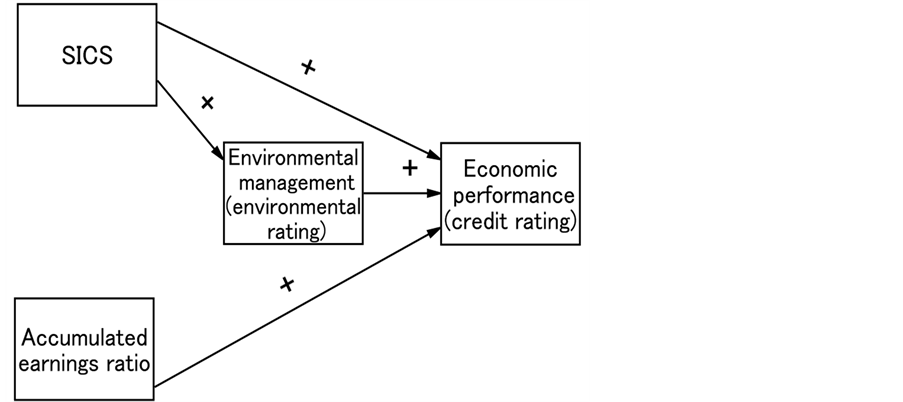
Figure 7. Model A: Results of path analysis with the sign of path coefficients.

Figure 8. Model B: Results of path analysis with the sign of path coefficients.
Table 2. Results of Model A (path coefficients and fit measures).
a. **p < 0.01, ***p < 0.001; b. Path coefficients are from M column to L row; c. C R: Credit rating; d. E R: Environmental rating; e. SICS: Standardized index of company size from sales and number of employees.
Table 3. Results of Model B (path coefficients and fit measures).
a. **p < 0.01, ***p < 0.001; b. Path coefficients are from M column to L row; c. C R: Credit rating; d. E R: Environmental rating; e. SICS: Standardized index of company size from sales and number of employees.
ence is found on economic performance (credit rating).
In Model B, we obtain results similar to those of Model A, except for the accumulated earnings ratio. We find that while the accumulated earnings ratio has significant positive influence on economic performance (credit rating), it has significant negative influence on environmental management (environmental rating). We will discuss this significant negative influence further in Section 6. Next, we consider the goodness of fit results for Models A and B. Although there is no difference between A and B for RMSEA and CFI as seen in Table 2 and Table 3, GFI and AGFI take higher values for Model B. This means that Model B is more suitable than Model A. In Model B, economic performance is placed ahead of environmental management. Since companies’ main purpose is to raise economical corporate value, and because profitability is important for corporate management, it is natural for economic performance to be placed ahead of environmental management.
6. The Accumulated Earnings Ratio’s Significant Negative Influence on Environmental Management
In the previous section, Model B was adopted as a good model to express the relation mechanism of environmental management and economic performance in terms of corporate management. In Model B, the direct path coefficients from accumulated earnings ratio to environmental management (environmental rating) were obtained as −0.30 (2010), −0.25 (2011), −0.36 (2012), −0.35 (2013), and −0.33 (2010-2013 integration). The negative correlation between accumulated earnings ratio and environmental management (environmental rating) means that when the accumulated earnings ratio is high, the environmental management (environmental rating) is low, and vice versa. This suggests the existence of a company group (group X) with a low environmental management evaluation but high accumulated earnings, and a company group (group Y) with high environmental management evaluation but low accumulated earnings. Accumulated earnings indicate some of the company’s surplus benefits, but how surplus of benefits are used depends highly on corporate management. It is considered that for group X, the corporate priority is to raise profits. On the other hand, group Y promotes environmental management even with fewer surplus benefits.
Next, consider that the accumulated earnings ratio could have an indirect effect on environmental management through economic performance (credit rating). In Figure 6, we find that the path coefficient from accumulated earnings ratio to economic performance is 0.65 in 2013, and that from economic performance to environmental management is 0.40 in 2013. Thus, the indirect effect is calculated to be a product of two coefficients, 0.65 × 0.40 = 0.26. Similarly, indirect effects in other years are calculated to be 0.21 (2010), 0.20 (2011), 0.25 (2012), and 0.25 (2010-2013). Now consider the overall effect given by a sum of the direct and indirect effects. The overall effects from the accumulated-earnings ratio to the environmental management are calculated to be −0.09 (2010), −0.05 (2011), −0.11 (2012), −0.09 (2013), and −0.08 (2010-2013). Thus, the overall effects in Model B are also negative. In Model A, we also find negative coefficients from accumulated earnings ratio to environmental management, but they are not significant.
Ricoh Company Ltd. is an example of a company belonging to group Y, which invests surplus benefits in environmental management and considers the sustainable development of society to be important. Ricoh Company Ltd. offers a farming experience program every year for 28 male and 28 female students ranging in age from the fourth year of elementary school to the second year of junior high school [37] . Ricoh Company Ltd. has to spend about 70 million yen for this program from its accumulated-earnings. In terms of environmental management activities, the relationship between surplus benefits and environmental management reflects the value the company’s corporate management places on environmental management.
7. Conclusions
In this research, 142 manufacturing industry companies listed on the first section of the Tokyo Stock Exchange were analyzed to study the relationships among company size, financial indicators, environmental management, and economic performance. The findings are as follows:
First, we examined two company size indexes: sales and the number of employees. The path analysis showed that the two indexes exhibit inconsistent results as measures of company size. Then, we used SICS, defined as sales and the number of employees together, and confirmed that SICS produces consistent results in the path analysis.
Second, we examined two models: Model A and Model B, and according to the goodness of fit results, we found that Model B is better than Model A. Model B has a path in which economic performance comes ahead of environmental management. This is consistent with the main purpose of companies, which is to raise economic corporate value; profitability is important for corporate management.
Finally, we found the first evidence that the direct path coefficient from accumulated earnings ratio to environmental management is significantly negative. This negative coefficient suggests that two company groups exist: a profit-oriented group (group X) and an environment-oriented group (group Y).
Our analysis is based on data for Japanese companies. Thus, it would be advisable to investigate further to determine whether our findings are also observed worldwide.
Acknowledgements
We deeply appreciate the helpful comments of sustainability governance group manager Dr. Atsuo Kishimoto and the members of the sustainability governance group at the Research Institute of Science for Safety and Sustainability at the National Institute of Advanced Industrial Science and Technology.
References
- Lanjouw, J.O. and Mody, A. (1996) Innovation and International Diffusion of Environmentally Responsive Technology. Research Policy, 25, 549-571. http://dx.doi.org/10.1016/0048-7333(95)00853-5
- Porter, M.E. and van der Linde, C. (1995) Toward a New Conception of the Environment Competitiveness Relationship. Journal of Economic Perspectives, 9, 97-118. http://dx.doi.org/10.1257/jep.9.4.97
- Jaffe, A.B. and Palmer, K. (1997) Environmental Regulation and Innovation: A Panel Data Study. The Review of Economics and Statistics, 79, 610-619. http://dx.doi.org/10.1162/003465397557196
- Konar, S. and Cohen, M.A. (2001) Does the Market Value Environmental Performance? Review of Economics and Statistics, 83, 281-289. http://dx.doi.org/10.1162/00346530151143815
- King, A. and Lenox, M. (2002) Exploring the Locus of Profitable Pollution Reduction. Management Science, 48, 289- 299. http://dx.doi.org/10.1287/mnsc.48.2.289.258
- Hibiki, A., Higashi, M. and Matsuda, A. (2003) Determinants of the Firm to Acquire ISO14001 Certificate and Market Valuation of the Certified Firm. Discussion Paper 03-06, Department of Social Engineering, Tokyo Institute of Technology, Tokyo.
- Corderio, J.J. and Sarkis, J. (1997) Environmental Proactivism and Firm Performance: Evidence from Security Analyst Earnings Forecasts. Business Strategy and the Environment, 6, 104-114. http://dx.doi.org/10.1002/(SICI)1099-0836(199705)6:2<104::AID-BSE102>3.0.CO;2-T
- Wagner, M., Phu, N.V., Azomahou, T. and Wehrmeyer, W. (2002) The Relationship between the Environmental and Economic Performance of Firms: An Empirical Analysis of the European Paper Industry. Corporate Social Responsibility and Environmental Management, 9, 133-146. http://dx.doi.org/10.1002/csr.22
- Filbeck, G. and Gorman, R.F. (2004) The Relationship between the Environmental and Financial Performance of Public Utilities. Environmental and Resource Economics, 29, 137-157. http://dx.doi.org/10.1023/B:EARE.0000044602.86367.ff
- Boons, F. and Wagner, M. (2009) Assessing the Relationship between Economic and Ecological Performance: Distinguishing System Levels and the Role of Innovation. Ecological Economics, 68, 1908-1914. http://dx.doi.org/10.1016/j.ecolecon.2009.02.012
- Walley, N. and Whitehead, B. (1994) It’s Not Easy Being Green. Harvard Business Review, 72, 46-52.
- Russo, M.V. and Fouts, P.A. (1997) A Resource-Based Perspective on Corporate Environmental Performance and Profitability. Academy of Management Journal, 40, 534-559. http://dx.doi.org/10.2307/257052
- Managi, S. (2010) Economics of Environmental Strategy. Chuokeizai-sha Inc.
- Kagata, K. (2006) An Empirical Study of the Relationship between Environmental Performance and Financial Performance. Journal of Policy Studies, 21, 121-142.
- Cole, M.A., Elliott, R.J.R. and Shimamoto, K. (2006) Globalization, Firm-Level Characteristics and Environmental Management: A Study of Japan. Ecological Economics, 59, 312-323. http://dx.doi.org/10.1016/j.ecolecon.2005.10.019
- Hongo, A. (2008) Does Environmental Management Increase Firm Value? Empirical Analysis of Firm Value Using Nikkei’s Environmental Management Survey. The Journal of Social Science, 64COE Special Edition, 257-268.
- Takeda, F. and Tomozawa, T. (2008) A Change in Market Responses to the Environmental Management Ranking in Japan. Ecological Economics, 67, 465-472. http://dx.doi.org/10.1016/j.ecolecon.2007.12.027
- Yamazawa, K. (2003) Practical Guide to the Rating and the Rating Industry. Toyo Keizai Inc.
- Goto, M. (2011) A Review of the Porter Hypothesis and Empirical Study on Japanese Industries. Socio-Economic Research Center Rep, Y10014, 1-34.
- Masaki, A. (2006) A Study on the Problems of CSR in Japan—Corporate Social Performance and Financial Performance. The Economic Journal of Takasaki City University of Economics, 48, 157-170.
- Fujii, H., Yagi, M., Managi, S. and Kaneko, S. (2001) Relationship between Eco-Patent and Corporate Financial Performance in Japanese Manufacturing Sector. Environmental Science, 24, 114-122.
- Nakamura, M., Takahashi, T. and Vertinsky, I. (2001) Why Japanese Firms Choose to Certify: A Study of Managerial Responses to Environmental Issues. Journal of Environmental Economics and Management, 42, 23-52. http://dx.doi.org/10.1006/jeem.2000.1148
- Drucker, P.F. (1954) The Practice of Management. Harper & Row, New York.
- Elsayed, K. and Paton, D. (2005) The Impact of Environmental Performance on Firm Performance: Static and Dynamic Panel Data Evidence. Structural Change and Economic Dynamics, 16, 395-412. http://dx.doi.org/10.1016/j.strueco.2004.04.004
- Hamamoto, M. (2006) Environmental Regulation and the Productivity of Japanese Manufacturing Industries. Resource and Energy Economics, 28, 299-312. http://dx.doi.org/10.1016/j.reseneeco.2005.11.001
- Chen, T.T., Wu, R., Honda, T. and Hayase, K. (2014) Proposal for a New Company Size Index and Its Use in Effects Analysis. Society of Environmental Science, 27, 73-83.
- Nikkei Inc. (2010) Report on 13th Survey of Environment Oriented Management Index (In Japanese).
- Nikkei Inc. (2011) Report on 14th Survey of Environment Oriented Management Index (In Japanese).
- Nikkei Inc. (2012) Report on 15th Survey of Environment Oriented Management Index (In Japanese).
- Nikkei Inc. (2013) Report on 16th Survey of Environment Oriented Management Index (In Japanese).
- R & I Inc. (2010) Credit Ratings Data 2010 February. http://www.r-i.co.jp/jpn/cfp/data/index.html
- R & I Inc. (2011) Credit Ratings Data 2011 March. http://www.r-i.co.jp/jpn/cfp/data/index.html
- R & I Inc. (2012) Credit Ratings Data 2012 March. http://www.r-i.co.jp/jpn/cfp/data/index.html
- R & I Inc. (2013) Credit Ratings Data 2013 March. http://www.r-i.co.jp/jpn/cfp/data/index.html
- Toyo Keizai Inc. (2010-2013) Japan Company Handbook Spring 2010, 2011, 2012 and 2013 (In Japanese).
- Hu, L. and Bentler, P.M. (1999) Cutoff Criteria for Fit Indexes in Covariance Structure Analysis: Conventional Criteria versus New Alternatives. Structural Equation Modeling, 6, 1-55. http://dx.doi.org/10.1080/10705519909540118
- http://www.ricoh.co.jp/csr/index.html http://www.szj.jp