Journal of Biosciences and Medicines
Vol.08 No.03(2020), Article ID:98643,9 pages
10.4236/jbm.2020.83004
Study of the Variation in Total and Reducing Sugars Contents According to the Variety and According to the Position Where the Fruit (Mango) Was Harvested from Five Mango Varieties Exploited in Senegal
Ba Ibrahima*, Fofana Mouhamadou, Diop Moussoukhoye
Natural Products Laboratory (LPN), Department of Chemistry, Faculty of Science and Technology, Sheikh Anta Diop University of Dakar, Dakar, Senegal

Copyright © 2020 by author(s) and Scientific Research Publishing Inc.
This work is licensed under the Creative Commons Attribution International License (CC BY 4.0).
http://creativecommons.org/licenses/by/4.0/


Received: January 29, 2020; Accepted: February 29, 2020; Published: March 3, 2020
ABSTRACT
In this study, the results show that total sugar contents depend on the variety and the position where the fruit (mango) has been harvested. This variation in total sugar contents is observed according to the following varieties: the Bk (Boukodiekhal) variety (bottom position 45 mg/100 mL) then Bk (intermediate and bottom position 40 mg/100 mL) and with the Dr (Diourou) variety the content according to the intermediate position is 63 mg/100 mL while the content according to its bottom position is 56 mg/100 mL. The same is observed for variety Knt (Kent). For the variety factor, we see that the Dr and Sl (Sierra Leone) varieties are the richest in total sugars. Compared to the variation in reducing sugar content, the effect of position is less pronounced. Nevertheless, the statistical results show that the contents vary according to the varieties. There is a very significant variation in reducing sugar content between certain varieties. The variety Kt (Keitt) (45 mg/100 mL) is the richest in reducing sugars but compared to the lower position of the variety Bk, they are statistically identical. Variety Knt remains the poorest in reducing sugars 20 mg/ 100 mL.
Keywords:
Mangifera indica L., Sugar Composition, Mango, Export and Local Consumption

1. Introduction
Fruits and vegetables are an important component of a healthy, balanced diet. Eaten in sufficient quantities every day, they could help prevent major illnesses such as cardiovascular disease and certain cancers. According to the World Health Report 2002, low fruit and vegetable consumption is the cause of about 31% of ischemic heart disease and 11% of strokes around the world [1]. Overall, up to 2.7 million lives could be saved each year by sufficiently increasing fruit and vegetable consumption [2].
Speaking of fruit in Senegal, mango remains one of the most exploited fruits with a great diversity of varieties that offer the country the longest production period of six months [3]. Although Senegal is a mango-producing country, studies on the biochemical characterization of cultivated varieties are almost non-existent. However, a study on biochemical composition is of paramount importance. First of all, it must be understood that the nutritional specificity of fruit is linked to its composition, which itself depends on the species, variety, degree of ripeness, growing conditions and storage and preservation [4]. This nutritive specificity linked to certain parameters, leads us to carry out a study of the influence of the variety and the position where the fruit (mango) has been harvested according to the variation in the contents of total sugars and reducing sugars. This study has been carried out on five varieties of mangoes exploited in Senegal, two of which are intended for export and the three for local consumption on the one hand and for national marketing on the other. This work enables us to understand whether variety and position factors have an influence on total and reducing sugar contents, but also to identify the richest variety which is meaningful.
2. Material and Methods
2.1. Material
2.1.1. Sample Origin
The mango samples used in this work come from two areas of Senegal: Kaguitt village in the Ziguinchor region and Keur Mbir Ndao in the Thies region (Niayes zone).
In the southern zone, four varieties of mango were collected, two of which are for export and two varieties specific to the locality for national marketing, which are highly appreciated by consumers. In the Niayes zone, one variety was collected for national marketing.
2.1.2. Sampling Technique
Each variety is harvested from three mango trees in three levels per mango tree (lower level, intermediate level and upper level). The varieties for export taken from the southern zone are Kent and Keitt, and the local varieties Diourou and Sierra Leone. The local variety of Boukodiekhal is collected in the Niayes zone (Photo 1).
2.2. Total and Reducing Sugar Contents
For reducing sugars and total sugars, the Luff-Schoorl method is used after hydrolysis with HCl solution for 3 minutes boiling. The sugar liquor is hot-oxidized
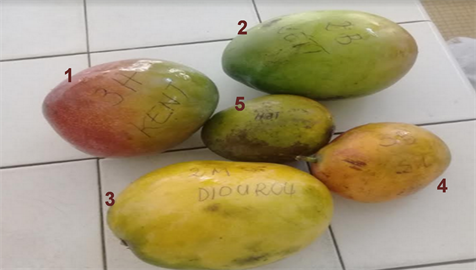
Photo 1. Mangifera indica L. var. 1. Kent; 2. Keitt; 3. Diourou; 4. Sierra Leone and 5. Boukodiekhal.
by a cupro-alkaline solution and the excess cupric liquor is titrated by iodometry. At the same time, the cupro-alkaline liquor is titrated. The total sugar content, expressed in mg per 100 mL of product, is given by the relationship:
(1)
V: Test sample in milliliter (liquid sample);
V0: Volume of “0.1 N” thiosulfate solution used to titrate the blank;
V1: Volume of “0.1 N” thiosulfate solution used to titrate the sample;
m: Mass of sugar, expressed in mg, corresponding to the difference in volume between the blank and the sample (V0 - V1);
d: Dilution factor.
3. Results and Discussions
3.1. Study Variables and Varieties Studied
l Study Variables: Total Sugars (mg/100 mL) and Reducing Sugars (mg/100 mL).
l Varieties studied: Kent (Knt), Diourrou (Dr), Keitt (Kt) Boukodiékhal (BK) and Sierra-léon (SL).
3.2. Reducing Sugars and Total Sugars Contents According to Variety and Position
Carbohydrates (or sugars) are the body’s primary source of energy and are essential for the functioning of the muscles and the brain. Supplied by the diet, they are broken down into glucose in the body. Some of the carbohydrates ingested are stored as glycogen in the liver and muscles as an energy reserve [5]. This includes naturally occurring sugars in food and beverages, as well as those added to food products [6]. In nature, sucrose is present in a large number of plants, especially in their roots, fruits and nectar, where it is used to store energy from photosynthesis [7]. Naturally occurring sugars are a healthy alternative to foods with added sugars, such as cakes, pastries, processed foods, refined bread and cereals. Fruits and vegetables are naturally low in calories and fat and provide many important nutrients [8] [9].
3.3. Variation of the Total Sugars Content According to Variety and Position
Carbohydrates are a very important group of compounds, some of which represent a source of energy for living organisms, either immediately usable (glucose) or in the form of reserves (starch, glycogen); others have a structural role (cellulose, chitin); others, finally, have an important biological role such as that of recognition signals (glycans of glycoproteins and glycolipids) [10]. Figure 1 below shows the analysis of the averages of the variation in reducing sugars content as a function of variety and position.
From Figure 1, it is assumed that position and variety have an influence on the variation in total sugar content and that the Dr and Sl varieties appear to contain the most total sugars. To confirm or disprove this assumption, we will perform an analysis of variance in the figure below.
According to the results of this variance (Figure 2), we confirm the existence of the variation of the total sugar content according to position and variety. In relation to the position, there are differences at the level of the varieties (Bk, Dr and Knt). For the Bk variety the total sugar content according to its bottom position is 45 mg/100 mL) whereas for Bk its total sugar content according to the intermediate and top positions is 40 mg/100 mL. For the Dr variety, the content at the intermediate position is 63 mg/100 mL while the content at the bottom position is 56 mg/100 mL. The same is observed for Knt variety. In relation to the variety factor, the results show that the Dr and Sl varieties are the richest in total sugars. To prove with certainty the difference between the positions we set the Bottom Status of the Sl variety as a reference in order to model this hypothesis using a GLM (Generalized Linear Model) with a Binomial Negative distribution which is generally best suited for decimal data.
From the results of Table 1, it is confirmed that the total sugar content of the bottom position of the Sl variety is different from those of the others and that the variety Sl is one of the richest varieties in total sugars. So the total sugar contents vary according to variety and position. This study reveals that the varieties: SL, Dr and Bk have significant levels of total sugars that are above the average for varieties found in the literature [11].
3.4. Variation of Reducing Sugar Content According to Variety and Position
A monosaccharide is classified as reducing if its open chain form contains an aldehyde function or a free hemiacetal group [12]. Aldoses, monosaccharides containing an aldehyde function that can be oxidized, belong to this family, unlike ketoses, which have a ketone function as shown in Figure 3.

Figure 1. Variation in total sugar content by variety.

Figure 2. Analyses of variance of the total sugar content.

Figure 3. Sugar molecules (Sources: National Institute of Standards and Technology (2011). “Material Measurement Library D-erythro-Pentose, 2-deoxy-”. nist.gov.) [13]

Table 1. Generalized linear model.
According to the Wilcoxon test in Table 2, there are no significant differences in reducing sugar content between the positions of the varieties. In order to confirm or refute the results of this test, we have carried out an analysis of the averages of the variation in reducing sugar contents as a function of variety and position in the following figure.
From the results presented in Figure 4, it seems that there is a difference in the content of reducing sugars, however, the position effect is not visible. To verify this hypothesis, we performed an analysis of variance in the following Figure 5.
The results of this analysis show that only two of the five varieties have one of their positions whose reducing sugar content is significantly different from the other positions: with the Bk variety, the reducing sugar content for its bottom position is 45 mg/100 mL, while for its top and intermediate positions the content is between 29 mg/100 mL and 34 mg/100 mL, and with the Sl variety, the reducing sugar content for its bottom position is 21 mg/100 mL and for its remaining positions it is 29 mg/100 mL. Depending on the variety, there is a very significant variation in the content of reducing sugars. However, the Kt variety is the richest in reducing sugars but compared to the bottom position of the Bk variety, they are statistically identical. The Knt variety remains the poorest in reducing sugars. The three varieties (Sl, Dr and Bk) are richer in reducing sugars. The Knt variety remains the poorest in reducing sugar [11]. This difference in varietal composition has been confirmed by Silva et al. [14] who report that the amounts of soluble sugars vary between cultivars at the end of ripening.
Table 2. Wilcoxon test.

Figure 4. Variation in reducing sugar content by variety.

Figure 5. Analysis of variance of reducing sugar content.
4. Conclusions
Sugars are substances widely present in plants and especially in fruits. In this study, we studied the variation of the contents of these substances according to the variety and according to the position where the fruit has been picked.
According to this study, sugar levels can vary depending on the variety of mango or the position where the fruit is harvested. Compared to the contents of reducing sugars, this variation is observed according to varieties and the position effect is less pronounced. However, for total sugars, their contents vary according to the two factors (variety and position). This study reveals that local varieties (Sl and Dr) are rich in total and reducing sugars. This result shows that these two varieties must be taken into account by mango stakeholders in Senegal. To go further, it is necessary to try to understand why these contents vary according to the varieties and why some varieties of mango in Senegal are richer in sugars than others?
Conflicts of Interest
The authors declare no conflicts of interest regarding the publication of this paper.
Cite this paper
Ibrahima, B., Mouhamadou, F. and Moussoukhoye, D. (2020) Study of the Variation in Total and Reducing Sugars Contents According to the Variety and According to the Position Where the Fruit (Mango) Was Harvested from Five Mango Varieties Exploited in Senegal. Journal of Biosciences and Medicines, 8, 28-36. https://doi.org/10.4236/jbm.2020.83004
References
- 1. World Health Organization (2002) World Health Report—Reducing Risks, Promoting Healthy Life. Geneva.
- 2. World Health Organization (2003) Report of a WHO/FAO Expert Consultation, Diet, Nutrition and the Prevention of Chronic Diseases. Geneva.
- 3. https://www.senegal-export.com/exportation-de-la-mangue,147.html
- 4. Djioua (2010) Improvement of the Preservation of 4th Range Mangoes by Applying Heat Treatments and Using Modified Atmosphere Preservation. Thesis of the University of Avignon, p. 169.
- 5. https://sante.journaldesfemmes.fr/calories/classement/aliments/glucides
- 6. La Montagne, Patricia and Hamel, Denis (sous presse) (2014) Surveillance du poids corporel chez les adultes québécois agés de 18 à 74 ans: données mesurées, Institut national de santé publique du Québec.
- 7. Programme International sur la Sécurité des Substances Chimiques (1995).
- 8. Lee, Shallenberger and Vittum (1970) Sucres libres dans les fruits et legumes. J. Food Science and Technology, p. 1.
- 9. NAL USDA National Nutrient Database (2013-2014).
- 10. (2001) Les structures O-glycanes de Huang et Khoo ont été élucidées et présentent également une réactivité croisée avec les glycoprotéines et les glycolipides des parasites, ainsi qu'avec les N-glycanes, et ont également été décrites pour certaines, p. 412.
- 11. Pierson, J.T., Monteith, G.R., Roberts-Thomson, S.J., Dietzgen, R.G., Gidley, M.J. and Shaw, P.N. (2014) Phytochemical Extraction, Characterisation and Comparative Distribution across Four Mango (Mangifera indica L.) Fruit Varieties. Food Chemistry, 149, 253-263. https://doi.org/10.1016/j.foodchem.2013.10.108
- 12. Campbell, Farrell and Biochimie (2012) états-Unis: Mary Finch. p. 459.
- 13. National Institute of Standards and Technology (2011) Material Measurement Library D-Erythro-Pentose, 2-Deoxy. nist.gov.
- 14. Silva, A.P.F.B., Nascimento, J.R.O., Lajolo, F. and Cordenunsi, B.R. (2008) Starch Mobilization and Sucrose Accumulation in the Pulp of Keitt Mangoes during Postharvest Ripening. Journal of Food Biochemistry, 32, 384-395. https://doi.org/10.1111/j.1745-4514.2008.00175.x