Open Journal of Business and Management
Vol.2 No.2(2014), Article ID:45484,6 pages DOI:10.4236/ojbm.2014.22014
Measuring the Correlation between Commercial and Economic States of Countries (B2G Relations) and the E-Government Readiness Index by Using Neural Networks
Mehmet Sinan Başar1, Hande Küçükönder2
1Open Education Faculty, Ataturk University, Erzurum, Turkey
2Faculty of Economics and Admninistrative Sciences, Bartın University, Bartın, Turkey
Email: sinanb@atauni.edu.tr, hkucukonder@gmail.com
Copyright © 2014 by authors and Scientific Research Publishing Inc.
This work is licensed under the Creative Commons Attribution International License (CC BY).
http://creativecommons.org/licenses/by/4.0/


Received 23 January 2014; revised 23 February 2014; accepted 27 March 2014
ABSTRACT
The E-government Readiness Index is a composite index created from the Neural Index, the Telecommunication Infrastructure Index and the Human Resources Index. Calculated annually by the World Bank, this index offers information on such issues as the provision of public services and the use of these services by individuals and institutions. In this study, we examine whether the E-government Readiness Index provides information on the compliance of the business lives of countries with an e-government structure by using neural networks.
Keywords:Neural Networks; E-Government; E-Government Readiness Index; E-Commerce; Information Technologies

1. Introduction
In the widest sense, e-government describes the use of information and communication technologies in all kinds of public works in an effective and timely manner to save time and money. E-government can also be defined as performing public works online. The European Commission defines E-government as “closer relations between government and citizens and businesses” (Information Society) [1] . This close relation, undoubtedly, is parallel to the technological advancements. The role of technological advancement in this close relation is important. Improvements in information technology and particularly the widespread use of the Internet have resulted in significant changes in the relations between governments and individuals and governments and institutions. These changes include an ever-growing distribution of services and fast and effective participation of citizens in the transformation of administration and governance [2] . E-government can be defined as the use of the Internet and information technologies for internal or inter-institutional communications between government and citizens, government and the business world, government and the private sector, and government and other governments [3] . In the “interaction” process, two or more sides have an effect upon one another. Thus, the e-government process cannot be regarded as complete with the compliance of citizens in this process. Institutions that interact with each other also have to comply with the relevant e-government structure. Consequently, public institutions, business environments, non-governmental organizations, and citizens should reorganize themselves, and traditional approaches should be restructured with information and communication technologies. As in conventional government structures, different individuals and institutions might perceive e-government in different ways. In this sense, the concept of e-government is related to how individuals perceive e-government. The definition of e-government might be different for people of different positions and jobs.
To measure countries’ state of readiness for e-government and their position among other countries, a scale was developed. This scale, which is assessed and announced by the United Nations, is called the E-government Readiness Index. This composite index is assessed based on Web site assessment, telecommunication infrastructure, and human resources endowment. For the Web site index the level of development of services provided on public Web sites is measured particularly by health, education, social security, and finance, which is in the first place. The Telecommunication Infrastructure Index is calculated based on six basic infrastructural indicators. These indicators are: PC’s per 1000 persons, Internet users per 1000 persons, Telephone Lines per 1000 persons, Online population, Mobile phones per 1000 persons and TV’s per 1000 persons. The Human Capital Index is measured based on two indicators. These are: adult literacy and the rate of students enrolled in primary, secondary, and higher education institutions [4] . Once this E-government Readiness Index has been calculated using the above-mentioned indicators, countries can figure out where they stand in this process by looking at former samples. Reaping the benefits of their services provided within a plan is a justifiable source of pride for countries as a representation of their technological competitive power and development level, because e-government structuring not only keeps up with technology but with technological improvement. Fundamentally, it is a system demanded and structured via social, economic, and cultural development. Thus, the E-government Readiness Index is not only a technological index but also an indicator of development in all fields.
The E-government Readiness Index can be an indication of the delivery of public services and the utilization of these services by individuals and institutions as well as an indication of whether social, commercial, and cultural lives, for example, are organized in compliance with e-government or not. However, assessing the degree of this relation requires a separate study for each variable.
2. Materials and Method
2.1. Neural Networks
Neural networks (NN) are a kind of computer software, which is inspired by the working mechanism of the human brain and which is composed of a set of process elements, each of which has its own memory and processes data. A neural network is composed of three main structures. These are neurons, neuron connections and learning algorithms. Also in neural networks, which are designed by imitating the characteristics of biological neural nerve cells, the processing mechanism of the data is designed as input, interlayer, and output [5] . The structure of an artificial neuron is shown in Figure 1.
The structure that artificial neurons make up as layers and in parallel with each other constitutes the overall structure of NN. These layers have three components: input, interlayer, and output. The overall structure of neural networks is shown in Figure 2.
When the overall structure of neural networks is analyzed, it is seen that the neurons in the input layer serve as receiving data for processing, and the interlayers serve as supporters of processing data and opening up to the outer environment. The data processed, on the other hand, is revealed to the outer environment through the output layer.

Figure 1. Structure of an artificial neuron [5] .
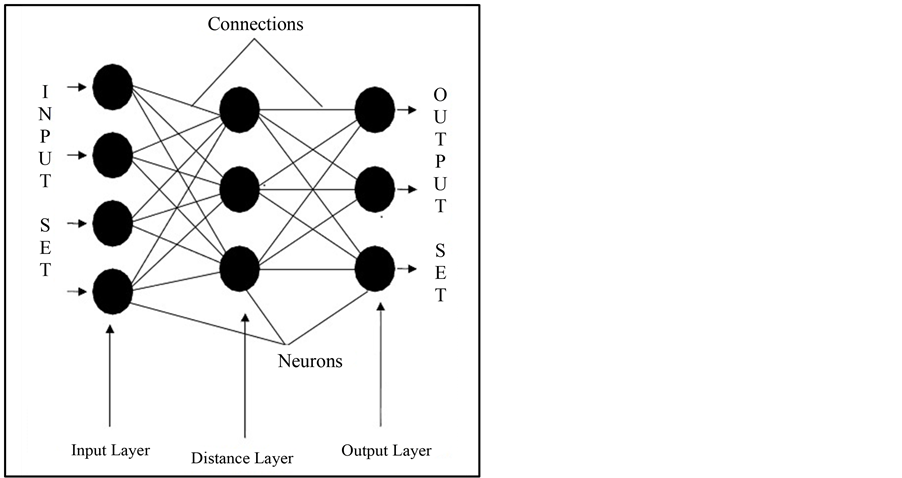
Figure 2. Overall structure of neural networks [6] .
2.2. Data
The data used as independent variables in this study are taken from the World Bank’s Enterprise Survey’s Indicators data set [7] . Enterprise Surveys provide the world’s most comprehensive company―level data in emerging markets and developing economies. Data are used to create indicators that benchmark the quality of the business and investment climate across countries. The dependent variable E-government Readiness Index values of the study are acquired using World Bank data [8] .
After the table creating with the values of all variables and removing the lines with missing data, E-government Readiness Index values of 60 countries and 13 independent variables included in the model.
The independent variables used in this study are listed below:
• Average wait, in days, experienced to obtain import license from the day the establishment applied for it to the day it was granted.
• Average number of days to clear direct exports through customs.
• Average number of days to clear imports from customs.
• Percentage of establishments that consider Access to Finance as a major obstacle.
• Percentage of establishments that consider Access to Land as a major obstacle.
• Percentage of establishments that consider Licenses & Permits as a major obstacle.
• Percentage of establishments that consider Customs & Trade Reg as a major obstacle.
• Percentage of establishments that consider Electricity as a major obstacle.
• Percentage of establishments that consider Inadequately educated workforce as a major obstacle.
• Percentage of establishments that consider Political instability as a major obstacle.
• Percentage of establishments that consider Tax Rates as a major obstacle.
• Percentage of establishments that consider Transportation as a major obstacle.
• Number of sectors.
3. Findings
MAPE statistics carry a meaning of their own since they express the estimation values in percent (%) and are considered superior to other statistical values. Witt and Witt classified estimation models below 10% MAPE value as “highly accurate forecasting” and those models between 10% and 20% MAPE values as “accurate forecasting” models [9] . Similarly, based on MAPE value [8] classified models as “best” (less than 10%), “good” (10% - 20%), “acceptable” (20% - 50%) and “false” more than 5012 different parameters were defined to e-government data as input data; the interlayer number was set as 1; and the number of neurons in the interlayer was set as 4 in the neural network. And in that case, the network architecture was designed as 13-4-1. Gradiant Descent Algorithm (GD) was used as the learning algorithm of the network. The training of this designed network was done in 1000 iterations. The training of the network ended with the completion of iteration and the following results were obtained.

The structure of the Neural Network is shown in Figure 3.
Output graphics of error values calculated according to GD algorithm is shown in Figure 4.
4. Results
The study’s findings, conducted according to MAPE values, will be assessed to compare the performance criteria. The MAPE values are calculated as 14.5918% for training, 23.7152% for test data, and 19.5979% for the validity data set. These results indicate that the model is well trained and is the right estimation model [10] [11] . It is revealed that GD algorithm used in NN completed network training as “good” and that the NN forecast re-

Figure 3. Structure of the neural network.

Figure 4. The alteration graphics of the error values.
sults obtained converged the minimum error to actual observation values. It can be said that in this instance, NN provided rather successful results. Thus, it can be concluded that the commercial and economic life in countries where the E-government Readiness Index value is high, is better organized, and those countries have more effective relations with public institutions than those countries where index values are low.
References
- Maeve, P. (2006) Local E-Government and Devolution: Electronic Service Delivery in Northern Ireland. Local Government Studies, 32, 41-53.
- Roy, J. (2006) E-Governmnet in Canada: Transformation for Digital Age. Ottawa University of Ottawa Press, Ottawa, 69.
- Silcock, R. (2001) What Is E-Government. Parlimentary Affairs. 54, 88 http://dx.doi.org/10.1093/pa/54.1.88
- http://unpan3.un.org/egovkb/egovernment_overview
- Haykin, S. (1999) Neural Networks, a Comprehensive Foundation. 2nd Edition, Prentice-Hall Inc., New Jersey.
- Yildiz, B. (2001) Finansal Basarısızlığın Öngörülmesinde Yapay Sinir Ağı Kullanımı ve Halka Açık Sirketlerde Ampirik Bir Uygulama. İMKB Dergisi, 17, 54.
- http://www.enterprisesurveys.org
- http://www.worldbank.org
- Witt, S.F. and Witt, C. (1992) Modeling and Forecasting Demand in Tourism. Academic Press, London, 137.
- Lewis, C.D. (1982) Industrial and Business Forecasting Methods. Butterworths Publishing, London, 40.
- Misra, D.C. (2007) Defining E-Government: E-Citizen Centric Criteria-Based Approach. http://unpan1.un.org/intradoc/groups/public/documents/apcity/unpan026250.pdf