Open Journal of Genetics
Vol. 2 No. 4 (2012) , Article ID: 26311 , 12 pages DOI:10.4236/ojgen.2012.24025
Assessment of a new strategy for selective phenotyping applied to complex traits in Brassica napus
![]()
1Institut National de la Recherche Agronomique, UMR1349, Institut de Génétique, Environnement et Protection des Plantes, Le Rheu, France
2Centre Technique Interprofessionnel des Oléagineux et du Chanvre, Centre de Grignon, Thiverval-Grignon, France
3Agrocampus Ouest, UMR1349, Institut de Génétique, Environnement et Protection des Plantes, Rennes, France
4Université Européenne de Bretagne, Rennes, France
Email: Regine.Delourme@rennes.inra.fr
Received 25 September 2012; revised 24 October 2012; accepted 22 November 2012
Keywords: Selective Phenotyping; QTL; Brassica Napus; Leptosphaeria maculans
ABSTRACT
The accurate mapping of quantitative trait loci (QTL) depends notably on the number of recombination events occurring in the segregating population. The cost of phenotyping often limits the sample size used in QTL mapping. To get round this problem, we assessed a selective phenotyping method, called qtlRec sampling. In order to improve the accuracy of QTL mapping, a subset of individuals was selected to maximize the number of recombination events at putative QTL positions; the usefulness of this subset was compared to a selected sample built to maximize the recombination rate over the whole genome. We assessed this method on the quantitative oil content trait in Brassica napus. We showed that the qtlRec strategy could allow increasing accuracy (both support interval and position) of QTL location while it maintained a similar power of detection. We then applied this approach to the B. napus—Leptosphaeria maculans pathosystem for which resistance QTL with minor effect were previously identified. This allowed the validation of the QTL in six genomic regions. The qtlRec method is an attractive strategy for validating QTL in multiple year and/or location trials for a trait which requires costly and time-consuming phenotyping.
1. INTRODUCTION
Many traits in plants as well as animals and humans are complex and controlled by quantitative trait loci (QTL). The genetic analysis of these complex traits showed that most reported QTL correspond to large genomic regions covering 10 to 30 centiMorgans (cM), which usually include several hundred genes [1,2]. These large support intervals are a major limitation to the use of QTL in breeding programs through marker-assisted selection (MAS). Indeed, the larger the support interval, the greater the risk that the QTL will be lost or undesirable genes will be introgressed. The number of recombination events is a determining factor for mapping QTL accurately. However, the type and restricted size of populations (F2, doubled haploids…) commonly used to detect and map QTL in plants limit these events. One solution is to use populations with much larger numbers of individuals but then it is time consuming and costly, both financially and in terms of human means, to genotype markers and/or phenotype traits and this can limit this approach.
To get round these problems, different methodologies were developed to either improve the experimental design or use more efficient statistical methods. Among the different possibilities, the use of phenotypically (selective genotyping), or genotypically (selective phenotyping) selected samples can improve QTL mapping precision in comparison to random samples of the same size. Selective genotyping (SG) [3,4] consists in selecting the most phenotypically informative progeny out of the whole population: only the individuals from the extremes of the phenotypic distribution are genotyped. Several authors refer to the success of this method applied with classical QTL detection methods (e.g. [5]) or combined with methods of QTL detection based on linkage disequilibrium, so-called association mapping (e.g. [6]). However, SG offers less benefit for a quantitative trait which is mediated by a large number of QTL with small effects than for a trait controlled by a few QTL with large effects when selection is made on rather small populations (<500 individuals) [7]. Selective phenotyping (SP), used when trait phenotyping is costly, consists of selecting a subset of the most informative individuals based solely on genotypic data from a large population. Brown and Vision [8] developed the MapPop software which proposes to select a reduced subset of the most informative individuals, based on the number and position of crossover sites detected from the genotype data. This selection should optimize the distribution of recombination points all over the genome. The effect of this selection procedure on QTL detection was evaluated in simulation [9] and empirical studies in different plants such as Arabidopsis [10], barley [11], maize [12] or pepper [13]. With the same objective, other authors proposed, through simulation studies, methods to select 1) individuals which maximize their genotypic dissimilarity using markers across the entire genome, markers on the chromosome that contained a known QTL or a single marker near the QTL [14]; 2) the individuals with a maximal number of recombination events considering (uniRec) or not (maxRec) the uniformity of their distribution across the genome [15]. Methods based on genetic dissimilarity are intended to improve the power of QTL detection whereas methods based on recombination rate are intended to improve the accuracy of QTL detection. In all cases, the sample size, selected or not, affects QTL detection. As previously shown, the larger the population, the more accurate the QTL detection [16]. However, a selected population brings more power and precision to the detection process of QTL with small effects in comparison to an unselected sample of the same size, and it can reduce the number of false positive QTL [9].
Until now, SP methods were applied to refine the position of major QTL (e.g. [17]) or using a selection based on the entire genome without prior information on putative QTL positions. The previous simulation studies using prior information on QTL position for selection were rather simplistic (one QTL) or involved ideal situations which are rarely representative of reality: No missing data, a small genome, few QTL identified… In this context, we investigated the potential interest of a SP method using a sampling strategy based solely on QTL markers, in a case where many QTL were identified. This strategy intends to improve the accuracy of QTL mapping (position and support interval) by choosing the individuals that maximize recombination at QTL markers and could thus be used for the efficient validation of QTL in different environments for a trait that is phenotyping-costly. The method would then consist in selecting a sample of individuals from a large population which has been totally genotyped and phenotyped in a single environment for a first QTL detection. In order to test this strategy, we used an oilseed rape (Brassica napus L.) segregating population derived from the cross “Darmor-bzh” x “Yudal” (DY). It included 442 doubled haploid (DH) lines that were genotyped and phenotyped in three experiments and used for seed oil content QTL identification [18]. We selected a subset of individuals which maximizes the number of recombination events in nine previously detected QTL regions [18]. An approximate selection rate of 50% was applied since Jin et al. [14] showed that, for a trait showing high heritability, selectively phenotyping of 50% of the entire progeny retains most of the information needed for QTL detection. In order to evaluate the impact and relevance of our sampling strategy, we compared the power and accuracy of QTL detection in the selected and whole populations as well as in a sample selected using the method implemented in MapPop software.
Since we showed that this methodology could improve QTL accuracy, we then applied it to oilseed rape quantitative stem canker resistance. Actually, phenotyping of this trait entails substantial financial costs and human means. The stem canker disease caused by the fungus Leptosphaeria maculans is an internationally important disease of oilseed rape causing serious losses in Europe, Australia and North America [19,20]. Both qualitative and quantitative resistance were identified in B. napus or in related species and are reviewed in [21,22]. In previous studies, our search for quantitative resistance factors has focused on one source of resistance, the variety “Darmor”, for which resistance QTL were detected in two genetic backgrounds [23,24]. From the above whole DYDH population, 152 DH lines were originally used for stem canker resistance QTL detection [24]. We applied our sampling strategy based on eight stem canker QTL regions identified in this previous study and we also compared the power and accuracy of QTL detection with this second complex trait.
2. MATERIAL AND METHODS
2.1. Plant Material
The segregating DH population used in this study is derived from the “Darmor-bzh” x “Yudal” cross and consists of 442 DH lines including 225 tall and 217 dwarf lines, available at INRA (Le Rheu). This material was obtained as described in [25]. “Darmor-bzh” is a dwarf isogenic line resulting from the introduction of the dwarf bzh gene in the French winter cultivar “Darmor”. “Yudal” is a spring Korean line that behaves as an earlyflowering winter type in temperate climates. “Darmorbzh” and “Yudalv” are resistant and susceptible to L. maculans, respectively.
2.2. Selection of Subpopulations
For oil content, a total of nine QTL regions on eight linkage groups (A1, A3, A6 (two regions), A10, C2, C3, C5 and C6) were chosen from a previous study [18]. A subset of individuals which maximized recombination at QTL positions was selected from the 442 DYDH population. For this, each DH line was recorded as recombined (1) or not (0) at each QTL position. At each position, a DH line was recorded as recombined if a recombination occurred between the markers located in the confidence interval of the QTL. The sum of the number of recombined regions per DH line was used to select the DH lines with the maximum recombination rate over all the QTL regions. We refer to this methodology as qtlRec, in reference to the uniRec or maxRec methods of Jannink [15]. The subpopulation consisted of 200 DH (called “qtlRec sample”). In order to compare our sampling strategy with that based on the number of recombination events throughout the genome, another subpopulation of 200 DH (called “MapPop sample”) was chosen out of the same full population of 442 DH, using the MapPop 1.0 software [8]. The selection criterion applied to identify the most informative lines was the expected maximum bin length (eMBL), i.e. the expected maximum distance between two recombination points. eMBL for the MapPop population was 8.95 cm compared to 6.83 cm for the whole population. For stem canker resistance, a total of nine regions on eight linkage groups (A2, A6, A7, A8, A9, C2, C4 (two regions) and C8) were chosen from previous results [24]. Two “qtlRec” samples were selected from the same 442 DH population: A 150 DH “qtlRec” sample (“150Q”) which was compared to the 150 DH previously studied sample [24] (“150R”) and a 200 DH “qtlRec” sample (“200Q”) to get the same selection rate as for oil content. As 118 DH lines were present in all sub-populations, the whole population used in this study for stem canker resistance consisted of 279 DH. Based on the results obtained with the qtlRec method (see Results section) on oil content, no MapPop sample was used for stem canker trait.
2.3. Genetic Markers and Maps
For the DY population, the published maps [23,26,27], that were recently updated [28], were used as a starting point to choose the markers and build the DY genetic map. In addition, physical functional markers (prefixed “CZ”), obtained through a Genoplante project in collaboration with INRA-Evry France (coll. H. Belcram and B. Chalhoub, unpublished data; primers are available upon request to Genoplante) were used. PCR assays were conducted essentially as described in [18]. In all, a set of 549 markers was chosen according to the map coverage and the number of missing genotyping data.
The linkage groups (LGs) were built from the whole population using the 549 chosen markers and a LOD threshold of 5.0 with Mapmaker/Exp 3.0 software [29]. Genetic distances expressed in centiMorgan (cM) between markers were estimated with the Haldane function [30]. This map was used for QTL detection in all subpopulations. However in order to evaluate the effect of selective sampling, the size of the LGs determined with the different samples was compared using a student test applied on the differences between the lengths of each LG (α = 0.01).
2.4. Field Experiment for Stem Canker
A field experiment with the 279 DH lines of the DY population was conducted at one location (INRA Experimental unit, Le Rheu, France) using an design with three replicates in 2006-07. The 129 dwarf and 150 tall lines were arranged in separate trials. Control lines as well as the parental lines were included in both trials. The controls were winter-type B. napus cultivars showing different levels of L. maculans resistance: “Jet Neuf” (resistant), “Darmor” (resistant), “Falcon”(partially resistant), “Eurol” (moderately susceptible). Infected rapeseed stubble collected from the previous year’s trial was scattered through the field to increase inoculum pressure.
The stem canker severity was evaluated for each line as in [24]. Forty plants per plot were uprooted and crown canker was assessed on a 1 - 6 scale as follows: 1 = no disease, 2 = 1% - 5%, 3= 6% - 50%, 4 = 51% - 75%, 5 = 76% - 100% of crown section cankered. An additional disease score category of 6 was used to indicate plants broken at the crown from severe canker. All crown canker data were transformed to a standardized 1 - 9 disease severity scale using the formula: G2 index = [(N1 * 0) + (N2 * 1) + (N3 * 3) + (N4 * 5) + (N5 * 7) + (N6 * 9)]/Nt where N1, 2,…6 = the number of plants with a canker score of 1, 2,…6, respectively, and Nt = the total number of plants assessed.
2.5. Statistical Analyses for Stem Canker Trial
For each dwarf and tall DH trial, the analysis of variance (ANOVA; proc GLM of statistical Analysis System, SAS, [31]) partitioned total variation into line, replicate and error effects (Pij = µ + Li + Rj + eij where Pij is the G2 disease index of the ith line located in the jth replicate, µ the mean of all data, Li the line i effect, Rj the replicate j effect and eij the residual). The trial effect was also tested from data on the control varieties. Heritability (h2) was estimated for the whole DH population with the formula: h2 = sg2/[sg2 + (se2/n)] with sg2 the genetic variance, se2 the environmental variance and n the number of replicates.
2.6. QTL Mapping
The mean seed oil content in three experiments (RE01: Rennes 2001; RE02: Rennes 2002; SE02: Lille 2002) as calculated by Delourme et al. [18] and the mean disease index for stem canker calculated over the three replicates of this study were used for QTL mapping. QTL detection was performed for each population and trait using composite interval mapping (CIM) implemented in Windows QTL Cartographer 2.5 [32]. A forward-backward stepwise regression analysis was used with Pin/out = 0.05 and QTL were detected using CIM procedure, with 10 cofactors and a 10 cm window size. The graphic of each LG carrying QTL was generated with MAPCHART 2.2 software [33]. Only the genetic map obtained with the whole population was drawn and the QTL identified in all populations were projected on this same map. We used the LG nomenclature proposed by the Multinational Brassica Genome Project Steering Committee. The QTL were named according to their location on each LG [27] for stem canker resistance, i.e. QLmA9 for QTL of resistance to L. maculans located on the LG A9, and according to their location and the trial for seed oil content, i.e. OilRE01A9 for QTL located on the LG A9 and detected in RE01 trial.
2.7. Comparison of QTL Analyses between Suband Whole Populations
To estimate the effect of our qtlRec selective sampling, we compared different parameters between the populations: The QTL detection power estimated with the sensitivity and specificity criteria and the support interval of the QTL.
We adopted the following conventions: A QTL peak was defined at the maximum LOD value and the support interval was defined as the interval where the LOD score decreased of one LOD unit on both sides of the maximum. We assumed that QTL detected in the whole population were true QTL. If the support interval of a QTL mapped in the subpopulations overlapped with a true QTL, it was considered as a true positive QTL (TP); if not, it was considered as a false positive (FP). If a QTL was detected in the whole population but not in a subpopulation, it was considered as a false negative (FN) in the subpopulation; in contrast, if a QTL was not detected in the whole population but was detected in the subpopulation, it was considered as a false positive QTL (FP). According to these postulates, we defined the specificity and sensitivity criteria closely related to the detection power, as previously proposed by many authors (e.g. [14]). The specificity was defined as the proportion of true QTL among all QTL detected within each subpopulation. The sensitivity is the proportion of true QTL detected in a subpopulation compared to the total true QTL detected in the whole population. The specificity (Sp) and the sensitivity (Sn) were calculated as follows:

3. RESULTS
3.1. Genetic Maps Used for Oil Content Analyses
The size and the average space between markers on each LG for the qtlRec, MapPop and whole populations are shown in Table 1. The size of the genetic map obtained in the MapPop sample was significantly (P < 0.01) larger (3914.2 cm) than the one obtained on the qtlRec subpopulation (Total map size = 3525 cm), which is consistent with our strategy of selecting individuals that maximize recombination on the whole genome or at previously identified QTL to built these two populations. The size of the genetic map in the whole population was lower (3292.3 cm) than in the two subpopulations (qtlRec and MapPop samples), as expected.
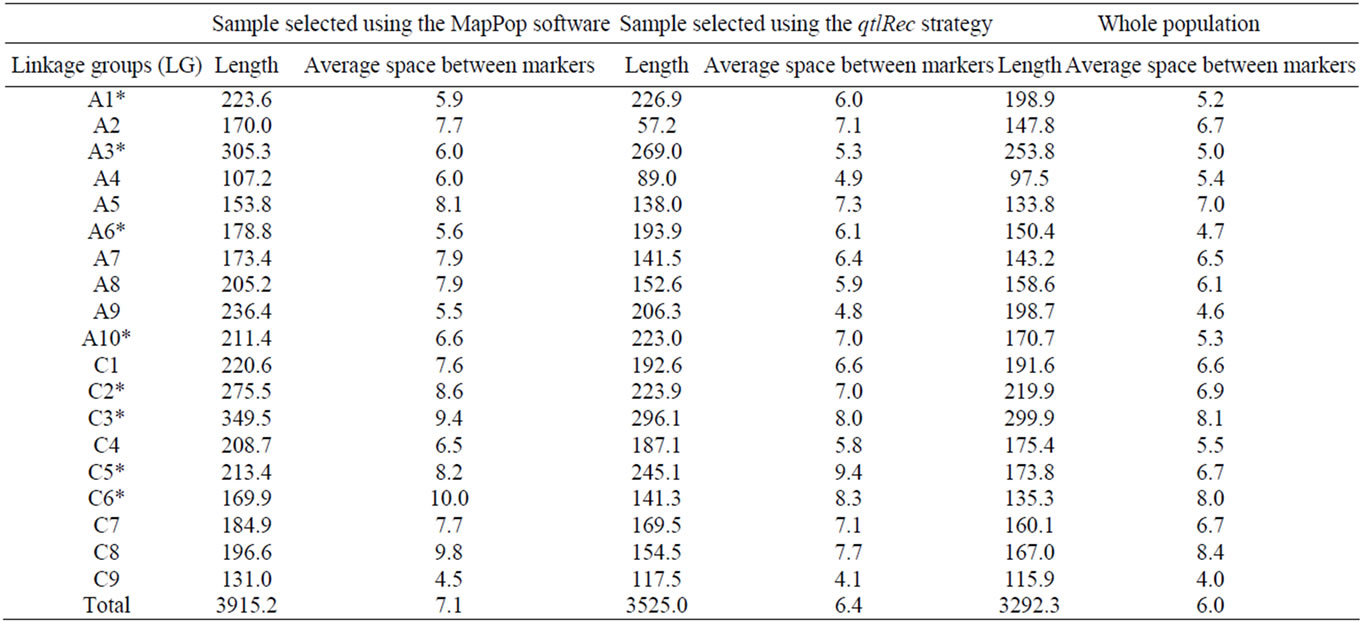
Table 1. Length and average space (in Haldane cM) between markers on each linkage group (LG) for each sub-population and the whole population derived from the cross “Darmor-bzh” x “Yudal”. LGs used for selecting the qtlRec sample are indicated by an asterisk.
3.2. Additive QTL Detection in the Whole and Sub-DH Populations for Oil Content
We observed the same continuous distribution pattern in the whole, MapPop and qtlRec samples. No significant difference was found between the sub-population means or between the sub-populations and the whole population means. This confirms that the selection based on the genotypic data had no effect on the phenotypic distribution.
The results of the CIM analyses for the whole and sub-DH populations are summarized in Table 2. LOD thresholds of 3.0 (for the whole and qtlRec populations) and 3.1 (for the MapPop population) were obtained after 500 permutation tests. However, QTL at LOD 2.5 were also considered since most of them colocalized with QTL detected at other LOD thresholds in the other populations or for the other variables. QTL mapping performed on the 442 DH lines globally revealed 35 QTL for the three variables (OilRE01, OilRE02 and OilSE02), distributed on 14 LGs. Of these, 25 QTL were located in the regions that were used for qtlRec sampling. In the MapPop and qtlRec populations, 20 and 19 QTL were identified on 12 and 10 LGs, respectively. The overallexplained phenotypic variation was estimated at 46.5%, 51.9% and 44.4% in the whole, the MapPop and the qtlRec populations, respectively.

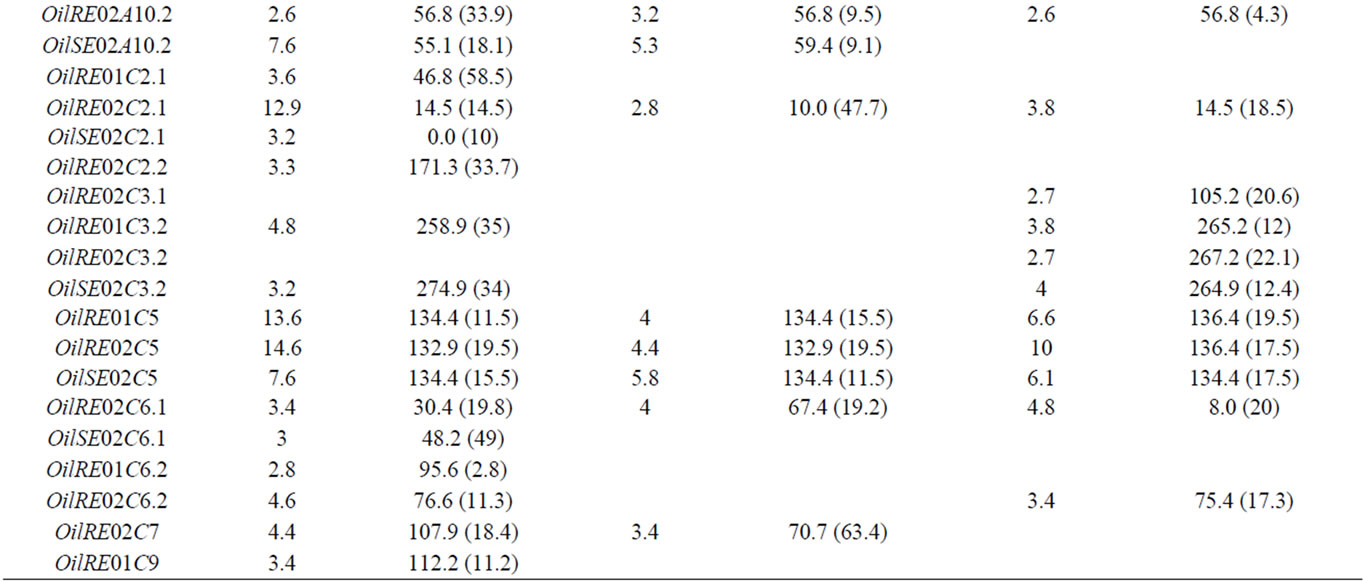
Table 2. The oil content QTL detected on the linkage groups of the “Darmor-bzh” x “Yudal” DH populations: LOD score, peak position and support interval (SI) in cM for each QTL.
In order to compare the effect of our sampling strategy, we considered true QTL as those that were detected in the whole population. Out of the 35 true QTL, 13 QTL were detected at the same position as the true QTL in the two sub-populations (on LGs A1, A2, A3, A6, A10, C5 and C6). Thirteen true QTL were detected in none of the subpopulations. Four and five true QTL were detected either in qtlRec or in MapPop sub-populations. This was summarized by the two parameters (sensitivity and specificity) used to evaluate the significance and reliability of the selected samples in comparison to the whole sample. Sn was estimated on average at 0.48 and 0.51 and Sp was estimated on average at 0.91 and 0.88 for the qtlRec and MapPop populations, respectively (Table 3).
QTL support intervals were compared in seven regions that were used for selective sampling and where QTL were identified in the whole and the selected populations. In these selected regions, the recombination rate in the qtlRec sub-population was either equal or higher than in the MapPop one but on C2 and C6 LGs (Figure 1). As these regions were detected in one, two or three environments, they included 12 QTL in all. The support interval was lower in the qtlRec than in the MapPop subpopulation in six QTL (on LGs A1, A3, A6 and C5). In that case, it was equal to the support interval obtained in the whole population except for OilRE01A2 QTL (Figure 1). In four cases (OilRE01A1, OilRE02A6.2, OilRE02C5 and OilRE02C6.1), the same support interval was obtained in the MapPop, the qtlRec and the whole populations. For the two remaining regions, either qtlRec and MapPop support intervals were lower than whole population one (OilRE02A6.2) or qtlRec support interval was higher than MapPop and whole population ones (OilRE02C2.1).
3.3. Phenotypic Evaluation for Stem Canker Resistance
The 279 DH lines of the “Darmor-bzh” x “Yudal” whole population, as well as the parental lines and control varieties, were evaluated for their resistance to L. maculans

Table 3. Number of true positive (TP), false positive (FP) and false negative (FN) QTL, criterion of sensitivity (Sn) and specificity (Sp) in the qtlRec (Q) and MapPop (M) selected populations in comparison to the whole population with LOD threshold 2.5
 (a)
(a) (b)
(b)
Figure 1. (a) Representation of the recombination increase in seven selected QTL regions: The size of the regions was estimated (in cm) on the whole population and on the MapPop and the qtlRec sub-populations after seletion. (b) Length of the support interval for the QTL detected in these selected regions on all the populations.
in two separate field trials, one for the dwarf and one for the tall DH lines. ANOVA within each trialshowed significant (P < 0.001) phenotypic variation among lines and replicates. ANOVA performed on the control varieties from the two trials showed no significant trial effect and the average disease indexes of each trial (4.52 and 4.74 for the dwarf DH trial and the tall DH trial, respectively) were not significantly different (P = 0.09). Therefore, the phenotypic data from the two trials were pooled and the mean of three replicates was used for the following analyses. The heritability was very high: h2 = 0.93, as estimated in the whole population. The parental lines “Darmor-bzh” and “Yudal” showed a mean G2 disease index of 1.46 +/– 0.29 and 7.72 +/– 0.45, respectively. The control varieties showed a level of resistance to L. maculans, which was consistent with expected levels (“Jet Neuf”: G2 = 0.99 +/– 0.20; “Darmor”: G2 = 1.34 +/– 0.15; “Falcon”: G2 = 2.71 +/– 0.56; “Eurol”: G2 = 4.43 +/– 0.75), illustrating the high inoculum pressure. Resistance throughout the whole DH population showed a continuous distribution pattern (Figure 2), confirming the quantitative and polygenic control of the resistance observed in previous studies [23,24].
We observed the same continuous distribution pattern in the random and qtlRec samples (Figure 2). No significant difference was found between the sub-population means or between the sub-populations and the whole population means. This confirms that the selection based on the genotypic data had no effect on the phenotypic distribution.
3.4. Additive QTL Detection in the Whole and Sub-DH Populations for Stem Canker Resistance
The results of the CIM analyses for the whole (279 DH) and subpopulations (150R, 150Q and 200Q) are summarized in Table 4 and Figure 3. LOD thresholds of 2.8 (for the whole population) and 3.1 (for thesub-populations) were obtained after 500 permutation tests. As for oil content, a LOD threshold of 2.5 was retained for the comparisons. QTL mapping performed on the whole population revealed ten QTL over nine LGs. The estimated phenotypic variation explained by individual QTL varied from 2.5% to 15.5% and the overall explained phenotypic variation was 48.4 %. In the 150R random population, seven QTL were identified on seven LGs. The estimated phenotypic variation explained by individual QTL varied from 4.5 to 15.2% and the overall explained phenotypic variation was 55.4%. In the 150Q qtlRec population, seven QTL were identified on six LGs.
All the QTL detected were also detected in the 200Q qtlRec population at the same position, except on C4 and A4 LGs. In this latter 200Q population, only one additional QTL was detected on A2 LG. The estimated phenotypic variation explained by individual QTL varied from 3.1% to 9.3% and the overall explained phenotypic variation was 65.6% and 56.5% for 150Q and 200Q populations, respectively. The allele increasing stem canker resistance was derived from “Darmor-bzh” for all the QTL, except for QLmA3.2 and QlmC1 where “Yudal” contributed the resistance allele.

Figure 2. Frequency distribution for the adjusted mean G2 disease index in the “Darmor-bzh” x “Yudal” populations. The arrows show the mean value of the parental lines. The hatched, speckled, dark-grey and black bars correspond to the population taken at random (150R), the qtlRec 150Q and 200Q selected populations and the whole population, respectively.
Table 4. The stem canker QTL detected on the linkage groups of the “Darmor-bzh” x “Yudal” DH populations: LOD score, peak position and support interval (SI) in cM for each QTL.

Figure 3. Additive QTL controlling resistance to L. maculans in the “Darmor-bzh” x “Yudal” whole and subset populations. Only linkage groups carrying resistance QTL are shown. Additive QTL detected in the whole population are indicated by black-colored bars (QLm-T), in the qtlRec selected population by speckled bars (QLm-150Q) and by grid bars (QLm-200Q) and in the random population by hatched bars (QLm-150R). The genetic map was calculated on the population taken at random. The bar length corresponds to the 1-LOD support interval. When more than one QTL affecting a trait was identified for one population and on the same linkage group, QTL are distinguished by different letters. The cumulated distance between two markers is expressed in centimorgans (Haldane).
In order to compare the effect of our sampling strategy, we considered true QTL as those that were detected in the whole population. Ten true QTL were detected, of which five were located in the regions used for sampling the qtlRec population. The power of QTL detection was higher in the whole population than in all selected subpopulations. A single QTL was detected at the same position as the true QTL in all the sub-populations on A7 LG. Four true QTL (QLmA1, QLmA2.2, QLmA9.1 and QLmC7) were detected in none of the sub-populations. Only the 200Q sample allowed the increase of true positive and the decrease of false negative and false positive QTL as shown by the two parameters used to evaluate the significance and reliability of our selected samples. Sn was estimated at 0.30, 0.30 and 0.60 and Sp was estimated at 0.43, 0.43 and 0.75 for the random (150R) and qtlRec (150Q and 200Q) populations, respectively (Table 5).
QTL support intervals (SI) were compared in the regions where QTL were detected in the whole or 150R populations and in the 150Q or 200Q populations (Figure 4). The support intervals were lower in the qtlRec populations than in the random or the whole populations for QlmA3.2, QlmA7, QlmA8 and QlmC8. They were similar to SI estimated in the whole population for QlmA4.1 and QlmC4.1. For QlmA2.1, SI was higher in the qtlRec population than in the random or the whole populations.
4. DISCUSSION
In this study, we present the assessment of a new sampling strategy, referred to as qtlRec. It is based on the selection of individuals which maximize the recombinetion at targeted QTL regions in order to improve the accuracy of QTL location in comparison to a MapPop sample of the same size. This selective phenotyping strategy would be useful when QTL were identified in a preliminary study from a large genotyped population and a further phenotypic evaluation in multiyear/environment trials is required on a limited sample size due to the high

Table 5. Number of true positive (TP), false positive (FP) and false negative (FN) QTL, criterion of sensitivity (Sn) and specificity (Sp) in the random (150R) and the two qtlRec (150Q and 200Q) selected populations in comparison to the whole population with LOD threshold 2.5.

Figure 4. Length of QTL support interval in the whole and the selected populations. Only the regions where QTL were detected in the whole or the 150R and in the 150Q or the 200Q populations are presented in order to perform comparison.
cost of phenotyping. We evaluated the qtlRec sampling strategy on oil content in B. napus for which QTL were identified in a previous study on a large genotyped and phenotyped population. Our study showed that the qtlRec sampling strategy performed as well as the sampling strategy based on MapPop software for the power of QTL detection. It also showed that qtlRec sampling strategy decreased the support interval of the QTL more than the MapPop strategy. We then applied the qtlRec sampling strategy to the quantitative resistance to L. maculans in B. napus, which confirmed its interest with this second complex trait, in comparison to the random sample, and allowed the validation of the QTL in six genomic regions through the phenotyping of a selected sample.
4.1. Effect of Sampling Strategy on the Detection and Mapping of Oil Content QTL
Considering as true QTL those detected in the whole population, we identified 35 true QTL overall the three variables. It was not possible to identify all true QTL in any of the sub-populations. Fifty percent of the true QTL were detected whatever the sampling strategy was. The sensitivity and specificity parameters showed that qtlRec selective sampling led to a similar rate of true positive QTL detection, compared to the MapPop sampling strategy. Overall, we observed that the detection of QTL with low individual effects was particularly affected by both sampling strategies. In both cases, very few false positive QTL were observed. Two of the four identified false positive for OilRE02 variable were located at the position of a true QTL for the other variables, indicating that true positive could also be missing on the whole population. The decrease in the number of true QTL detected was expected when the number of individuals was reduced as previously reported by several authors e.g. [16]. This was also observed by [10-13] who tested a SP strategy with the sampling method implemented in MapPop software. The benefits obtained with a selected sample, especially when specific genetic regions are targeted, were reported by Jin et al. [14]. Even if the authors used a sampling procedure based on genetic dissimilarity, they showed that a selected sample was better than a random sample, particularly, when specific genetic regions were targeted. Thus the power and accuracy of QTL analysis improves when the selection is more finely targeted using prior knowledge. Sen et al. [34] confirmed this but the efficiency of SP decreased as the number of unlinked loci considered increased. According to the authors, when only a small sample can be phenotyped, the efficiency of the SP is still higher compared to random sampling, even when more than ten loci are used for the selection.
Selective sampling based on recombination rates is intended to improve the precision of QTL location. The qtlRec sampling strategy reduced the support interval for six QTL compared to only two for the MapPop sampling strategy, and the two strategies were equivalent for four QTL. Other studies [9,15] referred to the positive potential of the SP method to increase the accuracy of QTL mapping. Indeed, the support interval will be smaller when there are a greater number of recombinant events in the QTL support interval. The six QTL with reduced support interval in the qtlRec sample were located in regions used for selective sampling where the recombination rate was actually higher in the qtlRec than in the MapPop sample.
In our study, the global R² was slightly higher in the MapPop sample than that of the whole and the qtlRec populations. Global R2 depends on the genetic map accuracy, inter-marker distances [35] as well as the number and accuracy of detected QTL. An overestimation of individual R2 values for each QTL was observed when the population size was reduced [11,13], owing to the Beavis effect [36]. The estimations of individual and global R² might be less biased in the qtlRec sample than in the MapPop one due to the improvement of accuracy of some QTL.
4.2. Effect of Sampling Strategy on the Detection and Mapping of Stem Canker QTL
We showed with the oil content trait that the use of a priori knowledge in targeted regions of interest to select the individuals maximizing recombination at QTL positions lead to a similar QTL power detection compare to the MapPop sampling strategy but led to an increase in the accuracy of small effect QTL location. Then, we applied qtlRec sampling to another complex quantitative trait, the stem canker resistance to L. maculans. It seems reasonable to predict that our methodology could have been more effective if the full population (442 DH) had been previously phenotyped in a single environment and the qtlRec selection applied on the QTL regions identified from this larger population. The increase in recombination would have been more highly focused due to an accurate position of the QTL obtained from this large population. However, since we had two phenotyping years available, we were able to choose the regions to use for selection of recombinants and were able to assess the sampling methodology from 2007 experiment, considering the 279 DH population as the reference one for this comparison. Ten true QTL were detected. It was not possible to identify all true QTL in any of the sub-populations. Nevertheless, an increase of sensitivity and specificity was obtained with the 200Q qtlRec sample compare to the random and the 150Q qtlRec samples. More true positive and less false positive were observed in this 200Q qtlRec sample. This result is due to the combined effect of the sampling strategy and of the increase of the size of the population. Some of the false positives observed in 150Q qtlRec sample resulted from a lack of accuracy in the QTL position, as shown in [37], where small population sizes generated a shift or an increase in the support interval of the QTL position. Thus, the QTL considered as false in the 150Q qtlRec population on the A4 and C4 LGs could correspond to the true QTL identified in the whole population, but were poorly located on these LGs. Selective sampling based on recombination rates is intended to improve the precision of QTL location. The support intervals obtained with the 200Q qtlRec sample were either similar or smaller than those obtained with the whole population. For the only QTL that had the exact same location on all the populations (QlmA7), the support interval was lower in the qtlRec samples compared to the random sample, as was desired.
4.3. Consistency of Stem Canker Resistance QTL across the Years
Our analysis confirmed that stem canker resistance is controlled polygenically, mainly by small effect QTL and is a trait with a very high heritability (0.93). These results are consistent with those reported previously. Pilet et al. [34] identified eight and five QTL and estimated the heritability at 0.89 and 0.88 in 1995 and 1996, respectively, in a 150 DH population from the same DY cross which corresponds to our 2007 random population. A second mapping study was then performed on the “Darmor” x “Samourai” (DS) cross [23] and identified five and four QTL on a 134 DH population in 1998 and 1999, respectively, and four QTL on a 185 F2:3 population in 1998. Four regions were consistent across the two crosses (DY and DS) and the four years (1995, 1996, 1998 and 1999) on the A2, C2, C4 and C8 LGs [23].
From our 2007 experiment, QTL were detected on all LGs where QTL were previously identified with the 1995 and 1996 data, except for two LGs. A strong effect QTL was detected on A4 in 2007, which was not identified before. On the A6 LG, a QTL with a strong effect was identified at the Bzh gene position in 1996 but not in 1995 [24] and was not detected in our 2007 study. The dwarf trait seemed to affect the expression or the evaluation of resistance in 1996 but not under the 1995 or 2007 field conditions. This result may be related to a lower level of disease in 1996 than in 1995 and 2007 as hypothesized by [24]. These inter-year differences highlight the interest of testing QTL x environment interactions in order to study the global genetic architecture of quantitative stem canker resistance.
On the LGs where QTL were detected in 2007 and in 1995 or 1996, either the position of 1995/1996 QTL was similar to the QTL considered as true QTL in this study (on A2, A7, A8, and C8 LGs) or was similar to the position of QTL detected in the sub-populations (on A9, C2 and C4 LGs). Thus, the QTL identified in 1995 and/ or 1996 on A9 and C4 LGs [24,27] could have been poorly located as the ones detected in 2007 in the 150R or 150Q sub-populations, due to the low population size. All these QTL were identified in at least two years of experiments. Four were confirmed in the DS genetic background [23]. This number is probably underestimated due to the small size and incomplete map of the DS population. The stability of these QTL across the years is an important factor to take into consideration in breeding programs. The validation of the QTL across different environments and multiple genetic backgrounds also strengthens their interest in Marker-Assisted Selection (MAS). The detection of consistent QTL between our study and previous studies is valuable information for breeding programs for stem canker resistance in B. napus.
In this study, we demonstrated that our sampling strategy, based on the choice of individuals which maximized recombination only at QTL markers, gives similar power and can lead to greater accuracy in QTL detection, compared with sampling individuals that maximizes recombination over the whole genome. This strategy, which is especially effective for a trait controlled by multiple small effect QTL, could be used for QTL validation in multiple years and/or locations of traits which require costly and time-consuming phenotyping.
5. ACKNOWLEDGEMENTS
This work was supported by the French Institut National de la Recherche Agronomique—Department of Génétique et Amélioration des Plantes, CETIOM (Centre Technique Interprofessionnel des Oléagineux Métropolitains) and PROMOSOL. We thank the team of the INRA Experimental Unit (Le Rheu) for performing the disease evaluation trials. Genotyping was performed on Biogenouest® platform.
REFERENCES
- Kearsey, M.J. and Farquhar, A.G.L. (1998) QTL analysis in plants; where are we now? Heredity, 80, 137-142. doi:10.1046/j.1365-2540.1998.00500.x
- Salvi, S. and Tuberosa, R. (2005) To clone or not to clone plant QTLs: Present and future challenges. Plant Science, 10, 297-304.
- Lander, E.S. and Botstein, D. (1989) Mapping mendelian factors underlying quantitative traits using RFLP linkage maps. Genetics, 121, 185-199.
- Lebowitz, R.J., Soller, M. and Beckmann, J.S. (1987) Trait-based analyses for the detection of linkage between marker loci and quantitative trait loci in crosses between inbred lines. Theoretical and Applied Genetics, 73, 556-562. doi:10.1007/BF00289194
- Navabi, A., Mather, D.E., Bernier, J., Spaner, D.M. and Atlin, G.N. (2009) QTL detection with bidirectional and unidirectional selective genotyping: Marker-based and trait-based analyses. Theoretical and Applied Genetics, 118, 347-358. doi:10.1007/s00122-008-0904-2
- Kimura, T., Kobayashi, T., Munkhbat, B., Oyungerel, G., Bilegtsaikhan, G., Anar D., Jambaldorj, J., Munkhsaikhan, S., Munkhtuvshin, N., Hayashi, H., Oka, A., Inoue, I. and Inoko, H. (2008) Genome-wide association analysis with selective genotyping identifies candidate loci for adult height at 8q21.13 and 15q22.33-q23 in Mongolians. Human Genetics, 123, 655-660. doi:10.1007/s00439-008-0512-x
- Sun, Y., Wang J., Crouch, J.H. and Xu, Y. (2010) Efficiency of selective phenotyping for genetic analysis of complex traits and potential applications in crop improvement. Molecular Breeding, 26, 493-511. doi:10.1007/s11032-010-9390-8
- Brown, D. and Vision T. (2000) Software for selective mapping and bin mapping. http://www.bio.unc.edu/faculty/vision/lab/mappop
- Xu, Z.L., Zou, F. and Vision, T.J. (2005) Improving quantitative trait loci mapping resolution in experimental crosses by the use of genotypically selected samples. Genetics, 170, 401-408. doi:10.1534/genetics.104.033746
- Simon, M., Loudet, O., Durand, S., Berard, A., Brunel, D., Sennesal, F.S., Durand-Tardif, M., Pelletier, G. and Camilleri, C. (2008) Quantitative trait loci mapping in five new large recombinant inbred line populations of Arabidopsis thaliana genotyped with consensus single-nucleotide polymerphism markers. Genetics, 178, 2253-2264. doi:10.1534/genetics.107.083899
- Vales, M.I., Schon, C.C., Capettini, F., Chen, X.M., Corey, A.E., Mather, D.E, Mundt, C.C., Richardson, K.L., Sandoval-Islas, J.S, Utz, H.F. and Hayes, P.M. (2005) Effect of population size on the estimation of QTL: A test using resistance to barley stripe rust. Theoretical and Applied Genetics, 111, 1260-1270. doi:10.1007/s00122-005-0043-y
- Birolleau-Touchard, C., Hanocq, E., Bouchez, A., Bauland, C., Dourlen, I., Seret, J.P., Rabier, D., Hervet, S., Allienne, J.F., Lucas, P., Jaminon, O., Etienne, R., Baudhuin, G. and Giauvret, C. (2007) The use of MapPop1.0 for choosing a QTL mapping sample from an advanced backcross population. Theoretical and Applied Genetics, 114, 1019-1028. doi:10.1007/s00122-006-0495-8
- Barchi, L., Lefebvre, V., Sage-Palloix, A.M., Lanteri, S. and Palloix, A. (2009) QTL analysis of plant development and fruit traits in pepper and performance of selective phenotyping. Theoretical and Applied Genetics, 118, 1157-1171. doi:10.1007/s00122-009-0970-0
- Jin, C., Lan, H., Attie, A.D., Churchill, A.G., Bulutuglo, D. and Yandell, B.S. (2004) Selective phenotyping for increased efficiency in genetic mapping studies. Genetics, 168, 2285-2293. doi:10.1534/genetics.104.027524
- Jannink, J.L. (2005) Selective phenotyping to accurately map quantitative trait loci. Crop Science, 45, 901-908. doi:10.2135/cropsci2004.0278
- Charcosset, A. and Gallais, A. (1996) Estimation of the contribution of quantitative trait loci (QTL) to the variance of a quantitative trait by means of genetic markers. Theoretical and Applied Genetics, 93, 1193-1201. doi:10.1007/BF00223450
- Orgogozo, V., Broman, K.W. and Stern, D.L. (2006) Highresolution quantitative trait locus mapping reveals sign epistasis controlling ovariole number between two drosophila species. Genetics, 173, 197-205. doi:10.1534/genetics.105.054098
- Delourme, R., Falentin, C., Huteau, V., Clouet, V., Horvais, R., Gandon, B., Specel, S., Hanneton, L., Dheu, J.E, Deschamps, M., Margale, E., Vincourt, P. and Renard, M. (2006) Genetic control of oil content in oilseed rape (Brassica napus L.). Theoretical and Applied Genetics, 113, 1331-1345. doi:10.1007/s00122-006-0386-z
- Fitt, B.D.L., Brun, H., Barbetti, M.J. and Rimmer, S.R. (2006) World-wide importance of phoma stem canker (Leptosphaeria maculans and L. biglobosa) on oilseed rape (Brassica napus). European Journal of Plant Pathology, 114, 3-15. doi:10.1007/s10658-005-2233-5
- West, J.S., Kharbanda, P.D., Barbetti, M.J. and Fitt, B.D.L. (2001) Epidemiology and management of Leptosphaeria maculans (phoma stem canker) on oilseed rape in Australia, Canada and Europe. Plant Pathology, 50, 10-27.
- Delourme, R., Chèvre, A.M., Brun, H., Rouxel, T., Balesdent, M.H., Dias, J.S., Salisbury, P., Renard, M. and Rimmer, S.R. (2006) Major gene and polygenic resistance to Leptosphaeria maculans in oilseed rape (Brassica napus). European Journal of Plant Pathology, 114, 41-52. doi:10.1007/s10658-005-2108-9
- Rimmer, S.R. (2006) Resistance genes to Leptosphaeria maculans in Brassica napus. Canadian Journal of Plant Pathology, 28, S288-S297. doi:10.1080/07060660609507386
- Pilet, M., Duplan, G., Archipiano, M., Barret, P., Baron, C., Horvais, R., Tanguy, X., Lucas, M.O., Renard, M. and Delourme. R. (2001) Stability of QTL for field resistance to blackleg across two genetic backgrounds in oilseed rape. Crop Science, 41, 197-205. doi:10.2135/cropsci2001.411197x
- Pilet, M.L., Delourme, R., Foisset, N. and Renard. M. (1998) Identification of loci contributing to quantitative field resistance to blackleg disease, causal agent Leptosphaeria maculans (Desm.) Ces. et de Not., in Winter rapeseed (Brassica napus L.). Theoretical and Applied Genetics, 96, 23-30. doi:10.1007/s001220050704
- Foisset, N., Delourme, R., Barret, P., Hubert, N., Landry, B.S. and Renard, M. (1996) Molecular-mapping analysis in Brassica napus using isozyme, RAPD and RFLP markers on a doubled haploid progeny. Theoretical and Applied Genetics, 93, 1017-1025. doi:10.1007/BF00230119
- Lombard, V. and Delourme, R. (2001) A consensus linkage map for rapeseed (Brassica napus L.): Construction and integration of three individual maps from DH populations. Theoretical and Applied Genetics, 103, 491-507. doi:10.1007/s001220100560
- Delourme, R., Piel, N., Horvais, R., Pouilly, N., Domin, C., Vallée, P., Falentin, C., Manzanares-Dauleux, M.J. and Renard, M. (2008) Molecular and phenotypic characterization of near isogenic lines at QTL for quantitative resistance to Leptosphaeria maculans in oilseed rape (Brassica napus L.). Theoretical and Applied Genetics, 117, 1055-1067. doi:10.1007/s00122-008-0844-x
- Wang J., Lydiate, D.J., Parkin, I.A.P., Falentin, C., Delourme, R., Carionand, P.W.C. and King, G.J. (2011) Integration of linkage maps for the amphidiploid Brassica napus and comparative mapping with Arabidopsis and Brassica rapa. BMC Genomics, 12, 101. doi:10.1186/1471-2164-12-101
- Lincoln, S., Daly, M. and Lander, E. (1992) Constructing genetic linkage maps with Mapmaker/Exp 3.0: A tutorial and reference manual. 3rd Edition, Whitehead Institute Technical Report.
- Haldane, J.B.S. (1919) The combination of linkage values, and the calculation of distances between the loci of linked factors. Journal of Genetics, 8, 299-309.
- SAS II. (1989) SAS/STAT users guide, version 6.0. 4th Edition, SAS institute Inc., Cary.
- Wang, S., Basten, C.J. and Zeng, Z.B. (2007) Windows QTL cartographer 2.5. North Carolina State University, Raleigh. http://statgen.ncsu.edu/qtlcart/WQTLCart.htm
- Voorrips, R.E. (2002) MapChart: Software for the graphical presentation of linkage maps and QTLs. Journal of Heredity, 93, 77-78. doi:10.1093/jhered/93.1.77
- Sen, S., Johannes, F. and Broman, K.W. (2009) Selective genotyping and phenotyping strategies in a complex trait context. Genetics, 181, 1613-1626. doi:10.1534/genetics.108.094607
- Jansen, R.C., Vanooijen, J.W., Stam, P., Lister, C. and Dean, C. (1995) Genotype-by-environment interaction in geneticmapping of multiple quantitative trait loci. Theoretical and Applied Genetics, 91, 33-37. doi:10.1007/BF00220855
- Beavis, W.B. (1998) QTL analyses: Power, precision, and accuracy. In: Molecular dissection of complex traits, edited by Patterson AH. CRC Press, Boca Raton, 145-162.
- Hyne, V., Kearsey, M.J., Pike, D.J. and Snape. J.W. (1995) QTL analysis: Unreliability and bias in estimation procedures. Molecular Breeding, 1, 273-282. doi:10.1007/BF02277427