Paper Menu >>
Journal Menu >>
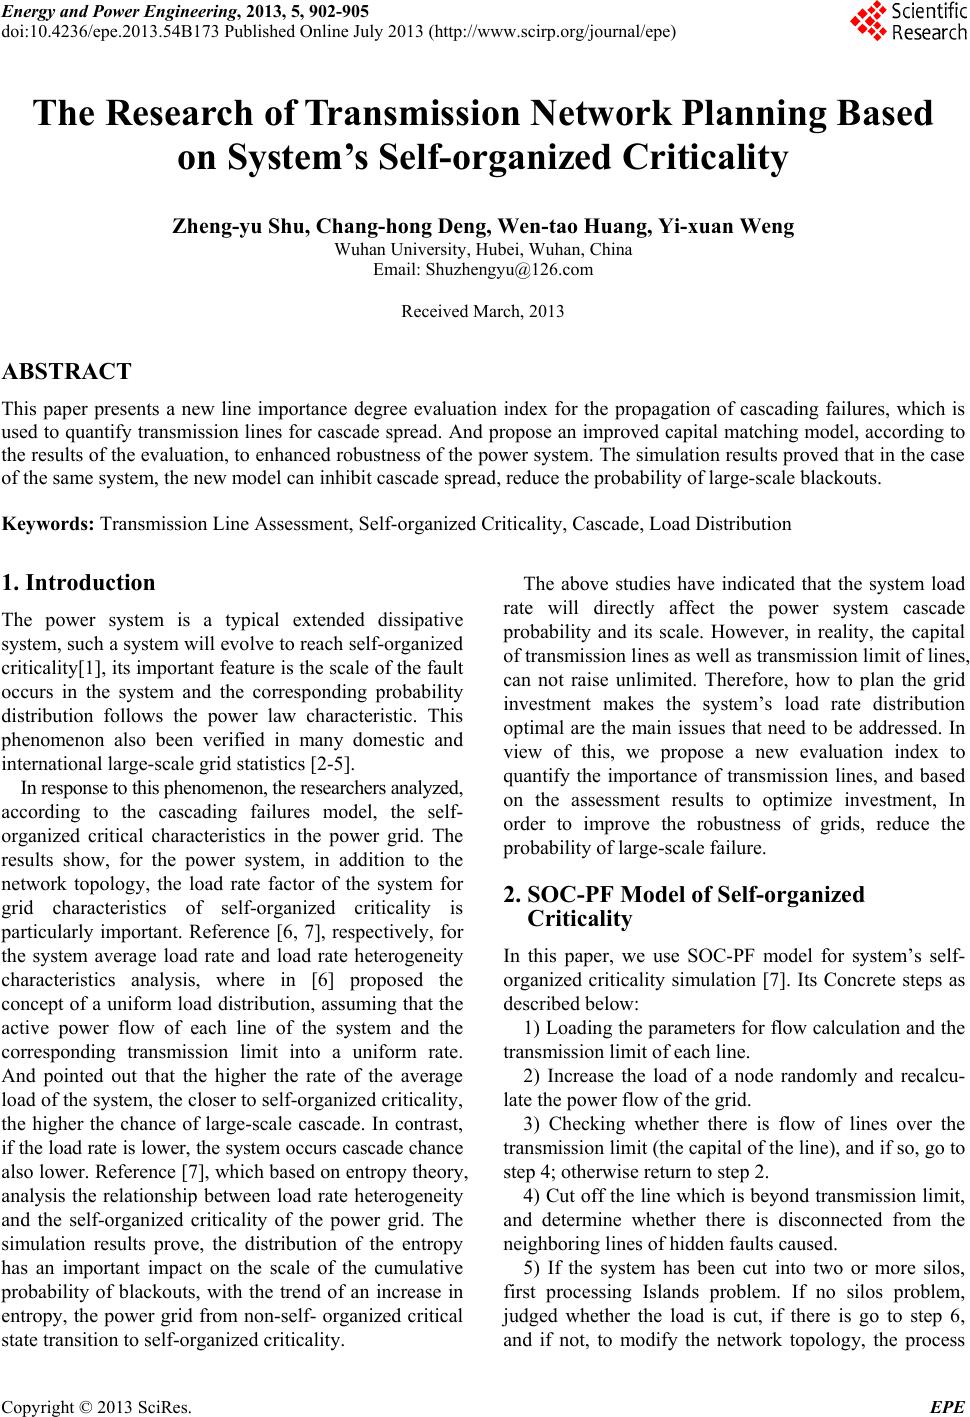 Energy and Power Engineering, 2013, 5, 902-905 doi:10.4236/epe.2013.54B173 Published Online July 2013 (http://www.scirp.org/journal/epe) The Research of Transmission Network Planning Based on System’s Self-organized Criticality Zheng-yu Shu, Chang-hong Deng, Wen-tao Huang, Yi-xuan Weng Wuhan University, Hubei, Wuhan, China Email: Shuzhengyu@126.com Received March, 2013 ABSTRACT This paper presents a new line importance degree evaluation index for the propagation of cascading failures, which is used to quantify transmission lines for cascade spread. And propose an improved capital matching model, according to the results of the evaluation, to enhanced robustness of the power system. The simulation results proved that in the case of the same system, the new model can inhibit cascade spread, reduce the probability of large-scale blackouts. Keywords: Transmission Line Assessment, Self-organized Criticality, Cascade, Load Di stribut i on 1. Introduction The power system is a typical extended dissipative system, such a system will evolve to reach self-organized criticality[1], its important feature is the scale of the fault occurs in the system and the corresponding probability distribution follows the power law characteristic. This phenomenon also been verified in many domestic and international large-scale grid statistics [2-5]. In response to this phenomenon, the researchers analyzed, according to the cascading failures model, the self- organized critical characteristics in the power grid. The results show, for the power system, in addition to the network topology, the load rate factor of the system for grid characteristics of self-organized criticality is particularly important. Reference [6, 7], respectively, for the system average load rate and load rate heterogeneity characteristics analysis, where in [6] proposed the concept of a uniform load distribution, assuming that the active power flow of each line of the system and the corresponding transmission limit into a uniform rate. And pointed out that the higher the rate of the average load of the system, the closer to self-organized criticality, the higher the chance of large-scale cascade. In contrast, if the load rate is lower, the s ystem occurs cascade chance also lower. Reference [7], which based on entropy theory, analysis the relationship between load rate heterogeneity and the self-organized criticality of the power grid. The simulation results prove, the distribution of the entropy has an important impact on the scale of the cumulative probability of blackouts, with the trend of an increase in entropy, the power grid from non-self- organized critical state transition to self-organized criticality. The above studies have indicated that the system load rate will directly affect the power system cascade probability and its scale. However, in reality, the capital of transmission lines as well as transmission limit of lines, can not raise unlimited. Therefore, how to plan the grid investment makes the system’s load rate distribution optimal are the main issues that need to be addressed. In view of this, we propose a new evaluation index to quantify the importance of transmission lines, and based on the assessment results to optimize investment, In order to improve the robustness of grids, reduce the probability of large-scale failure. 2. SOC-PF Model of Self-organized Criticality In this paper, we use SOC-PF model for system’s self- organized criticality simulation [7]. Its Concrete steps as described below: 1) Loading the parameters for flow calculatio n and the transmission limit of each line. 2) Increase the load of a node randomly and recalcu- late the power flow of the grid. 3) Checking whether there is flow of lines over the transmission limit (the capital of the line), and if so, go to step 4; otherwise return to step 2. 4) Cut off the line which is beyond transmission li mit, and determine whether there is disconnected from the neighboring lines of hidden faults caused. 5) If the system has been cut into two or more silos, first processing Islands problem. If no silos problem, judged whether the load is cut, if there is go to step 6, and if not, to modify the network topology, the process Copyright © 2013 SciRes. EPE 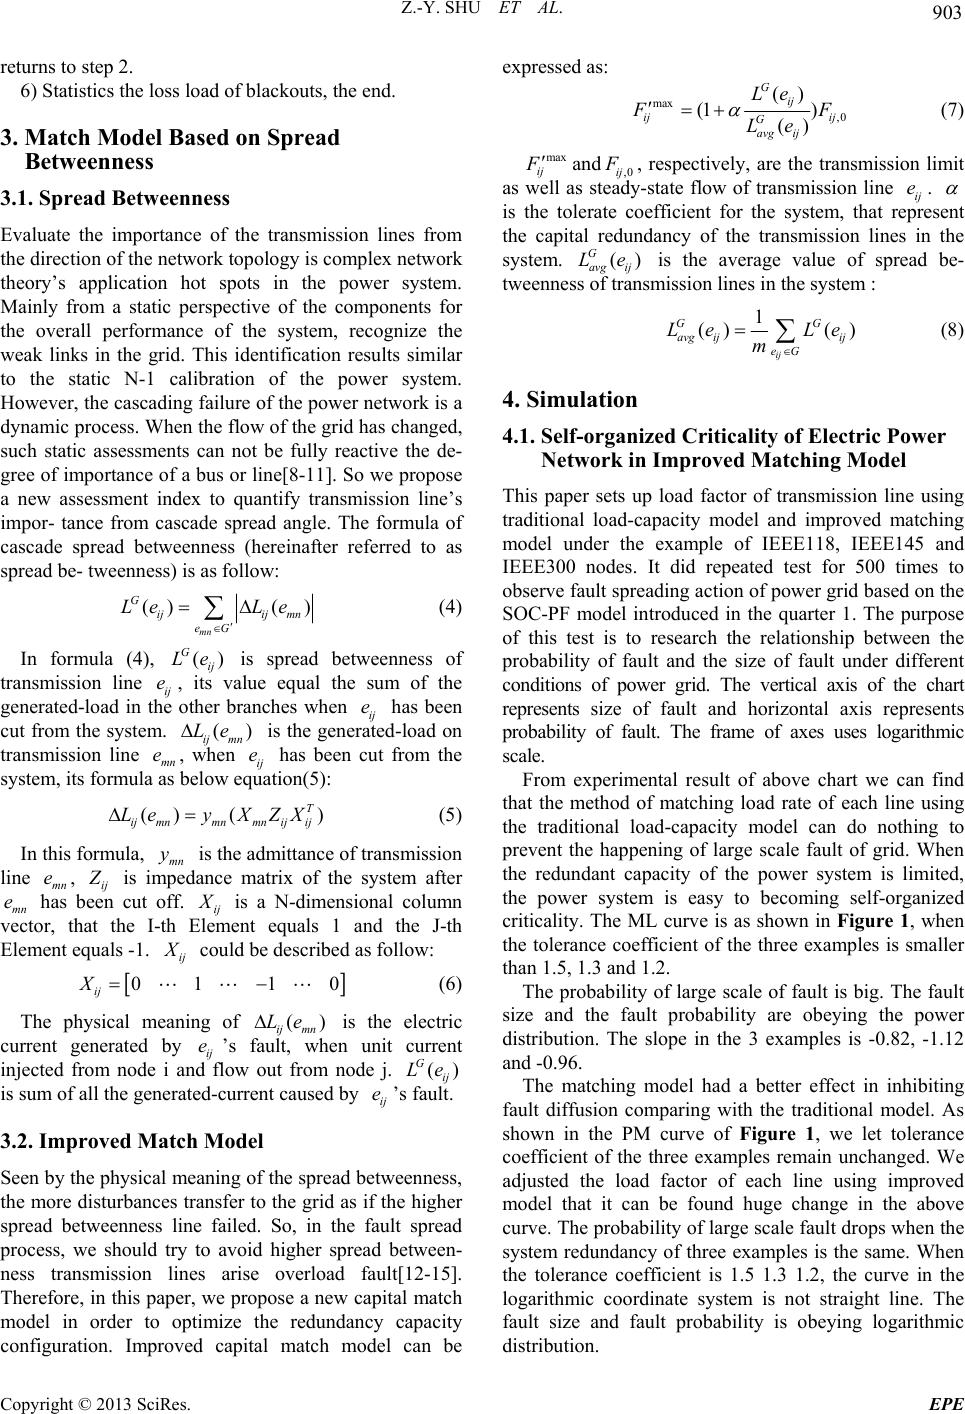 Z.-Y. SHU ET AL. 903 returns to step 2. 6) Statistics the loss load of blackouts, the end. 3. Match Model Based on Spread Betweenness 3.1. Spread Betweenness Evaluate the importance of the transmission lines from the direction of the network topology is complex network theory’s application hot spots in the power system. Mainly from a static perspective of the components for the overall performance of the system, recognize the weak links in the grid. This identification results similar to the static N-1 calibration of the power system. However, the cascading failure of the power network is a dynamic process. When the flow of the grid has changed, such static assessments can not be fully reactive the de- gree of importance of a bus or line[8-11]. So we propose a new assessment index to quantify transmission line’s impor- tance from cascade spread angle. The formula of cascade spread betweenness (hereinafter referred to as spread be- tweenness) is as follow: ()( ) mn Gijij mn eG Le Le (4) In formula (4), is spread betweenness of transmission line ij , its value equal the sum of the generated-load in the other branches when ij has been cut from the system. n is the generated-load on transmission line mn , when ij has been cut from the system, its formula as below equation(5): () Gij Le ( ij m Le e e e ) e () (T ijmnmnmn ijij Ley XZX ) (5) In this formula, mn is the admittance of transmission line mn, ij y e Z is impedance matrix of the system after mn has been cut off. ij e X is a N-dimensional column vector, that the I-th Element equals 1 and the J-th Element equals -1. ij X could be described as follow: 01 1 ij X 0 (6) The physical meaning of () ij mn Le is the electric current generated by ij ’s fault, when unit current injected from node i and flow out from node j. is sum of all the generated-current caused by ’s fault. e() Gij Le ij e 3.2. Improved Match Model Seen by the physical meaning of the spre ad betweenness, the more disturbances transfer to the grid as if the higher spread betweenness line failed. So, in the fault spread process, we should try to avoid higher spread between- ness transmission lines arise overload fault[12-15]. Therefore, in this paper, we propose a new capital match model in order to optimize the redundancy capacity expressed as: max ,0 () (1 ) () Gij ij ij G avg ij Le F F Le (7) max ij F and ,0ij F , ady respectively, are the transmission limit as well as ste-state flow of transmission line ij e. is the tolerate coefficient for the system, that re the capital redundancy of the transmission lines in the system. () G avg ij Le is the average value of spread be- tweennessmission lines in the system : present s of tran 1 GG () () ij avg ij ij eG Le Le m (8) 4. Simulation ed Criticality of Electric Power This using experimental result of above chart we can find th rge scale of fault is big. The fault si ng model had a better effect in inhibiting fa distribution. 4.1. Self-organiz Network in Improved Matching Model paper sets up load factor of transmission line traditional load-capacity model and improved matching model under the example of IEEE118, IEEE145 and IEEE300 nodes. It did repeated test for 500 times to observe fault spreading action of power grid based on the SOC-PF model introduced in the quarter 1. The purpose of this test is to research the relationship between the probability of fault and the size of fault under different conditions of power grid. The vertical axis of the chart represents size of fault and horizontal axis represents probability of fault. The frame of axes uses logarithmic scale. From at the method of matching load rate of each line using the traditional load-capacity model can do nothing to prevent the happening of large scale fault of grid. When the redundant capacity of the power system is limited, the power system is easy to becoming self-organized criticality. The ML curve is as shown in Figure 1, when the tolerance coefficient of the three examples is smaller than 1.5, 1.3 and 1.2. The probability of la ze and the fault probability are obeying the power distribution. The slope in the 3 examples is -0.82, -1.12 and -0.96. The matchi ult diffusion comparing with the traditional model. As shown in the PM curve of Figure 1, we let tolerance coefficient of the three examples remain unchanged. We adjusted the load factor of each line using improved model that it can be found huge change in the above curve. The probability of large scale fau lt drops when the system redundancy of three examples is the same. When the tolerance coefficient is 1.5 1.3 1.2, the curve in the logarithmic coordinate system is not straight line. The fault size and fault probability is obeying logarithmic configuration. Improved capital match model can be Copyright © 2013 SciRes. EPE 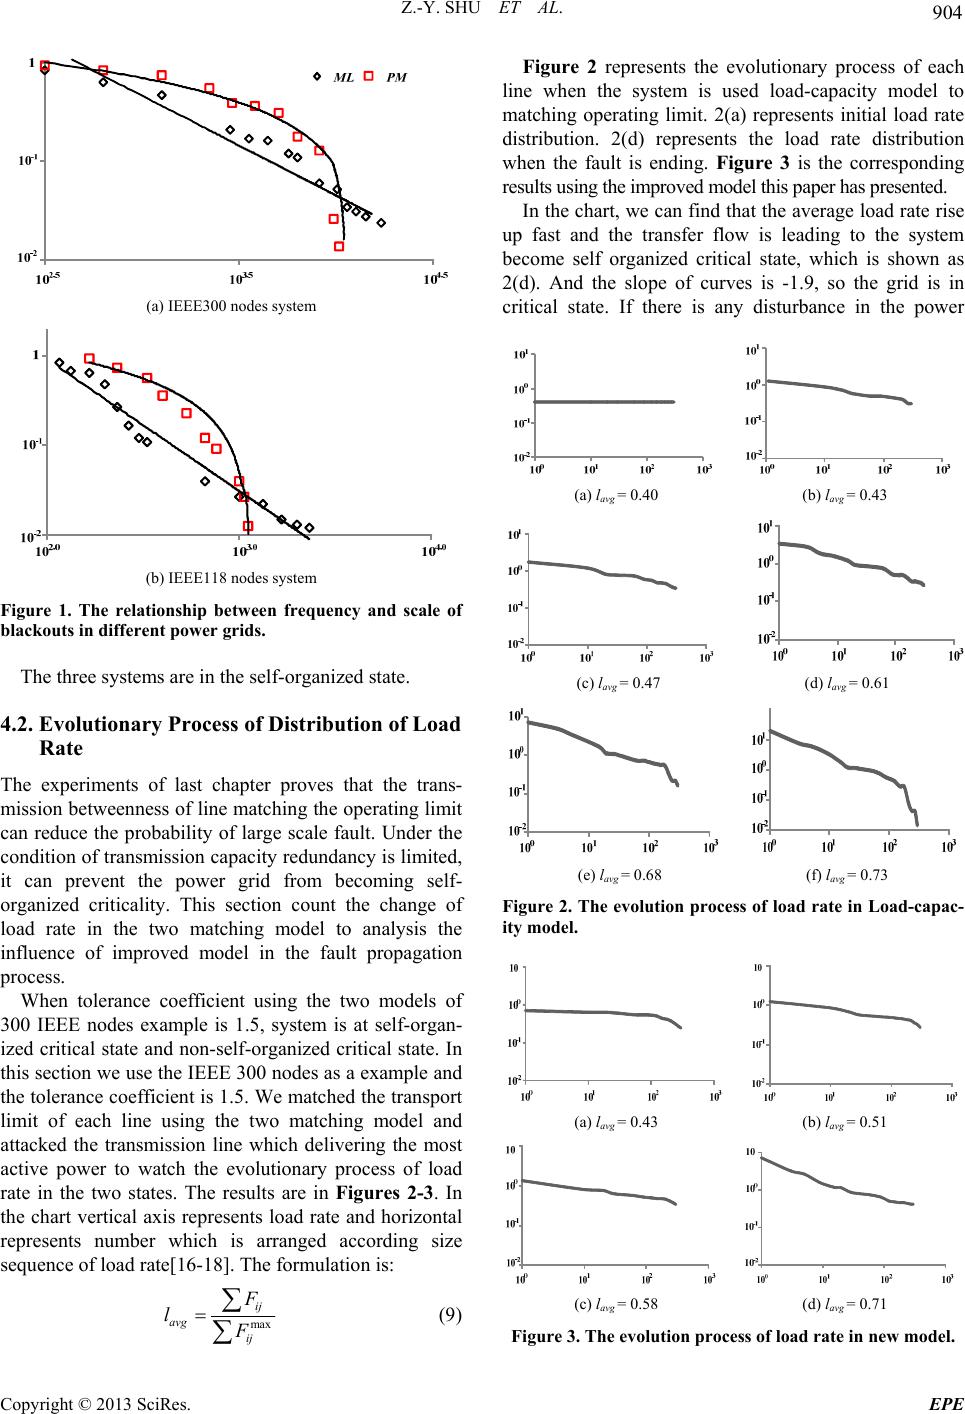 Z.-Y. SHU ET AL. 904 (a) IEEE300 nodes system (b) IEEE118 nodes system Figure 1. The relationship between frequency and scale of blackouts in differ -organized state. 4.oad Rate missiweenness of line matching the operating limit nodes example is 1.5, system is at self-organ- iz ent power grids. The three systems are in the self 2. Evolutionary Process of Distribution of L The experiments of last chapter proves that the trans- on bet can reduce the probability of large scale fault. Under the condition of transmission capacity red undancy is limited, it can prevent the power grid from becoming self- organized criticality. This section count the change of load rate in the two matching model to analysis the influence of improved model in the fault propagation process. When tolerance coefficient using the two models of 300 IEEE ed critical state and non-self-organized critical state. In this section we use the IEEE 300 nodes as a example and the tolerance coefficient is 1.5. We matched the transp ort limit of each line using the two matching model and attacked the transmission line which delivering the most active power to watch the evolutionary process of load rate in the two states. The results are in Figures 2-3. In the chart vertical axis represents load rate and horizontal represents number which is arranged according size sequence of load rate[ 16-18]. The formulation is: max ij avg ij F l F (9) Figure 2 represents the evolutionary process of each line when the system is used l matching operating limit. 2(a) represents initial load rate di 2( oad-capacity model to stribution. 2(d) represents the load rate distribution when the fault is ending. Figure 3 is the corresponding results using the improved model this paper has presented. In the chart, we can find that the average load rate rise up fast and the transfer flow is leading to the system become self organized critical state, which is shown as d). And the slope of curves is -1.9, so the grid is in critical state. If there is any disturbance in the power (a) lavg = 0.40 (b) lavg = 0.43 (c) lavg = 0.47 (d) lavg = 0.61 (e) lavg = 0.68 (f) lavg = 0.73 Figure 2. The evolution proces of load rate in Load-capac- ity model. s (a) lavg = 0.43 (b) lavg = 0.51 (c) lavg = 0.58 (d) lavg = 0.71 Figure 3. The evolution process of load rate in new model. Copyright © 2013 SciRes. EPE  Z.-Y. SHU ET AL. Copyright © 2013 SciRes. EPE 905 system, it can leads to large scale of fault in the power system and the loss of load is rising which is shown as (e) and (f). If it used the improved model in this paper has presented we can find that it has a better effect suppress the fluctuation of load. The rising extent of average load rate is small. The load distribution has a rising te0.7, I planning process, the distribution of load rate of the system has been optimized. SOC-PF m sults has proved that this new model omplex Power System,” Power System Technology, Vol. 5, No. 10, 2006, pp. 18-22. [3] Q. Y. Xie, C.et al., “Evalua Method for No Grid Based on the lnerability Assessment Based on Complex ode uence of G. Z. Wang, L. H. Cao and L. J. Ding, “An Zhao, “Discussion on Several ng and B.-J. Kim, “A High-robustness and in Identification Model for Self-oganized Criticality of Power Grids Based on Power Flow Entropy,” Automation of Electric Power Systems, Vol. 7, No. 35, 2011, pp. 1-8. [8] H. Q. Deng, X. Ai and L. ndency and the slope is in the range of [- 0.1]. Problems of Self-Organized Criticality of Blackout,” Power System Technology, Vol. 31, No. 8, 2007, pp. 42-48. [9] H. J. Sun, H. Zhao and J. J. Wu. “A Robust Matching t can prevent the system from becoming self-organized critical state. 5. Conclusions The load rate of power system has a direct impact on the self-organized criticality. For this reason this paper, based on the evaluation result (spread betweenness), propose a new capital match model. In this proved model, through the rational allocation of transmission capacity of the grid in Low odel- based simulation re could prevent the system involved to the self-organized critical state, reduce the probability of occurrence of large-scale power outages. REFERENCES [1] J. Yi, X. X. Zhou and Y. N. Xiao, “Analysis on Power System Self-Organized Criticality and Its Simulation Model,” Power System Technology, Vol. 32, No. 3, 2008, pp. 7-12. [2] R.-R. Li, Y. Zhang and Q. Y. Jiang, “Risk Assessment for Cascading Failures of C H. Deng, H. S. Zhao, de Importance of Powertion Weighted Network Model,” Automation of Electric Power Systems, Vol. 33, No. 4, 2009, pp. 21-24. [4] X. P. Ni, S. W. Mei and X. M. Zhang, “Transmission Lines’ Vu Network Theory,” Automation of Electric Power Systems, Vol. 32, No. 4, 2008, pp. 1-4. [5] M. Ding and P. P. Han, “Small World Topological Ml Based Vulnerability Assessment to Large Scale Power Grid,” Proceedings of the CSEE, Vol. 25, 2005, pp. 118-122. [6] Q. Yu, N. Cao and J. B. Guo, “Analysis on Infl Load Rate on Power System Self-organized Criticality,” Automation of Electric Power Systems, Vol. 36, No. 1, 2012, pp. 24-30. [7] Y. J. Cao, Model of Capacity to Defense Cascading Failure on Complex Networks,” Physical Review A, Vol. 20, 2008, pp. 6431-6435. [10] B. Wa -cost Model for Cascading Failures, Europhysics Letters, Vol. 78, 2007, 48001. doi:10.1209/0295-5075/78/48001 [11] X. P. Ni, X. M. Zhang and S. W. Mei, “Generator entrality Measure for le Lines in Power Grid Based on Complex ontrol and Defense in Complex Proceedings of the x erability Assessment of 1. Tripping Strategy Based on Complex Network Theory,” Power System Technology, Vol. 9, No. 34, 2010, pp. 33-38. [12] P. Hines and S. Blumsack, “A C Electrical Networks,” Hawaii International Conference on System Sciences, 2008. [13] Y. J. Cao, X. G. Chen and K. Sun, “Identincation of Vulnerab Network Theory,” Automation of Electric Power Systems, Vol. 26, No. 12, 2006, pp. 27-31. [14] A. E. Motter, “Cascade C Networks,” Physical Review E, Vol. 93, 2008, 098701. [15] L. Xu, X. L. Wang and X. F. Wang, “Cascading Failure Mechanism in Power Grid Based on Electric Betweenness and Active Defense,” CSEE, Vol. 13, 2010, pp. 61-65. [16] Ae Motter, “Cascade-based Attacks on Comple Networks,” Physical Review E, Vol. 66, 2002, pp. 065102. [17] W. Kai, B.-H. Zhang and Z. Zhang, et al., “An Electrical Betweenness Approach for Vuln Power Grids Considering the Capacity of Generators and Load,” Science Direct Physica A, Vol. 390, 2011, pp. 4692-470 [18] J.-F. Zheng, Z.-Y. Gao, X.-M. Zhao, “Modeling Cascading Failures in Congested Complex Networks,” Science Direct Physica A., Vol. 385, 2007, pp. 700-706. |