Paper Menu >>
Journal Menu >>
 iBusiness, 2010, 2, 409-414 doi:10.4236/ib.2010.24054 Published Online December 2010 (http://www.scirp.org/journal/ib) Copyright © 2010 SciRes. iB The Role of Fair Value Accounting for Investment in Securities: Evidences from the Chinese Stock Exchanged Market Jing Li, ParkSang Kyu Department of Accounting, Gyeongsang national university, GSNU, Jinju, South Korea. E-mail: LijingCW@hotmail.com, SkPark@gnu.ac.kr Received August 15th, 2010; revised September 29th, 2010; accepted November 3rd, 2010. ABSTRACT The purpose of this study is to examine the relevance of fair value accounting measurement for investment in securities. We use three measurements for fair value: net asset based on fair value per share (FV), fair value adjusted amount per share (FVAD) and fair value adjusted investment gain and loss in earnings per share (HOLDG). Our sample is com- posed of Chinese listed companies from period 2006 to the end of 2008. The empirical result shows that first, there is the relevance between stock price and fair value measured information. Second, the explanation power of fair value measures for stock price fluctuation in the listed companies, Third, There are distinct relativity between volatility of return of stock and fair value measured information. Keywords: Fair Value Accounting, Investment Securities, Role Relevance 1. Introduction At present, Both financial accounting standard board and international accounting standard board are transferring from historical cost accounting to fair value accounting in making accounting standards. fair value as a meas- urement basis in accounting is becoming increasingly importance, this growth require that fair value lead to improved financial reporting, in 2006, the Financial ac- counting standards board (FASB) defined fair value for financial reporting purposes and provided a framework for measuring fair value to improve the quality of fair values recognized or disclosed in the financial statements. In this paper, we used the variables from balance sheet and income statement; we use three measurements for fair value: net asset based on fair value per share (FV), fair value adjusted amount per share (FVAD) and fair value adjusted investment gain and loss in earnings per share (HOLDG), our sample is composed of Chinese listed companies from period 2006 to the end of 2008. Because the fair value measurement was accepted for- mally in the accounting statements from 2006 in china. The purpose of this study is to examine the role rele- vance of fair value accounting measurement for invest- ment in securities. The empirical result shows that First, there is negative relevance between the stock price and fair value measured information. Second, the explanation power of fair value measures for stock price fluctuation is larger than that for other items in the listed companies. Third, there is distinct relativity between volatility of return of stock and fair value measured information. The remainder of the paper is organized as follows. Section 2 Provides relevant prior Research. Section 3 describes hypotheses and Research model. Section 4 describes the data and descriptive statistics. Section 5 concludes investment in securities. 2. Literature Review Most studies that investigate the value-relevance and reliability of fair value disclosures of financial informa- tion focus on listed companies. The relevance of ac- counting information in the developed markets has long been documented since the seminal work of Ball and Brown [1]. Chen and Wang, 2004, and Haw, Qi and Wu [2] have examined the relevance of accounting informa- tion in China in various time periods prior to the acces- sion of China. These studies focus on comparing the as- sociation between aggregate accounting information and stock prices for firms preparing financial reports based on China GAAP and those following IAS GAAP (e.g. A-  The Role of Fair Value Accounting for Investment in Securities: Evidences from the Chinese Stock Exchanged Market Copyright © 2010 SciRes. iB 410 and B-Share firms respectively). The results from these studies are inconclusive with some finding that earnings and book value of equity under IAS are more value rele- vant than China GAAP-based earnings and book value [3], value relevance has increased over time from 1992 to 1996 [4], and some (e.g., Sami and Zhou, 2004) re- porting a decline in the value relevance of accounting numbers under the China GAAP and no change in the value relevance of accounting information under IAS GAAP. Bath [4] find that the multiple on earnings before se- curities gains and losses is positive relevance, and sug- gest that the market might not value realized securities gains and losses because they are transitory, they lack timeliness. In our study, we also find between the securi- ties gains and losses and market value of securities are positive relevance. Maines and Whalen [5] provide a review of empirical accounting research of the reliability of accounting in- formation. While reliability is an essential characteristic of useful accounting information, understanding and providing evidence with respect to the role of reliability is complex. Carroll (2003) Examine closed-end mutual funds and find significant associations between stock price metrics and the fair values of investment securities. They inves- tigate across different fund types with differing reliability levels with respect to fair value measures of the invest- ment securities and find that significant association re- mains for all types. And suggest that value relevance in this setting is not hindered by reliability concerns. Mark Kohl beck (2008) investigate the perceived reli- ability of fair value measures in the banking industry to provide evidence on changes in the market’s perception about the reliability, in the wake of events with opposing effects on perceived reliability. Mark contribute to the extant literature by directly providing evidence on an important but elusive qualitative characteristic of ac- counting information and show that the market-based reliability metrics are affected by external events and these events overshadowed the impact of regulatory and auditing standards that should reliability. Igor Gorchakov [6] contribute to literature on fair value accounting by showing that the use of verifiable fair value estimates can impact economic decision mak- ing and lead to lower distribution than implied by actual economic performance. We show that the usefulness of fair value accounting is likely to depend on investors’ ability to process complex accounting information and understand its implications for future earnings. Roger Graham (1998) test for a relation between the difference between disclosed fair value and book values of the equity method investments and the market values and stock returns of investors , they a significant positive relation. And suggest that requiring recognition of the fair values of equity method investments, at least for equity method investments in publicly-traded stocks, should be considered by standard setters. Isabel Costa [7] show that the relative value relevance of different types of fair value estimates of investment property by exploring the European setting where listed firms are allowed to choose either the fair value model or the cost model as their accounting policy for investment property. And suggest that investors distinguish recog- nized cost and recognized fair value of investment prop- erty. Collins et al. (1997) suggest that using book values of equity to evaluate firms with small-sizes, intangible- intensities and reporting negative earnings is more ap- propriate than using earnings in light of investors’ points of view that small firms may be more likely to face fi- nancial distress than large firms. Firms reporting nega- tive earnings, have smaller earnings response coefficients (ERC) to stock returns than firms who report positive earnings [8]. Chen et al. [3] suggest that earnings are value-relevant for firms with positive earnings and that value-relevance shift to book values for firms with nega- tive earnings. In addition, both earnings and book values are value-relevant for firms with positive earnings, and that value-relevance shifts to book values for firms with negative earnings. In addition, both earnings and book values are value-relevant for large and small firms, while earnings coefficients are larger than book values coeffi- cients for small firms. 3. Research Model and Hypotheses The fair value measurement is to take measure of the fair value of the capital and liabilities at the balance sheet date, but also measured the profits and losses that caused by the change of fair value. This can compensate for the lacking of accounting earnings, and more reasonably reflect the financial position, operating results, cash flow and real earnings of the enterprise [9]. The basic goal of modern accounting is to be useful for a decision-making, takes into account to reflect the fiduciary duty. In the concept of fiduciary responsibility, the accounting information mainly reports the responsi- bility of management that fulfills the economic situation. Assets measurement is mainly to protect the assets safety and integrity, and more emphasis on the reliability of accounting information, and select historical cost as a measurement model. In the decision-usefulness view, the relevance associated with the concept of decision-useful features. We increase relevance in order to enhance the usefulness of the decision-making. Accounting goal re- quire not only the information in the past, but also the  The Role of Fair Value Accounting for Investment in Securities: Evidences from the Chinese Stock Exchanged Market Copyright © 2010 SciRes. iB 411 information on the performance of present and future. We advocate using a market-pricing to determine the fair value of financial assets. Fair value measurement is not only able to meet the needs of short-term speculative, but also able to meet the needs of investors in the long-term decision-making, which is widely used [10]. Currently, fair value measurement’s basis for decision-usefulness view still exists. It is difficult to weaken the fair value measurement. There are two research related to China’s capital mar- ket with Accounting information, the one based on A- share market, the researchers found the information on accounting earnings to explain stock returns is limit and the different indicators of the return have the different Correlation. the others is B share market, the researchers found B-share listed companies prepared under Interna- tional Accounting Standards IAS earnings and book net assets have more explanatory power than earnings and book net assets of its stock price in accordance with PRC GAAP. Deng [11] has researched according to B share com- panies in China 1997-2004 public financial information and market data for relevance of fair value information, the study found that B-share market in accordance with International Accounting Standard No IAS39 disclosed fair value information significant increase the value rele- vance of accounting earnings. However, A-share market implement the Chinese ac- counting standards, from January 1, 2007, the new ac- counting standards was implemented, A-share listed companies began to apply fair value and provide relevant information. Under the new accounting standards, inves- tors can apply the fair value information and make the right decision for investment in securities? Thus, we hy- pothesized that the A-share market can respond to fair value, In other words, the stock prices can reflect the fair value information. H1: The market stock price can reflect the fair value accounting information of listed company From the previous literature, we can see the incre- mental effect of fair value with information, which im- prove the relevance of accounting information. the fair value will be through the “mark to market” (mark-to- market) reflected accounting earnings of listed compa- nies in the market with the process changes .Thus, when the market rises, the accounting earnings will rise; and the accounting earnings rose will drive the stock prices, which form a cycle, the cycle direct to the opposite when the market is down. This cycle consists of two sides: one is market price of the asset be very sensitive for the fair value, second, there is “mark to market” pricing, the fair value of assets in an active market is the market price. Thus, we propose the following two hypotheses. H2: the fair value information has significant ex- planatory power for stock price with Changes H3: there is significantly correlation between Fair value information and stock return In general, research supports that reliability is impor- tant in assessing accounting information usefulness, which has introduced in the prior studies. A number of recent events likely affect investor decisions in general and their beliefs about the reliability of accounting in- formation specifically. In our paper, I examine the explanation power of fair value measures disclosed in the financial statements. We use two models to test the hypothesis in this paper. They are include Price model ,Return model .The former two models are evolved from the Ohlson [12] model It is related to earnings and book values, and can examine whether the balance sheet and income information are associated with stock prices (Barth 1996; Burgstaher & Dichev, 1997), the Ohlson (1995) model as followed: 01 2ititit it PBVE In this model, it P is the firm’s share price at the t year when annual report was showed; it E is the firm I‘s earning per share at t year, it BV is the firm’s net asset per share at t year. This paper to test the hypothesis and observe whether the fair value price has explanatory power, or whether response to the fair value of stock price information, the measured factors that was affected by fair value method in the it BV and it E will be computed ,the composition formulas as followed: BVFVFVAD BVBFVEEBFVHOLDG , The F V is the fair value of book value per share ,it equals fair value measured financial asset minus fair value measured financial Liabilities divided by total eq- uity; F VAD is the fair value adjustment per share, it equals the fair value of Available for sale financial assets divided by the total equity; BVBFV is the non-fair value of net assets per share, it equals the book value minus the fair value of book value per share and the fair value adjustment per share, EBFV is the non-fair value of net earnings per share, it equals earning minus fair value adjusted investment gain and loss in earnings per share (HOLDG), the HOLDG equals Net earning plus investment earning in the fair value measurement divided by total equity. So the Ohlson model become the model (1) 012 3 45 itit itit itit it PBVBFV FV FVAD EBFV HOLDG (1) The model (1) divided 1it P, we obtained the return model (2)  The Role of Fair Value Accounting for Investment in Securities: Evidences from the Chinese Stock Exchanged Market Copyright © 2010 SciRes. iB 412 012 3 111 it itit it itit it BVBFVFV FVAD RET PPP 45 11 it it it it it EBFV HOLDG PP (2) it RET Is the firm I’s rate of return at T time period. All variable in model are measured as of the fiscal year-end and in order to obtain simply the tested result, we used the value is basis on per shares. 4. Statistical Process and Results Our sample is composed of Chinese listed company from period 2006 to the end of 2008. Because the fair value measurement was accepted formally in the accounting statements from 2006 in china. Which provided opportu- nity is to examine the relevance of fair value accounting measurement for investment in securities. This paper analyzes the sample principle are: 1) Excluding the financial companies 2) Excluding stock data is not complete Companies 3) Excluding ST, PT companies 4) Excluding companies listed after 2005 We collect 1664 effective stocks altogether, the detail is following: Table 2 shows that the price model results of descrip- tive statistics, the full sample are from the 2006 Annual Report, 2007 Annual Report and 2008 Annual Report as the target. From the mean point of view, the net assets per share (BV) is 2.39 per share, after deducting the fair value of net assets per share after adjustment (BVBFV) Table 1. Sample. Total sample: 2034 ST&PT: 34 stock data is not complete Companies: 106 the financial companies: 61 Table 2. The sample descriptive statistics. Descriptive Statistics – price Model Items Min Max Mean S.D P 0.68 149.83 14.50 13.97 BV −11.37 12.65 2.39 2.21 E −5.69 4.42 0.22 0.53 BVBFV −490.80 77.34 2.03 17.80 FV −74.66 24.701 0.150 0.893 FVAD −8.392 20.128 0.031 0.591 EBFV −3.227 5.543 0.190 0.390 HOLDG −0.884 3.382 0.034 0.150 is 2.03 per share, the two items are closely, the fair value accounting for about 6% in the net assets per share. In addition, earnings per share (E) are 0.22 per share, the fair value gain or loss is 0.034 per share, accounting for about 15%. Table 3 shows that the Pearson correlation analysis for the relevant variables of the price model. There are significant positive correlation between the Net assets per share (BV) and earnings per share (E), and the coef- ficient of between them is 0.54. Similarly, there are the significantly positive correlation between BVBFV and EBFV, and the coefficient is 0.519. However, the FV and FVAD have a significant negative correlation with the BVBFV, and the HOLDG and EBFV was significant negative relationship. In addition, the fair value of the three relevant variables in which was a significant posi- tive correlation, and the FV and FVAD has high corre- lated coefficient 0.637, the result verify hypothesis1: The market stock price can reflect the fair value accounting information of listed company. The Price model regression results shows in Table 4, Table 3. Pearson correlation analysis-price model. PBVE BVBFVFV FVAD EBFVHOLDG .483 .000 .583 .000 .437 .000 .078 .000 .065 .000 .565 .000 .094 .000 .540 .000 .761 .000 .388 .000 .258 .000 .489 .000 .177 .000 .502 .000 .079 .000 .038 .013 .929 .000 .269 .000 −.261 .000 −.337 .000 .519 .000 −.001 .923 .637 .000 −.029 (.059) .289 .000 −.021 (.175) −.157 .000 −.106 (.000) ***/**/* indicate statistical significance at the 1, 5, and 10 percent levels (two-tailed). Table 4. Regression analysis-price model. coefficients t-value P-value VIF BVBFV −0.053 −2.071 0.003 0.114 FV −0.162 −2.445 0.001 7.371 FVAD 0.151 2.280 0.002 7.366 EBFV 0.004 0.139 0.013 1.489 HOLDG 0.135 0.195 0.084 0.8107 BV 0.088 3.140 0.002 1.339 E 0.041 1.251 0.001 1.830 F-value: 0.68;R:0.77; Adjusted R Square: 0.781 012 3 45 itit itit itit it PBVBFV FV FVAD EBFV HOLDG 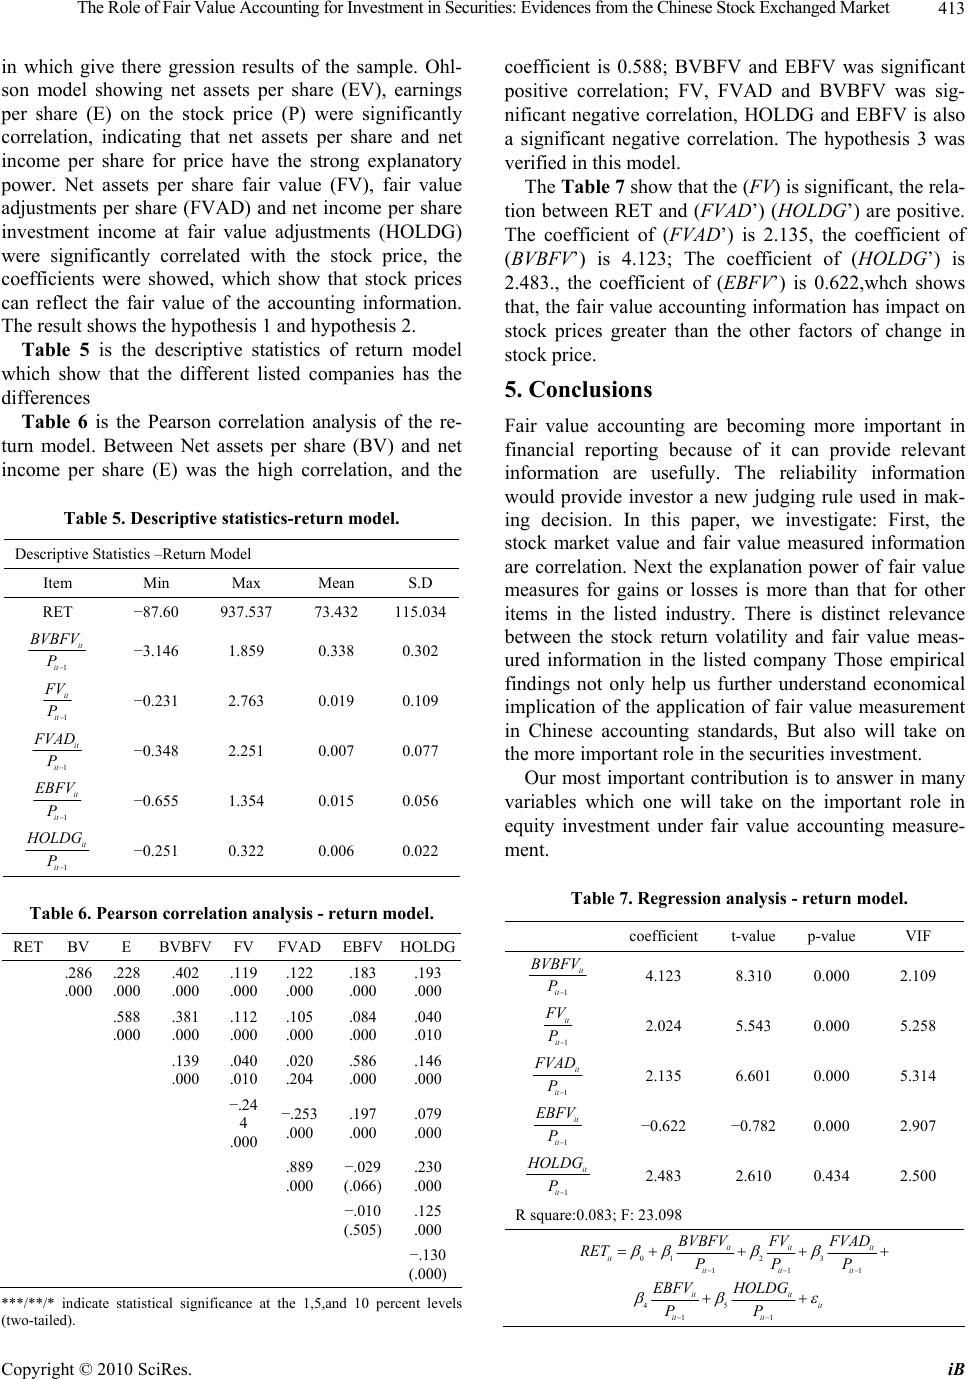 The Role of Fair Value Accounting for Investment in Securities: Evidences from the Chinese Stock Exchanged Market Copyright © 2010 SciRes. iB 413 in which give there gression results of the sample. Ohl- son model showing net assets per share (EV), earnings per share (E) on the stock price (P) were significantly correlation, indicating that net assets per share and net income per share for price have the strong explanatory power. Net assets per share fair value (FV), fair value adjustments per share (FVAD) and net income per share investment income at fair value adjustments (HOLDG) were significantly correlated with the stock price, the coefficients were showed, which show that stock prices can reflect the fair value of the accounting information. The result shows the hypothesis 1 and hypothesis 2. Table 5 is the descriptive statistics of return model which show that the different listed companies has the differences Table 6 is the Pearson correlation analysis of the re- turn model. Between Net assets per share (BV) and net income per share (E) was the high correlation, and the Table 5. Descriptive statistics-return model. Descriptive Statistics –Return Model Item Min Max Mean S.D RET −87.60 937.537 73.432 115.034 1 it it B VBFV P −3.146 1.859 0.338 0.302 1 it it F V P −0.231 2.763 0.019 0.109 1 it it F VAD P −0.348 2.251 0.007 0.077 1 it it EBFV P −0.655 1.354 0.015 0.056 1 it it H OLDG P −0.251 0.322 0.006 0.022 Table 6. Pearson correlation analysis - return model. RET BV E BVBFV FVFVAD EBFVHOLDG .286 .000 .228 .000 .402 .000 .119 .000 .122 .000 .183 .000 .193 .000 .588 .000 .381 .000 .112 .000 .105 .000 .084 .000 .040 .010 .139 .000 .040 .010 .020 .204 .586 .000 .146 .000 −.24 4 .000 −.253 .000 .197 .000 .079 .000 .889 .000 −.029 (.066) .230 .000 −.010 (.505) .125 .000 −.130 (.000) ***/**/* indicate statistical significance at the 1,5,and 10 percent levels (two-tailed). coefficient is 0.588; BVBFV and EBFV was significant positive correlation; FV, FVAD and BVBFV was sig- nificant negative correlation, HOLDG and EBFV is also a significant negative correlation. The hypothesis 3 was verified in this model. The Table 7 show that the (FV) is significant, the rela- tion between RET and (FVAD’) (HOLDG’) are positive. The coefficient of (FVAD’) is 2.135, the coefficient of (BVBFV’) is 4.123; The coefficient of (HOLDG’) is 2.483., the coefficient of (EBFV’) is 0.622,whch shows that, the fair value accounting information has impact on stock prices greater than the other factors of change in stock price. 5. Conclusions Fair value accounting are becoming more important in financial reporting because of it can provide relevant information are usefully. The reliability information would provide investor a new judging rule used in mak- ing decision. In this paper, we investigate: First, the stock market value and fair value measured information are correlation. Next the explanation power of fair value measures for gains or losses is more than that for other items in the listed industry. There is distinct relevance between the stock return volatility and fair value meas- ured information in the listed company Those empirical findings not only help us further understand economical implication of the application of fair value measurement in Chinese accounting standards, But also will take on the more important role in the securities investment. Our most important contribution is to answer in many variables which one will take on the important role in equity investment under fair value accounting measure- ment. Table 7. Regression analysis - return model. coefficient t-value p-value VIF 1 it it B VBFV P 4.123 8.310 0.000 2.109 1 it it F V P 2.024 5.543 0.000 5.258 1 it it F VAD P 2.135 6.601 0.000 5.314 1 it it EBFV P −0.622 −0.782 0.000 2.907 1 it it H OLDG P 2.483 2.610 0.434 2.500 R square:0.083; F: 23.098 012 3 111 45 11 it itit it itit it it it it it it BVBFV FV FVAD RET PPP EBFV HOLDG PP  The Role of Fair Value Accounting for Investment in Securities: Evidences from the Chinese Stock Exchanged Market Copyright © 2010 SciRes. iB 414 REFERENCES [1] R. Ball and P. Brown, “Portfolio Theory and Account- ing,” Jounrnal of Accounting Research, Vol. 6, No. 2, 1968, pp. 159-178. [2] I. Haw, K. Park, D. Qi and W. Wu, “Audit Qualification and Timing of Earnings Announcements: Evidence from China,” Auditing: A Journal of Practice and Theory, Vol. 22, No. 2, 2003, pp. 1-26. [3] Chen, et al., “Is Accounting Information Value-Relevant in the Emerging Chinese Stock Market?” Journal of International Accounting Auditing and Taxation, Vol. 10, No. 1, 2001, pp. 157-175. [4] E. M. Barth, “International Accounting Differences and Their Relation to Share Prices: Evidence from U.K, Australian, and Canadian Firms,” Accounting Research, Vol. 13, No. 1, 1996, pp. 171-176. [5] M. Kohlbeck, “An Analysis of Recent Events on the Perceived Reliability of Fair Value Measures in the Banking Industry,” Florida Atlantic University, Florida, 2008. [6] I. Goncharov, “Paper Profits: The Role of Fair Value Accounting in Dividend Policy,” Amsterdam Businesss School, September 2009. [7] C. Isabel, “The Value Relevance of Investment Property Fair Values,” ISCTE Business School, 2007. [8] Hayn, “Fair Vale, Income Measurement, and Bank Ana- lysis’ Risk Valuation Judgments,” The Accounting Re- view, Vol. 79, 1995, pp. 453-472. [9] Zhu, “Fair Value Accounting-Evidences from B-Share,” China Accounting Information, 2008. [10] Peng, “The Value Relevance of Investment for Fair Value Accounting,” Xia Men University, Xia Men, 2008. [11] Deng, “The Development of Fair Value in China,” Journal of China Ecnomic Research, Vol. 4, No. 1, 2005, pp. 8-28. [12] J. A. Ohlson, “Earnings, Book Values, and Dividends in Equity Valuation,” Contemporary Accounting Reseach, Vol. 11, 1995, pp. 661-687. |