Paper Menu >>
Journal Menu >>
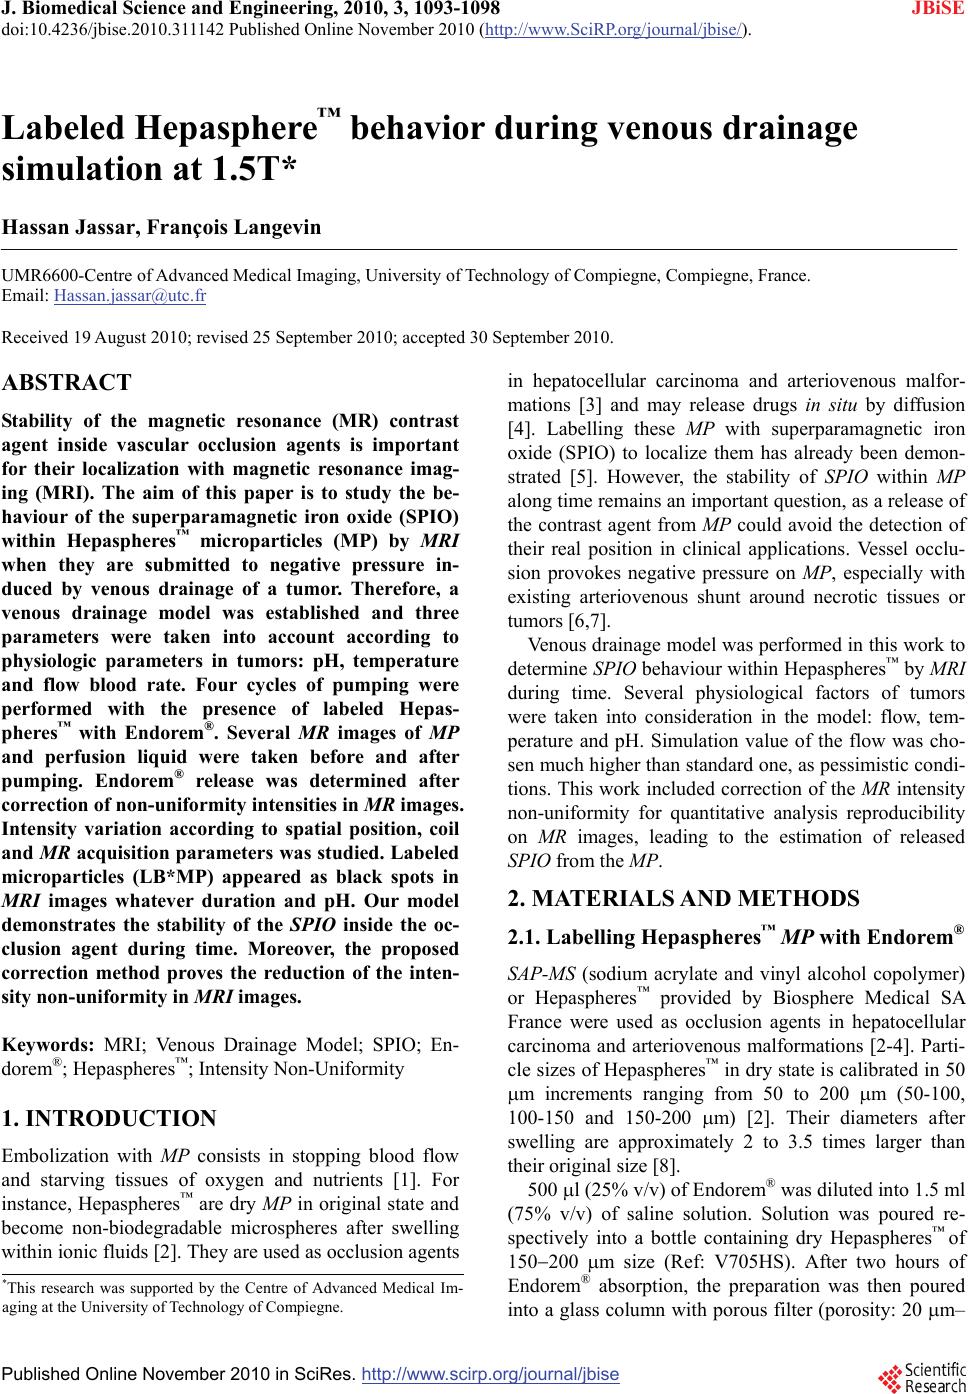 J. Biomedical Science and Engineering, 2010, 3, 1093-1098 JBiSE doi:10.4236/jbise.2010.311142 Published Online November 2010 (http://www.SciRP.org/journal/jbise/). Published Online November 2010 in SciRes. http://www.scirp.org/journal/jbise Labeled Hepasphere™ behavior during venous drainage simulation at 1.5T* Hassan Jassar, François Langevin UMR6600-Centre of Advanced Medical Imaging, University of Technology of Compiegne, Compiegne, France. Email: Hassan.jassar@utc.fr Received 19 August 2010; revised 25 September 2010; accepted 30 September 2010. ABSTRACT Stability of the magnetic resonance (MR) contrast agent inside vascular occlusion agents is important for their localization with magnetic resonance imag- ing (MRI). The aim of this paper is to study the be- haviour of the superparamagnetic iron oxide (SPIO) within Hepaspheres™ microparticles (MP) by MRI when they are submitted to negative pressure in- duced by venous drainage of a tumor. Therefore, a venous drainage model was established and three parameters were taken into account according to physiologic parameters in tumors: pH, temperature and flow blood rate. Four cycles of pumping were performed with the presence of labeled Hepas- pheres™ with Endorem®. Several MR images of MP and perfusion liquid were taken before and after pumping. Endorem® release was determined after correction of non-uniformity intensities in MR images. Intensity variation according to spatial position, coil and MR acquisition parameters was studied. Labeled microparticles (LB*MP) appeared as black spots in MRI images whatever duration and pH. Our model demonstrates the stability of the SPIO inside the oc- clusion agent during time. Moreover, the proposed correction method proves the reduction of the inten- sity non-uniformity in MRI images. Keywords: MRI; Venous Drainage Model; SPIO; En- dorem®; Hepaspheres™; Intensity Non-Uniformity 1. INTRODUCTION Embolization with MP consists in stopping blood flow and starving tissues of oxygen and nutrients [1]. For instance, Hepaspheres™ are dry MP in original state and become non-biodegradable microspheres after swelling within ionic fluids [2]. They are used as occlusion agents in hepatocellular carcinoma and arteriovenous malfor- mations [3] and may release drugs in situ by diffusion [4]. Labelling these MP with superparamagnetic iron oxide (SPIO) to localize them has already been demon- strated [5]. However, the stability of SPIO within MP along time remains an important question, as a release of the contrast agent from MP could avoid the detection of their real position in clinical applications. Vessel occlu- sion provokes negative pressure on MP, especially with existing arteriovenous shunt around necrotic tissues or tumors [6,7]. Venous drainage model was performed in this work to determine SPIO behaviour within Hepaspheres™ by MRI during time. Several physiological factors of tumors were taken into consideration in the model: flow, tem- perature and pH. Simulation value of the flow was cho- sen much higher than standard one, as pessimistic condi- tions. This work included correction of the MR intensity non-uniformity for quantitative analysis reproducibility on MR images, leading to the estimation of released SPIO from the MP. 2. MATERIALS AND METHODS 2.1. Labelling Hepaspheres™ MP with Endorem® SAP-MS (sodium acrylate and vinyl alcohol copolymer) or Hepaspheres™ provided by Biosphere Medical SA France were used as occlusion agents in hepatocellular carcinoma and arteriovenous malformations [2-4]. Parti- cle sizes of Hepaspheres™ in dry state is calibrated in 50 m increments ranging from 50 to 200 m (50-100, 100-150 and 150-200 m) [2]. Their diameters after swelling are approximately 2 to 3.5 times larger than their original size [8]. 500 l (25% v/v) of Endorem® was diluted into 1.5 ml (75% v/v) of saline solution. Solution was poured re- spectively into a bottle containing dry Hepaspheres™ of 150200 m size (Ref: V705HS). After two hours of Endorem® absorption, the preparation was then poured into a glass column with porous filter (porosity: 20 m– *This research was supported by the Centre of Advanced Medical Im- aging at the University of Technology of Compiegne. 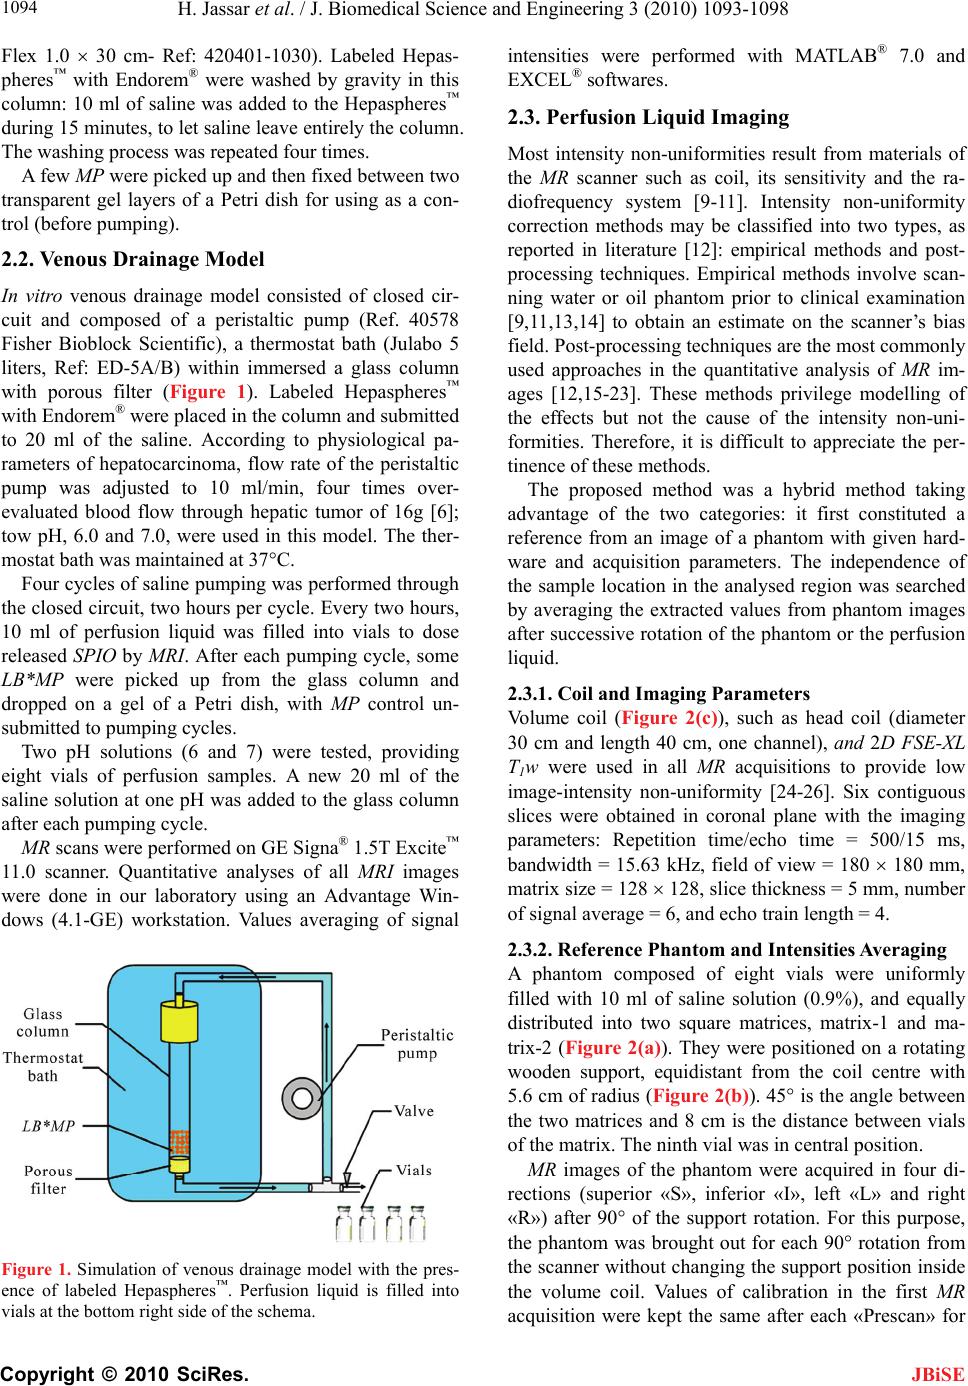 H. Jassar et al. / J. Biomedical Science and Engineering 3 (2010) 1093-1098 Copyright © 2010 SciRes. JBiSE 1094 Flex 1.0 30 cm- Ref: 420401-1030). Labeled Hepas- pheres™ with Endorem® were washed by gravity in this column: 10 ml of saline was added to the Hepaspheres™ during 15 minutes, to let saline leave entirely the column. The washing process was repeated four times. A few MP were picked up and then fixed between two transparent gel layers of a Petri dish for using as a con- trol (before pumping). 2.2. Venous Drainage Model In vitro venous drainage model consisted of closed cir- cuit and composed of a peristaltic pump (Ref. 40578 Fisher Bioblock Scientific), a thermostat bath (Julabo 5 liters, Ref: ED-5A/B) within immersed a glass column with porous filter (Figure 1). Labeled Hepaspheres™ with Endorem® were placed in the column and submitted to 20 ml of the saline. According to physiological pa- rameters of hepatocarcinoma, flow rate of the peristaltic pump was adjusted to 10 ml/min, four times over- evaluated blood flow through hepatic tumor of 16g [6]; tow pH, 6.0 and 7.0, were used in this model. The ther- mostat bath was maintained at 37°C. Four cycles of saline pumping was performed through the closed circuit, two hours per cycle. Every two hours, 10 ml of perfusion liquid was filled into vials to dose released SPIO by MRI. After each pumping cycle, some LB*MP were picked up from the glass column and dropped on a gel of a Petri dish, with MP control un- submitted to pumping cycles. Two pH solutions (6 and 7) were tested, providing eight vials of perfusion samples. A new 20 ml of the saline solution at one pH was added to the glass column after each pumping cycle. MR scans were performed on GE Signa® 1.5T Excite™ 11.0 scanner. Quantitative analyses of all MRI images were done in our laboratory using an Advantage Win- dows (4.1-GE) workstation. Values averaging of signal Figure 1. Simulation of venous drainage model with the pres- ence of labeled Hepaspheres™. Perfusion liquid is filled into vials at the bottom right side of the schema. intensities were performed with MATLAB® 7.0 and EXCEL® softwares. 2.3. Perfusion Liquid Imaging Most intensity non-uniformities result from materials of the MR scanner such as coil, its sensitivity and the ra- diofrequency system [9-11]. Intensity non-uniformity correction methods may be classified into two types, as reported in literature [12]: empirical methods and post- processing techniques. Empirical methods involve scan- ning water or oil phantom prior to clinical examination [9,11,13,14] to obtain an estimate on the scanner’s bias field. Post-processing techniques are the most commonly used approaches in the quantitative analysis of MR im- ages [12,15-23]. These methods privilege modelling of the effects but not the cause of the intensity non-uni- formities. Therefore, it is difficult to appreciate the per- tinence of these methods. The proposed method was a hybrid method taking advantage of the two categories: it first constituted a reference from an image of a phantom with given hard- ware and acquisition parameters. The independence of the sample location in the analysed region was searched by averaging the extracted values from phantom images after successive rotation of the phantom or the perfusion liquid. 2.3.1. Coil and Imaging Parameters Volume coil (Figure 2(c)), such as head coil (diameter 30 cm and length 40 cm, one channel), and 2D FSE-XL T1w were used in all MR acquisitions to provide low image-intensity non-uniformity [24-26]. Six contiguous slices were obtained in coronal plane with the imaging parameters: Repetition time/echo time = 500/15 ms, bandwidth = 15.63 kHz, field of view = 180 180 mm, matrix size = 128 128, slice thickness = 5 mm, number of signal average = 6, and echo train length = 4. 2.3.2. Reference Phantom and Intensities Averaging A phantom composed of eight vials were uniformly filled with 10 ml of saline solution (0.9%), and equally distributed into two square matrices, matrix-1 and ma- trix-2 (Figure 2(a)). They were positioned on a rotating wooden support, equidistant from the coil centre with 5.6 cm of radius (Figure 2(b)). 45° is the angle between the two matrices and 8 cm is the distance between vials of the matrix. The ninth vial was in central position. MR images of the phantom were acquired in four di- rections (superior «S», inferior «I», left «L» and right «R») after 90° of the support rotation. For this purpose, the phantom was brought out for each 90° rotation from the scanner without changing the support position inside the volume coil. Values of calibration in the first MR acquisition were kept the same after each «Prescan» for 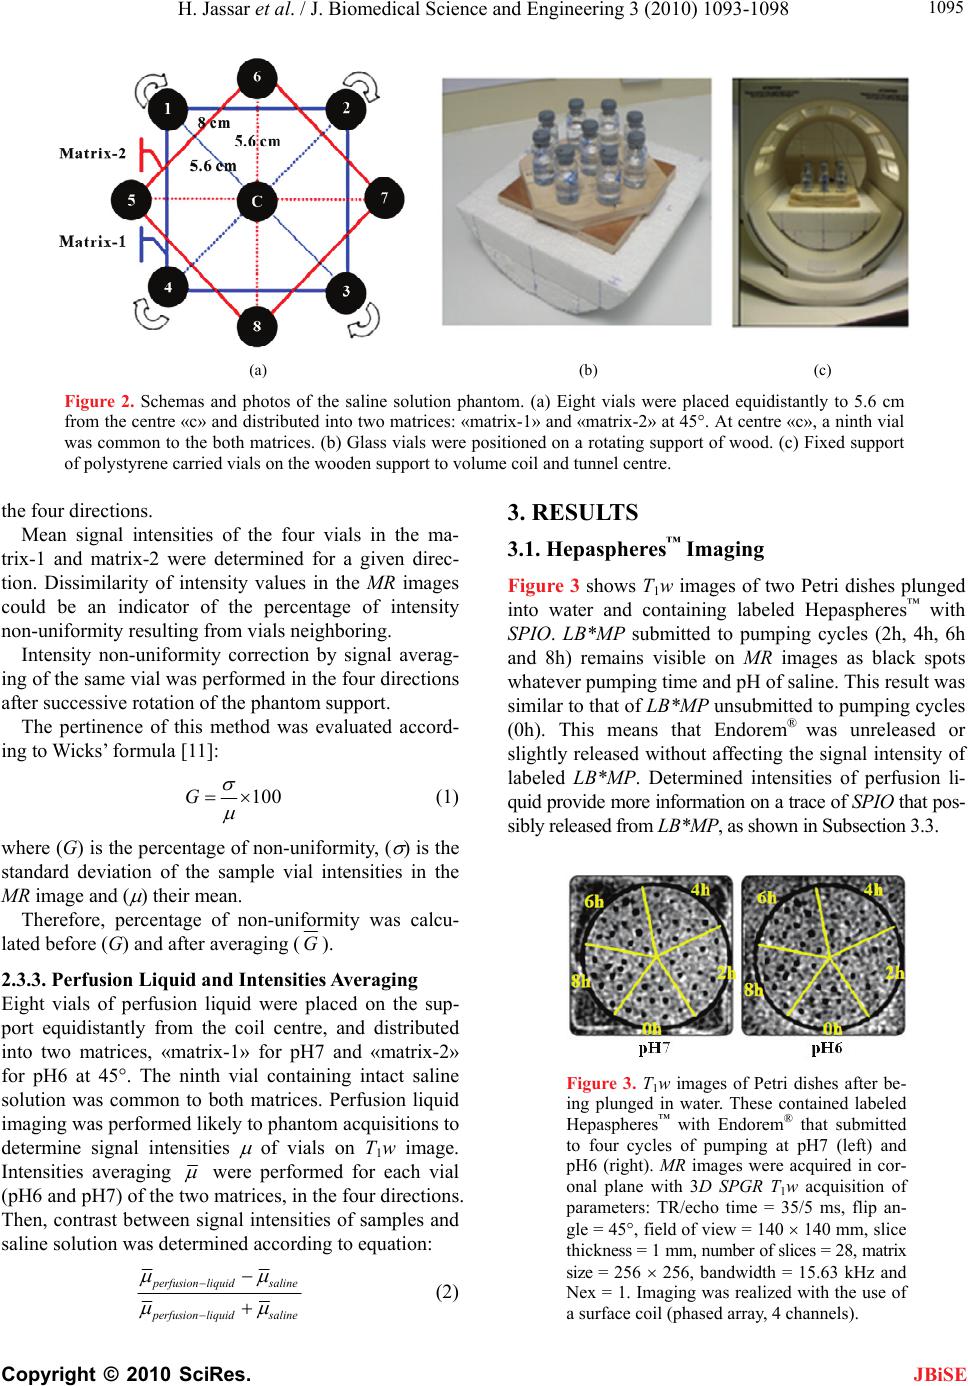 H. Jassar et al. / J. Biomedical Science and Engineering 3 (2010) 1093-1098 Copyright © 2010 SciRes. JBiSE 1095 (a) (b) (c) Figure 2. Schemas and photos of the saline solution phantom. (a) Eight vials were placed equidistantly to 5.6 cm from the centre «c» and distributed into two matrices: «matrix-1» and «matrix-2» at 45°. At centre «c», a ninth vial was common to the both matrices. (b) Glass vials were positioned on a rotating support of wood. (c) Fixed support of polystyrene carried vials on the wooden support to volume coil and tunnel centre. the four directions. Mean signal intensities of the four vials in the ma- trix-1 and matrix-2 were determined for a given direc- tion. Dissimilarity of intensity values in the MR images could be an indicator of the percentage of intensity non-uniformity resulting from vials neighboring. Intensity non-uniformity correction by signal averag- ing of the same vial was performed in the four directions after successive rotation of the phantom support. The pertinence of this method was evaluated accord- ing to Wicks’ formula [11]: 100G (1) where (G) is the percentage of non-uniformity, ( ) is the standard deviation of the sample vial intensities in the MR image and ( ) their mean. Therefore, percentage of non-uniformity was calcu- lated before (G) and after averaging (G). 2.3.3. Perfusion Liquid and Intensities Averaging Eight vials of perfusion liquid were placed on the sup- port equidistantly from the coil centre, and distributed into two matrices, «matrix-1» for pH7 and «matrix-2» for pH6 at 45°. The ninth vial containing intact saline solution was common to both matrices. Perfusion liquid imaging was performed likely to phantom acquisitions to determine signal intensities of vials on T1w image. Intensities averaging were performed for each vial (pH6 and pH7) of the two matrices, in the four directions. Then, contrast between signal intensities of samples and saline solution was determined according to equation: p erfusionliquidsaline p erfusionliquidsaline (2) 3. RESULTS 3.1. Hepaspheres™ Imaging Figure 3 shows T1w images of two Petri dishes plunged into water and containing labeled Hepaspheres™ with SPIO. LB*MP submitted to pumping cycles (2h, 4h, 6h and 8h) remains visible on MR images as black spots whatever pumping time and pH of saline. This result was similar to that of LB* MP unsubmitted to pumping cycles (0h). This means that Endorem® was unreleased or slightly released without affecting the signal intensity of labeled LB*MP. Determined intensities of perfusion li- quid provide more information on a trace of SPIO that pos- sibly released from LB*MP, as shown in Subsection 3.3. Figure 3. T1w images of Petri dishes after be- ing plunged in water. These contained labeled Hepaspheres™ with Endorem® that submitted to four cycles of pumping at pH7 (left) and pH6 (right). MR images were acquired in cor- onal plane with 3D SPGR T1w acquisition of parameters: TR/echo time = 35/5 ms, flip an- gle = 45°, field of view = 140 140 mm, slice thickness = 1 mm, number of slices = 28, matrix size = 256 256, bandwidth = 15.63 kHz and Nex = 1. Imaging was realized with the use of a surface coil (phased array, 4 channels). 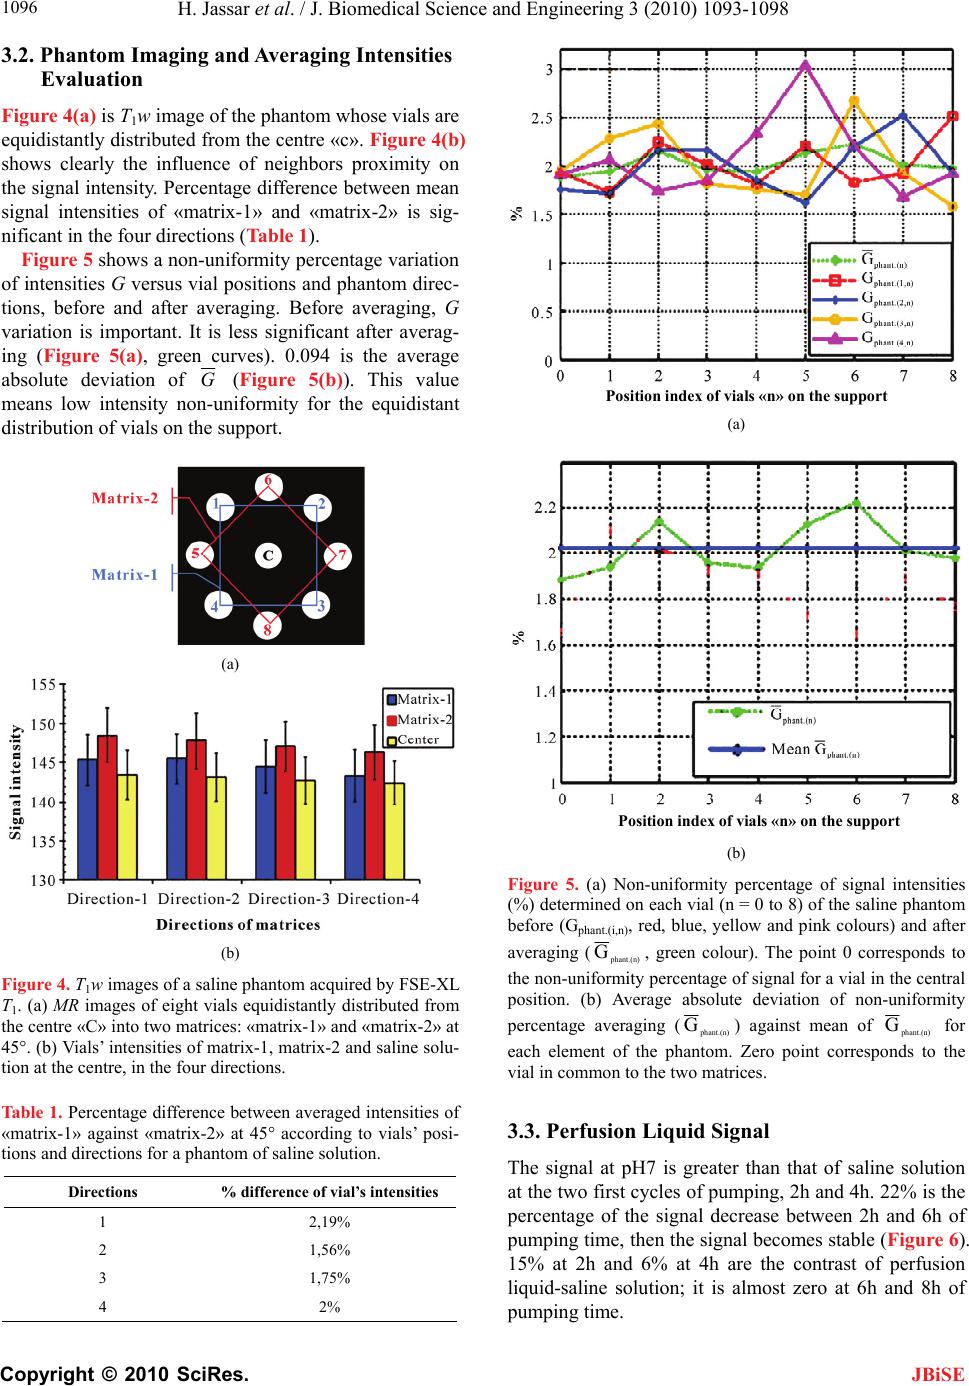 H. Jassar et al. / J. Biomedical Science and Engineering 3 (2010) 1093-1098 Copyright © 2010 SciRes. JBiSE 1096 3.2. Phantom Imaging and Averaging Intensities Evaluation Figure 4(a) is T1w image of the phantom whose vials are equidistantly distributed from the centre «c». Figure 4(b) shows clearly the influence of neighbors proximity on the signal intensity. Percentage difference between mean signal intensities of «matrix-1» and «matrix-2» is sig- nificant in the four directions (Table 1). Figure 5 shows a non-uniformity percentage variation of intensities G versus vial positions and phantom direc- tions, before and after averaging. Before averaging, G variation is important. It is less significant after averag- ing (Figure 5(a), green curves). 0.094 is the average absolute deviation of G (Figure 5(b)). This value means low intensity non-uniformity for the equidistant distribution of vials on the support. (a) (b) Figure 4. T1w images of a saline phantom acquired by FSE-XL T1. (a) MR images of eight vials equidistantly distributed from the centre «C» into two matrices: «matrix-1» and «matrix-2» at 45°. (b) Vials’ intensities of matrix-1, matrix-2 and saline solu- tion at the centre, in the four directions. Table 1. Percentage difference between averaged intensities of «matrix-1» against «matrix-2» at 45° according to vials’ posi- tions and directions for a phantom of saline solution. Directions % difference of vial’s intensities 1 2,19% 2 1,56% 3 1,75% 4 2% Position index of vials «n» on the su pp ort (a) Position index of vials «n» on the su pp ort (b) Figure 5. (a) Non-uniformity percentage of signal intensities (%) determined on each vial (n = 0 to 8) of the saline phantom before (Gphant.(i,n), red, blue, yellow and pink colours) and after averaging ( p hant.(n) G, green colour). The point 0 corresponds to the non-uniformity percentage of signal for a vial in the central position. (b) Average absolute deviation of non-uniformity percentage averaging ( p hant.(n) G) against mean of p hant.(n) G for each element of the phantom. Zero point corresponds to the vial in common to the two matrices. 3.3. Perfusion Liquid Signal The signal at pH7 is greater than that of saline solution at the two first cycles of pumping, 2h and 4h. 22% is the percentage of the signal decrease between 2h and 6h of pumping time, then the signal becomes stable (Figure 6). 15% at 2h and 6% at 4h are the contrast of perfusion liquid-saline solution; it is almost zero at 6h and 8h of pumping time. 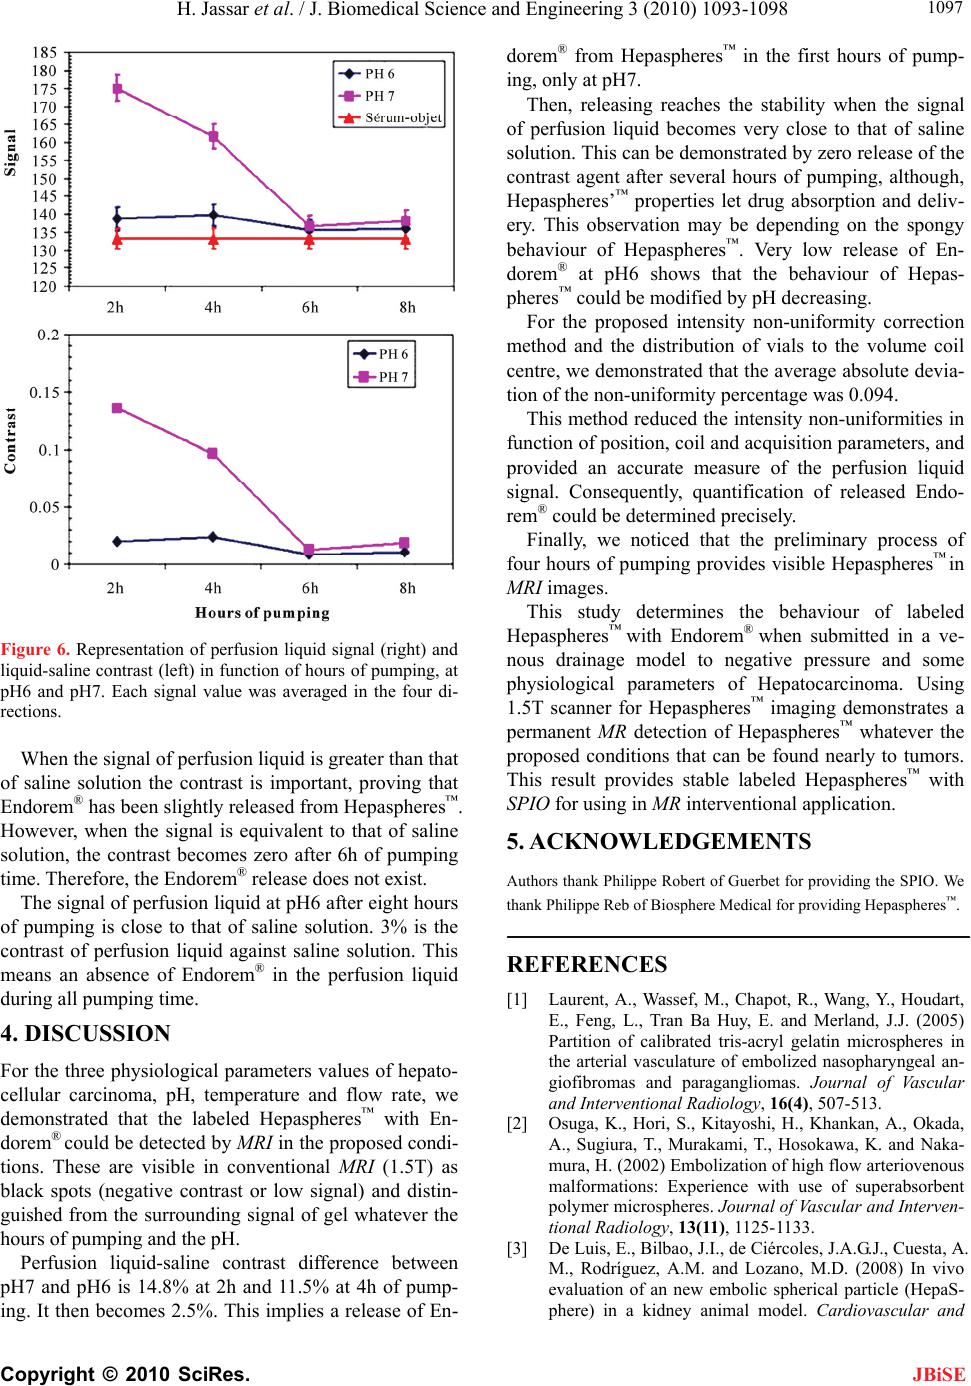 H. Jassar et al. / J. Biomedical Science and Engineering 3 (2010) 1093-1098 Copyright © 2010 SciRes. JBiSE 1097 Figure 6. Representation of perfusion liquid signal (right) and liquid-saline contrast (left) in function of hours of pumping, at pH6 and pH7. Each signal value was averaged in the four di- rections. When the signal of perfusion liquid is greater than that of saline solution the contrast is important, proving that Endorem® has been slightly released from Hepaspheres™. However, when the signal is equivalent to that of saline solution, the contrast becomes zero after 6h of pumping time. Therefore, the Endorem® release does not exist. The signal of perfusion liquid at pH6 after eight hours of pumping is close to that of saline solution. 3% is the contrast of perfusion liquid against saline solution. This means an absence of Endorem® in the perfusion liquid during all pumping time. 4. DISCUSSION For the three physiological parameters values of hepato- cellular carcinoma, pH, temperature and flow rate, we demonstrated that the labeled Hepaspheres™ with En- dorem® could be detected by MRI in the proposed condi- tions. These are visible in conventional MRI (1.5T) as black spots (negative contrast or low signal) and distin- guished from the surrounding signal of gel whatever the hours of pumping and the pH. Perfusion liquid-saline contrast difference between pH7 and pH6 is 14.8% at 2h and 11.5% at 4h of pump- ing. It then becomes 2.5%. This implies a release of En- dorem® from Hepaspheres™ in the first hours of pump- ing, only at pH7. Then, releasing reaches the stability when the signal of perfusion liquid becomes very close to that of saline solution. This can be demonstrated by zero release of the contrast agent after several hours of pumping, although, Hepaspheres’™ properties let drug absorption and deliv- ery. This observation may be depending on the spongy behaviour of Hepaspheres™. Very low release of En- dorem® at pH6 shows that the behaviour of Hepas- pheres™ could be modified by pH decreasing. For the proposed intensity non-uniformity correction method and the distribution of vials to the volume coil centre, we demonstrated that the average absolute devia- tion of the non-uniformity percentage was 0.094. This method reduced the intensity non-uniformities in function of position, coil and acquisition parameters, and provided an accurate measure of the perfusion liquid signal. Consequently, quantification of released Endo- rem® could be determined precisely. Finally, we noticed that the preliminary process of four hours of pumping provides visible Hepaspheres™ in MRI images. This study determines the behaviour of labeled Hepaspheres™ with Endorem® when submitted in a ve- nous drainage model to negative pressure and some physiological parameters of Hepatocarcinoma. Using 1.5T scanner for Hepaspheres™ imaging demonstrates a permanent MR detection of Hepaspheres™ whatever the proposed conditions that can be found nearly to tumors. This result provides stable labeled Hepaspheres™ with SPIO for using in MR interventional application. 5. ACKNOWLEDGEMENTS Authors thank Philippe Robert of Guerbet for providing the SPIO. We thank Philippe Reb of Biosphere Medical for providing Hepaspheres™. REFERENCES [1] Laurent, A., Wassef, M., Chapot, R., Wang, Y., Houdart, E., Feng, L., Tran Ba Huy, E. and Merland, J.J. (2005) Partition of calibrated tris-acryl gelatin microspheres in the arterial vasculature of embolized nasopharyngeal an- giofibromas and paragangliomas. Journal of Vascular and Interventional Radiology, 16(4), 507-513. [2] Osuga, K., Hori, S., Kitayoshi, H., Khankan, A., Okada, A., Sugiura, T., Murakami, T., Hosokawa, K. and Naka- mura, H. (2002) Embolization of high flow arteriovenous malformations: Experience with use of superabsorbent polymer microspheres. Journal of Vascular and Interven- tional Radiology, 13(11), 1125-1133. [3] De Luis, E., Bilbao, J.I., de Ciércoles, J.A.G.J., Cuesta, A. M., Rodríguez, A.M. and Lozano, M.D. (2008) In vivo evaluation of an new embolic spherical particle (HepaS- phere) in a kidney animal model. Cardiovascular and  H. Jassar et al. / J. Biomedical Science and Engineering 3 (2010) 1093-1098 Copyright © 2010 SciRes. JBiSE 1098 Interventional Radiology, 31(2), 367-376. [4] Osuga, K., Khankan, A.A., Hori, S., Okada, A., Sugiura, T., Maeda, M., Nagano, H., Yamada, A., Murakami, T. and Nakamura, H. (2002) Transarterial embolization for large hepatocellular carcinoma with the use of superab- sorbent polymer microspheres: initial experience. Jour- nal of Vascular and Interventional Radiology, 13(9), 929- 934. [5] Jassar, H. (2009) Detectability of vascular occlusion materials for MRI follow-up. Ph.D. Dissertation, Com- piegne University of Technology, Compiegne. [6] Vaupel, P., Rallinowski, F. and Okunieff, P. (1989) Blood flow, oxygen and nutrient supply, and metabolic micro- environment of human tumors: A review. Cancer Re- search, 49(23), 6449-6465. [7] Tancredi, T., McCuskey, P.A., Kan, Z. and Wallace, S. (1999) Changes in rat liver microcirculation after ex- perimental hepathic arterial embolization: Comparison of different embolic agents. Radiology, 12(1), 117-181. [8] Khankan, A.A., Osuga, K., Hori, S., Morii, E., Murakami, T. and Nakamura, H. (2004) Embolic effects of superab- sorbent polymer microspheres in rabbit renal model: comparison with tris-acryl gelatin microspheres and polyvinyl alcohol. Radiation Medicine, 22(6), 384-390. [9] Simmons, A., Arridge, S.R., Barker, G.J. and Williams, S.C. (1994) Sources of intensity nonuniformity in spin echo images at 1.5 T. Magnetic Resonance in Medicine, 32(1), 12-18. [10] Haacke, E.M., Brown, R.W., Thompson, M.R. and Venkatesan, R. (1999) Magnetic resonance imaging. Physical Principles and Sequence Design, Wiley-Liss, New York. [11] Wicks, D.A.G., Barker, G.J. and Tofts, P.S. (1993) Cor- rection of intensity nonuniformity in MR images of any orientation. Magnetic Resonance Imaging, 11(2), 183- 196. [12] Zhou, L.Q., Zhu, Y.M., Bergot, C., Laval-Jeantet, A.M., Bousson, V., Laredo, J.D. and Laval-Jeantet, M. (2001) A method of radio-frequency inhomogeneity correction for brain tissue segmentation in MRI. Computerized Medical Imaging and Graphics, 25(5), 379-389. [13] Axel, L., Constantini, J. and Listerud, J. (1987) Intensity correction in surface-coil MR imaging. American Jour- nal of Roentgenology, 148, 418-420. [14] Simmons, A., Arridge, S.R., Barker, G.J., Cluckie, A.J., and Tofts, P.S. (1994) Improvements to the quality of MRI cluster analysis. Magnetic Resonance Imaging, 12(8), 1191-1204. [15] Styner, M., Brechbuhler, C., Szekely, G. and Gerig, G. (2000) Parametric estimate of intensity inhomogeneities applied to MRI. Medical Imaging, 19(3), 153-165. [16] Lai, S.H. and Fang, M. (1999) A new variational shape- from-orientation approach to correcting intensity inho- mogeneities in magnetic resonance images. Medical Im- age Analysis, 3(4), 409-424. [17] Pham, D.L. and Prince, J.L. (1999) A generalized EM algorithm for robust segmentation of magnetic resonance images. 33rd Annual Conference on Information Sciences and Systems, Baltimore, 558-563. [18] Narayana, P.A. and Bourthakour, A. (1995) Effect of radio frequency inhomogeneity correction on the repro- ducibility of intra-cranial volumes using MR image data. Magnetic Resonance in Medicine, 33(3), 396-400. [19] Vorkurka, E.A., Thaker, N. and Jackson, A. (1999) A fast model independent method for automatic correction of intensity nonuniformity in MRI data. Journal of Mag- netic Resonance Imaging, 10(4), 550-562. [20] Brinkmann, B.H., Manduca, A. and Robb, R.A. (1998) Optimized homomorphic unsharp masking for MR gray- scale inhomogeneity correction. IEEE Medical Imaging, 17(2), 161-171. [21] Likar, B., Viergever, M.A. and Pernus, F. (2000) Retro- spective correction of MR intensity inhomogeneity by information minimization. MICCAI Conference on Medi- cal Image Computing and Computer-Assisted Interven- tion, 1935/2000, Pittsburgh, 375-384. [22] Cohen, M.S., DuBois, R.M. and Zeineh, M.M. (2000) Rapid and effective correction of RF inhomogeneity for high field magnetic resonance imaging. Human Brain Mapping, 10(4), 204-211. [23] Han, C., Hatsukami, T.S. and Yuan, C. (2001) A multi- scale method for automatic correction of intensity non- uniformity in MR images. Proceedings of International Society for Magnetic Resonance in Medicine, 13(3), 428- 436. [24] Hayes, C.E., Edelstein, W.A., Schenck, J.F., Otward, M. M. and Eash, M. (1985) An efficient, Highly Homoge- neous Radiofrequency Coil for whole-body NMR Imag- ing at 1.5 T. Journal of Magnetic Resonance, 63, 622- 628. [25] Simmons, A., Tofts, P.S., Barker, G.J. and Arridge, S.R., (1994) Sources of intensity non uniformity in spin echo images at 1.5T. Magnetic Resonance in Medicine, 32(1), 121-128. [26] Barker, G.J., Simmons, A., Arridge, S. R. and Tofts, P.S., (1998) A simple method for investigating the effects of non-uniformity of radiofrequency transmission and ra- diofrequency reception in MRI. The Britch Journal of Radioliogy, 71(841), 59-67. |