Engineering
Vol.6 No.8(2014), Article
ID:47755,12
pages
DOI:10.4236/eng.2014.68043
Active Control Method for Critical Cornering Range
Takahiko Yoshino, Hiromichi Nozaki
Department of Mechanical Engineering, University of Kogakuin, Tokyo, Japan
Email: ad12002@ns.kogakuin.ac.jp
Copyright © 2014 by authors and Scientific Research Publishing Inc.
This work is licensed under the Creative Commons Attribution International License (CC BY).
http://creativecommons.org/licenses/by/4.0/


Received 30 April 2014; revised 2 June 2014; accepted 13 June 2014
ABSTRACT
It has been reported that steering systems with derivative terms have a heightened lateral acceleration and yaw rate response in the normal driving range. However, in ranges where the lateral acceleration is high, the cornering force of the front wheels decreases and hence becomes less effective. Therefore, we applied traction control for the inner and outer wheels based on the steering angle velocity to improve the steering effectiveness at high lateral accelerations. An experiment using a driving simulator showed that the vehicle’s yaw rate response improved for a double lane change to avoid a hazard; this improves hazard avoidance performance. Regarding improved vehicle control in the cornering margins, traction control for the inner and outer wheels is being developed further, and much research and development has been reported. However, in the total skid margin, where few margin remains in the forward and reverse drive forces on the tires, spinout is unavoidable. Therefore, we applied tire camber angle control to improve vehicle maneuverability in the total skid margin. An experiment using a driving simulator has confirmed that the vehicle’s lateral acceleration at the turning limit can be improved by controlling the camber angle. Because of this, camber angle control promises to be more effective than traction control for the inner and outer wheels. By applying this type of steering control, it is possible to increase maneuverability and stability in the cornering margins.
Keywords:Motion Control, Automobile, Vehicle Dynamics, Maneuverability, Active Safety

1. Introduction
Studies of steering systems with differential terms, generally called differential steering, have been conducted by Hirao [1] [2] , and the optimum ranges for these systems have been presented by Nakaya et al. [3] [4] . These studies report that the yaw rate and lateral acceleration response can be increased in the normal driving range by using differential steering. However, although this is effective in the lower lateral acceleration range (where the cornering force in the front wheels is stable), in the higher lateral acceleration range, the cornering force of the front wheels declines, and the desired effect cannot be obtained. Based on these results, instead of advancing the steering angle phase according to the steering angular velocity, we hypothesized that changing the drive force balance of the inner and outer wheels can produce the desired yaw moment and thereby improved steering effectiveness in the high lateral acceleration range, provided the tires have a margin in their forward and reverse drive forces.
With regard to improved vehicle control in critical cornering, direct yaw moment control (DYC) systems have been developed, and a great deal of research and development has been reported [5] -[7] . To prevent spinning out at high lateral accelerations with DYC, breaking force needs to be applied to the outer wheels, which have increased wheel load and a greater friction circle due to the load shift from the inner to outer wheels. However, few breaking force can be applied to the outer wheels in the total skid margin, where few margin remains in the forward and reverse forces of the tires, and spin cannot be prevented [8] . Therefore, we hypothesized that if the tires’ camber angle is controlled proactively, the vehicle’s maneuverability in the total skid margin can be improved. This study has used a driving simulator that can simulate drift cornering to investigate spin prevention in critical cornering ranges and steering control that can respond to situations such as an abrupt lane change to avoid a hazard. We report on the results, which demonstrate that this control promises to be remarkably effective.
2. Experimental Apparatus
2.1. Driving Simulator to Simulate Drift Cornering
For the experiment in this study, we used a driving simulator with a motion device, which is able to simulate extensive yawing behavior and lateral acceleration through triaxial control (yaw, roll, and lateral translational). Dynamic behaviors such as spin or drift in the critical cornering areas can therefore be reproduced. The driving simulator consists of a PC for control, a motion device, and control panels, and it performs triaxial control based on the yaw rate and the lateral acceleration generated by CarSim (the driving simulator). The driving simulator configuration is shown in Figure 1, and the motion device dimensions and performance are shown in Table1 Black curtains were drawn around the test subjects to enhance the sensation of actually driving, and the subjects operated the vehicle based on moving images of the driving situations projected on the display.
2.2. Vehicle Model
For the vehicle model in the driving simulator, CarSim was introduced, which is a full-vehicle simulator developed by the Mechanical Simulation Corporation (MSC: USA). Table 2 lists the main vehicle components and their degrees of freedom. The dimensions of the four-wheel drive (4WD) vehicle used in this experiment are shown in Table3
For the tire cornering force characteristics, we used general tire characteristics, as shown in Figure 2. The maximum cornering force is at a slip angle of 10˚, and the acceleration and deceleration characteristics are as

Figure 1. Driving simulator.

Table 1. Parameters and performance of driving simulator.
Table 3. Parameters for calculation.
shown in Figure 3. When the slip angle and slip ratio are added simultaneously, they are calculated using the friction circle concept based on CarSim’s combined characteristics calculations. Accordingly, since the aforementioned friction circle concept is used, driving in ranges that exceed the limitations can be simulated, just as in an actual car. When accelerating during the critical limits of cornering, the rear wheels’ maximum lateral force decreases with an increase in rear-wheel drive force, and the vehicle, unable to withstand the centrifugal force, begins to spin; otherwise, controlling the direction of travel of the front part of the body through a countersteer can put the vehicle into drift cornering. The final behavior in this study demonstrates a rear-wheel skid. The grip limit in this paper is therefore given for the point where the rear wheels generate the maximum cornering force.
3. Traction Control for Inner and Outer Wheels Based on Steering Angle Velocity
3.1. Control Methods
Symbols:
T: true drive force T0: initial inner and outer wheel drive force
 : steering angular velocity P: drive force constant The method of traction control for the inner and outer wheels based on the steering angle velocity is given in Equation (1). This method produces the actual 4WD force by adding the initial inner and outer wheel drive force T0 and the product of the drive force constant P and the steering angular velocity
 , where the driver’s steering is differentiated. By changing the value of P, it is possible to moderate the effect of the traction control for the inner and outer wheels based on the steering angle velocity. In Equation (1), the drive force on the outer wheel acts in the + direction, and the drive force on the inner wheel acts in the − direction. As the outer wheel drive force increases and the inner wheel drive force decreases in proportion to the steering angular velocity for hazard avoidance, the turning moment can be obtained with this steering method, and the steering effect can be expected to improve. Moreover, when handling is ceased, there is no more drive force assistance through the steering angular velocity, and it stabilizes in its steady state. Specifically, we built a control block in Simulink (which is part of the driving simulator in Section 2) for the running tests and investigated the control effectiveness.

Figure 2. Tire cornering force characteristics.

Figure 3. Longitudinal tire force characteristics.
 (1)
(1)
3.2. Experimental Method
In this study, we ran an experiment for a situation where a double lane change is executed to avoid a hazard and investigated the vehicle motion characteristics. The experimental course is shown in Figure 4. The vehicle was steered through a double lane change course set up using traffic cones, and at a maximum passing speed of 120 km/h, the vehicle enters the course traveling straight forward and is steered so that it stays in the lane. The vehicle was set to maintain a specified velocity range. The subjects were instructed to concentrate on the handling and to follow the target course. The experiment was conducted for four scenarios; traction control for the inner and outer wheels based on the steering angle velocity was performed with a drive force constant of P = 0.05, P = 0.1, P = 0.2, as well as P = 0 (to simulate a conventional 4WD system without this control system). A subject was considered to have performed the experiment successfully if they completed the course and to have failed if they deviated substantially from the course or spun out the vehicle. The experiment was run five times for each drive force constant in random. Afterwards, the subjects graded the ease of driving the vehicle in five grades. The experiment was executed by a total of four subjects: two subjects were comparatively familiar with driving a car (subjects A and D), one subject had a driving license and occasionally drove (subject C), and one subject had a driving license but hardly ever drove a vehicle (subject B). The subject characteristics are listed in Table4 The subjects were asked to do a 30-minute training session before the experiment to familiarize themselves with operating the driving simulator.
3.3. Results of the Double Lane Change Course Experiment and Observations Based on the Running Data
Figure 5 show the experimental results for subject D (the experimental results for the other subjects showed similar trends). The travel trajectory for the double lane change presented in Figure 5(a) shows that the conventional vehicle (P = 0) left the track at around 180 m, drifted outwards, and could not return. On the other hand, the vehicles using traction control for the inner and outer wheels based on the steering angle velocity did not drift outwards and instead converged and traveled in a stable manner. For P = 0.1, P = 0.05, and P = 0.2, the course was followed. For P = 0.1, there was no drifting at the end of the single lane change (around 150 m), and there was also little deviation near the course exit; it displayed the most stable trajectory. The next best drive force constant in terms of course tracking performance was P = 0.05, followed by P = 0.2. Use of this steering method prevented the vehicle from substantially drifting outward and allowed for a smooth course completion.
The experimental results for the body slip angle presented in Figure 5(b) show that the slip angle decreased when the present steering control was applied. At each variation, the steering wheel was turned starting at around 2.5 seconds, but through the application of inner and outer wheel drive force and brake force control, sideslip during the initial steering period was suppressed. In a double lane change, for P = 0.1, the vehicle’s sideslip was controlled to within ±7.8˚, and it can also be said that convergence is quick, and travel is stable. For P = 0.2, the angles are within ±8.5˚. Grip cornering was possible for P = 0.1 and P = 0.2, whereas at P = 0.05

Figure 4. Double lane change.
Table 4. Subject characteristics.
and P = 0, the body slip angles exceeded 10˚, and the vehicle movement entered the drift range. For P = 0.05, the slip angle increased to a maximum of 11˚ but converged afterwards. For P = 0, the slip angle exceeded 10˚ and entered the drift range at around 4.2 seconds, and the maximum value was 13˚. A reduction of approximately 64% was achieved for the body slip angle when executing a double lane change between P = 0 to P = 0.1.
The experimental results for the yaw rate in Figure 5(c) show that for P = 0 (where no control is applied), the yaw rate was slow to start at around 4.5 sec and was at its maximum at around 5.6 sec, but when control was applied, the yaw rate was quick to start, and the maximum value was also lower. The response was particularly improved for P = 0.1.
The experimental results for the steering wheel angle presented in Figure 5(d) show that through inner and outer wheel drive force and brake force control, P = 0.1 allowed for travel with the smallest amount of steering, correction by minute steering corrections, and the most stable travel. At around 5 seconds, for P = 0.1 and P = 0.2 (where the drive force and brake force assistance were high), the steering was swift, the vehicle movement converged, and the steering amount was small. The steering amount ended up large for P = 0.05 and P = 0, which had little or no assistance through drive force and brake force control.
After the experiment, we performed a five-grade subjective evaluation of the subjects’ impressions and a quantitative analysis using average values and standard deviations (Figure 6). In the subjective evaluation, P = 0.1, P = 0.2, P = 0.05, and P = 0 were ranked in that order. P = 0.1 and P = 0.2 were ranked highly because of the grip during travel. As for P = 0.05, some subjects entered the drift range, which caused a lower ranking. P = 0
 (a)
(a) (b)
(b) (c)
(c) (d)
(d)
Figure 5. Experiment results. (a) Running trajectory; (b) Vehicle body slip angle; (c) Yaw rate; (d) Steering wheel angle.

Figure 6. Subjective analysis.
had the lowest ranking because all of the subjects entered the drift range or veered off course. Compared to P = 0.2, for P = 0.1, convergence of the body slip angle promptly stabilized and was therefore ranked highest by all of the subjects.
4. Comparison of Results for Camber Angle Control and Braking Force Control in Critical Regions
To prevent spin using DYC in areas where lateral acceleration is high, the wheel load needs to be increased by shifting the loads on the inner and outer wheels, and braking force needs to be applied on the outer wheels, where the friction circle is greater. However, in the total skid margin, where tires have few remaining forward or reverse force, few braking force can be applied to the outer wheels, and spin cannot be prevented. Therefore, we hypothesized that camber angle control can be expected to be more effective than DYC. We compared it with braking force control to clarify the effectiveness of camber angle control in the total skid margin.
4.1. Control Method
4.1.1. Braking Force Control
Symbols:
BFout: outer wheel braking force F: braking force constant Tout: outer wheel drive force
β: body slip angle When the slip angle exceeds 10˚ (the body slip angle at maximum cornering force), braking force control controls the yaw moment, reduces the increase in the body slip angle, and prevents spin by applying braking force to the outer front and rear wheels. The control rule is given in Equation (2). The rotating direction is determined to be clockwise or counter-clockwise from the body slip angle, and when the body slip angle exceeds 10˚, the braking force is output as the product of the drive force of the outer front or rear wheels, the braking force constant, and the body slip angle. The braking force constant is set to 0.5.
 (2)
(2)
4.1.2. Camber Angle Control
Camber angle control changes the outer front wheel 20˚ into the positive camber direction when the body slip angle exceeds 10˚ (the body slip angle at maximum cornering force). Spin is prevented by controlling the camber angle in this direction with countersteer assist. The outer rear wheel is changed 20˚ into the negative camber direction when the body slip angle exceeds 10˚. To make efficient use of the camber thrust effect, tires having a round shape for the ground contact area such as with motorcycle tires are assumed. Figure 7 shows the tire sideforce characteristics at the point of major camber angle change (values derived using the Magic Formula tire model [10] ).
4.2. Experimental Method
The test course was the circular course shown in Figure 8. The speed was set at a constant 80 km/h (a relatively high speed) in order to induce cornering with drifting. Subjects were instructed to follow the target course without any instructions regarding driving methods (e.g., drifting or gripping). To confirm the control effect for both the front and rear wheels, the experiment was executed under the following three conditions: no vehicle control (Normal), braking force control (BF control), and camber control (Camber control). For the front wheels, this means no control, outer front wheel braking force control, and outer front wheel positive camber angle control; for the rear wheels, this means no control, outer rear wheel braking control, and outer rear wheel negative camber angle control. The experimental conditions for the front and rear wheels are shown in Table 5 and Table6
The subjects were deemed to have been successful if they completed one lap of the course and to have failed if they deviated substantially from the course or if the vehicle spun out. The experiment was run five times for each control at random. Afterwards, a five-grade evaluation was performed on the subjects’ impressions regarding the drivability of the vehicle. The subjects were the drivers listed in Table4 The subjects were asked to complete a 30-minute training session before the experiment to familiarize themselves with operating the driving simulator.

Figure 7. Lateral tire force characteristics.

Figure 8. Turning course.
Table 5. Experimental conditions of the outer front wheel.
Table 6. Experimental conditions of the outer rear wheel.
4.3. Results of the Circular Course Experiment and Observations Based on the Running Data
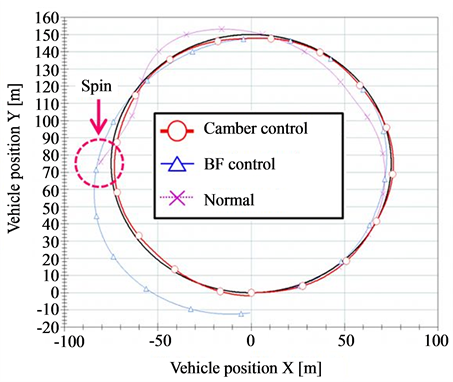
Figure 9 show the experimental results for subject C for front-wheel control (the experimental results for the other subjects showed similar trends). Because of the course’s circular trajectory (Figure 9(a)), it is impossible to adhere to the course without control, and the vehicle veers significantly from the course and spins out. With braking force control, the vehicle veers off the circular track by approx. 15 m at about the  mark of the course. With front-wheel positive camber angle control, the vehicles were mostly able to adhere to the course.
It can be seen from the experimental results for the body slip angle shown in Figure 9(b) that without any control, the body slip angle increased dramatically from around 3 seconds and resulted in a spinout. With braking force control, the body slip angle increased to a maximum of 27˚. With front-wheel positive camber angle control, the body slip angle was kept to approximately 19˚ through the effect of camber thrust and was the most stable. Compared to braking force control, camber angle control enabled a reduction of 30% in the vehicle’s sideslip.
Regarding the steering wheel angle shown in Figure 9(c), without any control, there was countersteer movement from around 1 second, but that was too late, and the vehicle spun out. With braking force control, it was clear that the body was controlled by applying countersteer. For front-wheel positive camber angle control, the steering wheel angle fell within 12˚ and was the most stable. Through camber angle control, the camber thrust works in the direction of the countersteer assist, and the degree of countersteer required can be reduced.
In terms of the lateral acceleration shown in Figure 9(d), without control, the lateral acceleration was 0.8 G to 0.8 G, whereas with braking force control, it was 0.8 G to −0.2 G (a significant change), and the behavior is unstable. With front-wheel positive camber angle control, the body could be controlled in the lateral acceleration range of 0.8 G to 0.5 G by controlling the camber angle at times of drift cornering.
 (a)
(a) (b)
(b) (c)
(c) (d)
(d)
Figure 9. Experiment results (front wheel). (a) Running trajectory; (b) Vehicle body slip angle; (c) Steering wheel angle; (d) Lateral acceleration.
After the driving experiment, a five-grade evaluation of the subjects’ impressions as well as a quantitative analysis using average values and standard deviations were performed. The results of this evaluation are shown in Figure 10. Front-wheel positive camber angle control, braking force control, and no control were ranked in that order. Camber angle control substantially suppresses any increase in body slip and was most highly rated by subjects A, C, and D. Subject B rated it low since the vehicle had a tendency to understeer with camber angle control.
Figure 11 show the experimental results for subject A for rear-wheel control (the experimental results for the other subjects showed similar trends). For the experimental course trajectory shown in Figure 11(a), the vehicle spun out and was unable to drive further without control at about  of the circular track, whereas the vehicle substantially deviated from the course with braking force control. With rear-wheel negative camber angle control, the vehicle was most able to adhere to the course.
As seen from the experimental results for the body slip angle shown in Figure 11(b), the vehicle spins out at around 16 seconds without any control. With braking control, the body slip angle changes to a maximum of 32˚. With rear-wheel negative camber angle control, body sideslip is reduced most with a maximum body slip angle of 18˚ through the camber thrust effect. Compared to braking force control, vehicle sideslip is suppressed by 40% through the use of camber angle control.
The steering angle results in Figure 11(c) show that although the steering wheel was turned to its maximum, the vehicle could not be driven in a stable manner without control. With braking control and rear-wheel negative camber angle control, the body was controlled by applying countersteer, but the steering wheel angle changed to a lesser degree in the case of camber angle control.
The degree of vehicle lateral acceleration in Figure 11(d) shows that without any control, the lateral acceleration changes substantially, and the behavior is unstable. With braking force control, the vehicle’s lateral acceleration decreases in the critical cornering area, and the vehicle is controlled by lowering the cornering limit. With rear-wheel negative camber angle control, the vehicle’s critical lateral acceleration in turning is improved by changing the rear-wheel negative camber direction when drift cornering.
After the experiment, a five-grade evaluation regarding the subjects’ impressions and a quantitative analysis using the average values and standard deviations were performed. The results of the subjective evaluations are shown in Figure 12. All of the subjects ranked the options in the following order: camber angle control, braking force control, and no control. The efficiency of rear-wheel negative camber control can be said to be extremely high. Braking force control was ranked lower by all of the subjects because of its understeer tendency. The nocontrol option was ranked the worst since the vehicle was difficult to control, despite full operation of the steering wheel.
5. Conclusions
In this study, we investigated the effectiveness of traction control for the inner and outer wheels based on the steering angle velocity to improve maneuverability and stability during hazard avoidance. We found that hazard avoidance performance improves by changing the drive force and brake force between the inner and outer

Figure 10. Subjective analysis (front wheel).
 (a)
(a) (b)
(b) (c)
(c) (d)
(d)
Figure 11. Experiment results (rear wheel). (a) Running trajectory; (b) Vehicle body slip angle; (c) Steering wheel angle; (d) Lateral acceleration.

Figure 12. Subjective analysis (rear wheel).
wheels based on the steering angular velocity within the critical grip area. It is greatly effective in avoiding hazards, which requires maneuvers such as double lane changes. Moreover, by using the steering angular velocity, the yaw moment can be quickly generated to boost the steering.
Furthermore, we focused on camber angle control and compared its effectiveness with braking force control in a circular turning experiment (to prevent spin in the total skid margin). A comparison of positive camber angle control and braking force control on the front wheels showed that front-wheel positive camber angle control better suppresses vehicle sideslip and has better course tracking capacity. Moreover, although countersteer becomes a burden on the driver, camber thrust works through camber angle control in the direction that assists countersteer, thus lowering the degree of countersteer required and reducing the burden on the driver. Comparing negative camber angle control and braking force control on the rear wheels, the effect on the total skid margin with braking force control was small as it lowers and controls the critical lateral acceleration. Negative camber angle control enables a vehicle to return to the gripping range by raising the critical lateral acceleration (even in the range where the wheels start to sideslip) and promises to be more effective than braking force control. Therefore, it is clear that camber angle control promises to be more effective than outer and inner drive force and brake force control, which hs little effect on the total skid margin, where few forward or reverse force margin remains.
References
- Hirao, O. (1969) On the Steering System which has a Derivative Term for the Improvement of the Stability of Anthro-Mobile. Journal of Society of Automotive Engineers of Japan, 23, 48-54.
- Hirao, O. (1966) Improved Dynamic Characteristic of Automobile Steering System—Case of an Automobile Driven by a Man. Journal of Society of Automotive Engineers of Japan, 20, 995-1002.
- Nakaya, H. (1994) Lateral Motion Control Performance of a Vehicle with Differential Terms. Proceedings of Annual Conference of Society of Automotive Engineers of Japan, October 1995, 133-136. http://dx.doi.org/10.1016/0389-4304(95)94727-5
- Miyamori, A. and Nakaya, H. (1997) The Optimum Differential Terms for Lateral Motion Control Performance on the Vehicle. Proceedings of Annual Conference of Society of Automotive Engineers of Japan, October 1997, 101-104.
- Shibahata, Y., Shimada, K. and Tomari, T. (1993) Improvement of Vehicle Maneuverability by Direct Yaw Moment Control. Journal of Society of Automotive Engineers of Japan, 47, 54-60. http://dx.doi.org/10.1080/00423119308969044
- Shibahata, Y., Kuriki, N. and Mori, A. (1998) Development of Active Torque Transfer System. Journal of Society of Automotive Engineers of Japan, 52, 79-86.
- Shimada, K. and Shibahata, Y. (1994) Analysis of Vehicle Dynamic Characteristics with a β-Yaw Moment Diagram— Comparison of Three Different Active Chassis Control Methods. Transactions of the Society of Automotive Engineers of Japan, 25, 122-127.
- Fukushima, N. (2004) DYC Control for Turning Vehicle Over Critical Range—1st Report, Application to Front Engine Rear Wheel Drive Vehicle. Transactions of the Japan Society of Mechanical Engineers C, 70, 219-226. http://dx.doi.org/10.1299/kikaic.70.2399
- Watanabe, Y. and Sayers, M.W. (2002) A Extending Vehicle Dynamics Software for Analysis, Design, Control, and Real-Time Testing. Proceedings of AVEC’02, 4545, 407-412.
- Pacejka, H.B. (2012) Tire and Vehicle Dynamics. 3rd Edition, Butterworth-Heinemann, Oxford.