Journal of Information Security
Vol. 3 No. 1 (2012) , Article ID: 16725 , 7 pages DOI:10.4236/jis.2012.31003
A Multi-Stage Network Anomaly Detection Method for Improving Efficiency and Accuracy
Graduate School of Information Sciences (GSIS), Tohoku University, Miyagi, Japan
Email: wai@ecei.tohoku.ac.jp
Received September 29, 2011; revised October 27, 2011; accepted November 10, 2011
Keywords: Network Anomaly Detection; Timeslot-Based Analysis; Flow-Based Analysis; Multi-Stage Traffic Analysis; Flow Reduction
ABSTRACT
Because of an explosive growth of the intrusions, necessity of anomaly-based Intrusion Detection Systems (IDSs) which are capable of detecting novel attacks, is increasing. Among those systems, flow-based detection systems which use a series of packets exchanged between two terminals as a unit of observation, have an advantage of being able to detect anomaly which is included in only some specific sessions. However, in large-scale networks where a large number of communications takes place, analyzing every flow is not practical. On the other hand, a timeslot-based detection systems need not to prepare a number of buffers although it is difficult to specify anomaly communications. In this paper, we propose a multi-stage anomaly detection system which is combination of timeslot-based and flow-based detectors. The proposed system can reduce the number of flows which need to be subjected to flow-based analysis but yet exhibits high detection accuracy. Through experiments using data set, we present the effectiveness of the proposed method.
1. Introduction
In recent years, intrusions such as worms and denial of service attack have become a major threat to the Internet. In particular, novel intrusions such as novel worms and zero-day attacks are increasing and are responsible for a big damage to the Internet. For detecting intrusions, Network Intrusion Detection Systems (NIDSs) have gained attention. NIDSs are classified into misuse detection system and anomaly detection system.
In misuse detection systems such as Snort [1], intrusions are detected by matching signatures which are prepared manually in advance. They are highly popular in network security because they exhibit higher detection accuracy and generate fewer false positives for known intrusions than anomaly detection systems. However, developing signatures is cumbersome and time-consuming task because they have to be made by security experts manually. Therefore, novel intrusions can cause a significant damage to the Internet before signatures are developed.
On the other hand, anomaly detection systems such as NIDES [2] and ADAM [3] can detect unknown intrusions. This is because these methods detect intrusions based on the deviation from the normal behavior, and thus do not require a pre-hand knowledge of intrusions.
However, these methods tend to generate more false positives than signature base IDSs. Although a lot of researchers carried out to increase the detection accuracy, still higher detection accuracy is demanded. Therefore, we focus our research on anomaly detection systems.
In anomaly detection systems, network traffic is analyzed using observation units such as timeslot and flow. A timeslot-based detection has an advantage of being able to detect network anomaly states effectively. On the other hand, the flow-based analysis is capable of examining each communication in a more detail form. Our group has proposed a combination of timeslot-based and flow-based detections and shown its effectiveness [4]. However, in a flow-based analysis, a large number of buffers have to be prepared. Analyzing all flows of network traffic is not realistic, and the buffer size can be vulnerability to Denial of Service (DoS) attacks because all flow analysis can result in a buffer overflow.
In this paper, we propose a high accuracy multi-stage anomaly detection system which can reduce the number of flows necessary to be analyzed. The proposed system consists of two detection stages. The first stage is a timeslot-based detector which picks up flows need to be analyzed by flow-based detector in detail. It then inspects only these suspicious flows in the second stage, thus, computational load and buffer size to analyze flows can be reduced.
The remainder of this paper is organized as follows. Section 2 explains timeslot-based and flow-based analyses, and mentions issues in a combination of these analyses. In Section 3, we proposed a multi-stage anomaly detection system. Evaluation of the proposed system is presented in Section 4. Finally, Section 5 concludes this paper.
2. Combination of Timeslot-Based and Flow-Based Analyses
Anomaly detection systems generally analyze traffic in observation units such as timeslots and flows. In this section, we explain these units for the intrusion detection and introduce a conventional method which combines the two detectors. Furthermore, issues in the conventional method are also presented.
2.1. Timeslot-Based Analysis
Anomaly detection often uses timeslot-based analysis [4-6]. In this method, the overall traffic is separated into timeslots of fixed length and its features, which are numerical values representing the network state, are extracted from traffic in the timeslot. It has an advantage of low buffer storage since this analysis releases buffers after each timeslot. However, it is difficult for this method to specify anomalous communication flows.
2.2. Flow-Based Analysis
A flow is defined as a set of packets which have the same values for the following three header fields.
• Protocol (TCP/UDP)
• Source/Destination address pair
• Source/Destination port pair A TCP flow ends with FIN or RST flags and UDP flows are terminated by time-out 
A flow is often used in anomaly detection [4,7,8]. A flow-based analysis method can analyze each bidirectional communication in detail and can specify each anomalous communication. However, in this analysis, buffers must be prepared for every flow. The number of buffers to be prepared lineally increases with as increase in the number of flows. Thus, this method possesses a risk of buffer overflow. Therefore, storage of buffers is a bottleneck in the flow-based analysis and vulnerability to DoS attacks.
2.3. A Conventional Combination Method
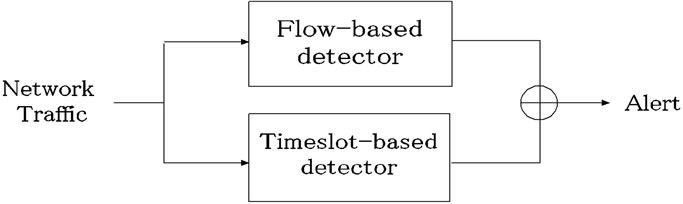
Our research group has proposed a combined system using the timeslot-based and the flow-based analyses in parallel [4]. Figure 1(a) shows the overview of the conventional system, which we term as a parallel system.
Network traffic is inputted to both the timeslot-based and the flow-based detectors, and is analyzed by each detector. A combination of timeslot-based and flow-based detectors can detect intrusions effectively by taking advantage of the merits possessed by both of these methods. Therefore, the combination system is highly accurate in anomaly detection and [4] shows the effectiveness of the parallel system through some experiments using DARPA data set [9].
However, it is still necessary to address the problem of large buffer storage in the flow-based analysis. For reducing the amount of data to be analyzed by flow-based analysis, packet sampling [10-12] and setting short timeouts [13] have been proposed. However, by using the former, it is difficult to observe flows which consist of only few packets, and thus there is a high chance of missing important packets during detection. Since novel worms tend to be few packets in order to spread as fast as possible [14], such worms are difficult to be sampled. In the latter case, since long traffic flows will be split up if its interval of arrival time of packets exceeds the flow timeout, the short timeouts causes increasing the number of flows and declining efficiency and accuracy [11]. As a result, we consider that these approaches suffer from lack of information for detecting anomalous events and exhibit low detection accuracy.
Since packet sampling and setting short timeout diminish data of each flow without any regards for evaluating anomaly, it may result in lack of information needed to detect anomalous flows. For avoiding lack of information, not data of each flow but the number of flows should be reduced with appropriate criteria.
3. A Multi-Stage Anomaly Detection System
In this section, we propose a multi-stage network anomaly detection system. It uses fewer amount of buffer, but yet detects intrusions with high accuracy.
3.1. Outline
Figure 1(b) shows the overview of the proposed multistage
 (a)
(a)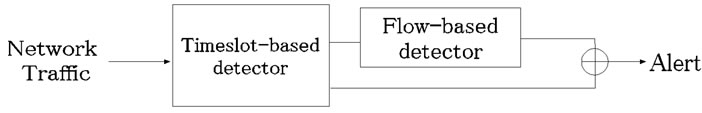 (b)
(b)
Figure 1. Overview of parallel system and multi-stage system.
system. The proposed system consists of timeslotbased detector in the first stage and flow-based detector in the second stage. The role of the first stage is to exclude flows that can be judged as obvious anomalous or obvious normal. For such flows, detailed analysis by the flow-based detector is not needed. By excluding such flows, the proposed method can achieve the both high efficiency and high accuracy in network anomaly detection.
Considering the role of the first stage, we utilize timeslotbased detector in it. In the timeslot-based detector, the anomaly level of a time slot basically depends on the number of anomalous flows. Therefore, if timeslots have extremely high or extremely low degree of anomaly, we can consider flows included in such timeslots as obvious anomalous or normal, respectively. Only flows included in the remaining timeslots need to be analyzed by the flow-based analysis. Therefore the proposed system can reduce the number of flows that need to be analyzed by the flow-based analysis.
The architecture of the proposed system is illustrated in Figure 2. Network traffic is input into both the timeslotbased detector and the dump module. The timeslot-based detector analyzes the network traffic for each timeslot. Based on the anomaly level of the timeslot, it classifies each slot into three levels which are anomalous, suspicious and normal. Normal slots are excluded from further analysis. For anomalous slots, this detector generates alerts to administrators to inform that anomalous traffic is detected. For suspicious slots, information needed to aggregate packets to assemble flows, which we term suspicious information, is sent to the dump module. This information includes start and end times of the suspicious slot, source/destination IP addresses and source/destination port numbers. The role of the dump module is to pick up packets based on the suspicious information, and to assemble them into suspicious flows. These flows are sent to the flow-based detector. The flow-based detector analyzes them and generates alarms if any anomaly is detected. As a result, it is not necessary to analyze flows in normal and anomalous slots. Therefore, the proposed system can reduce the number of flows that need to be stored in a buffer.
In Sections 3.2 and 3.3, we describe the timeslot-based detector and the flow-based detector respectively.
3.2. Timeslot-Based Detector
3.2.1. Outline
Figure 3 shows the slot classification carried out by the timeslot-based detector. Firstly, each slot is classified into either anomalous slot candidate or normal slot by a threshold ( ). Then the anomaly score of a slot exceeds the threshold (
 ), the slot is regarded as an anomalous slot candidate.
Next, the anomalous slot candidates are classified into anomalous slots or suspicious slots by another threshold ( ). When the anomaly score of an anomalous slot candidate exceeds the threshold (
 ), this slot is judged as an anomalous slot.
For anomalous slots, the timeslot-based detector outputs alerts. For suspicious slots, this detector generates suspicious information. For normal slots, this detector outputs nothing. In the end, only the suspicious slots whose anomaly scores in the range from to are sent to second stage for a detail analysis. It is effective to detect anomaly based on packet header and payload individually [4]. Therefore, the timeslot-based detector has two modules, header-based detection module and payloadbased detection module.
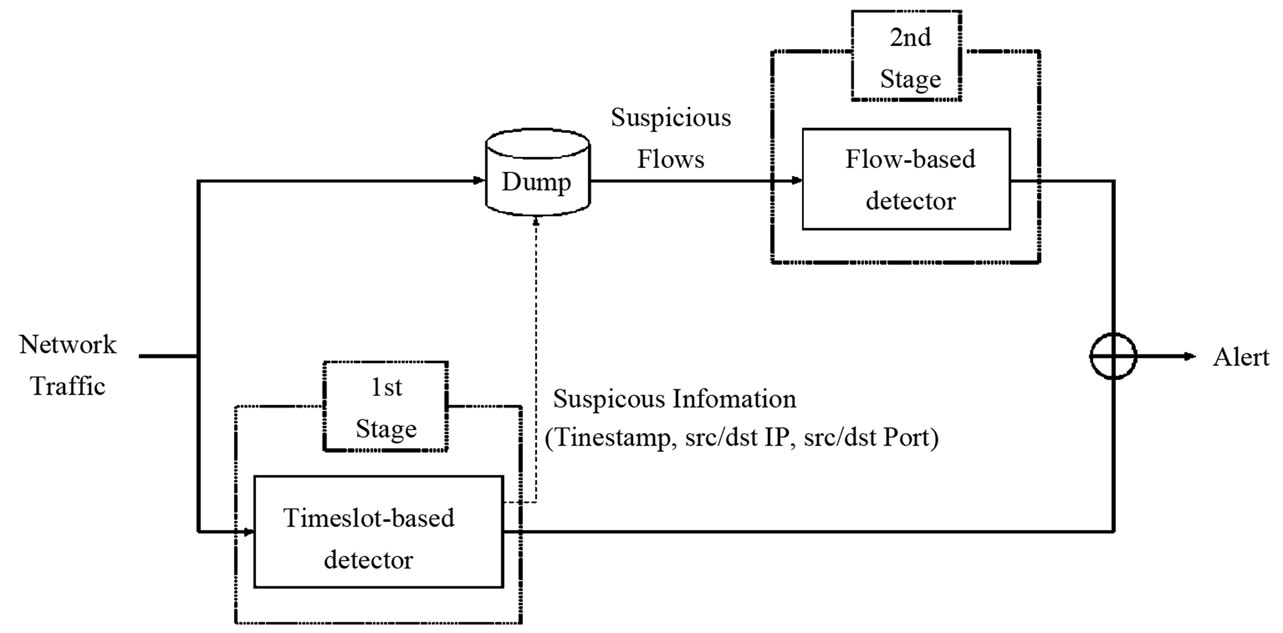
Figure 2. Detailed architecture of the proposed system.
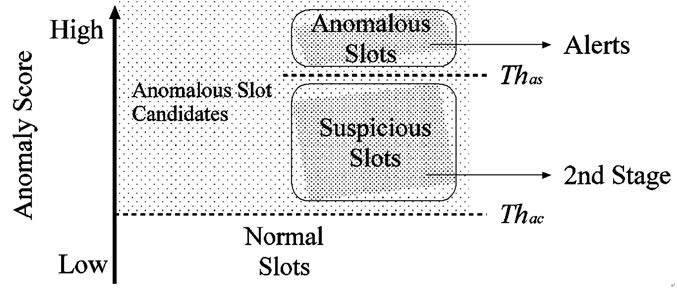
Figure 3. Slot classification using two thresholds in timeslotbased detector.
3.2.2. Header-Based Detection Module
The header-based detection module analyzes network traffic based on features mainly extracted from the header of each packet included in each timeslot. The features (37 types) extracted are as follows:
1) For all traffic.
a) Each number of packets of TCP/ UDP/ ICMP (3 types).
b) The number of TCP bytes.
c) The number of port varieties of TCP.
d) Each number of TCP flags (5 types).
e) The number of DNS packets.
f) The number of fragment packets.
g) The number of IP address varieties (each byte, 4 types).
2) For port #21, #22, #23, #25, #80 and #110.
a) Each number of TCP flags (3 types).
3) For port #80.
a) The maximum number of bytes between delimiter (space/line feed).
b) A ratio of the number of message headers per the number of request lines.
c) A ratio of the number of packets per the number of clients.
These features become elements of a feature vector. This detector calculates a projection distances from a feature vector to the first principal components using Principal Component Analysis (PCA) and defines the projection distance as the anomaly score of the flow from which the feature vector is extracted. Based on the anomaly score, slots are labeled as anomalous slots, suspicious slots, or normal slots.
3.2.3. Payload-Based Detection Module
The payload-based detection module analyzes network traffic by features extracted from payloads of a packet.
In the payload-based detection module, packet payloads are divided into 8-bit codes. Appearance and transition probabilities of each code are calculated using training data. Then, we assume that the code sequences in packet payloads of each port generate with Markov process. Hence, the appearance probability of a code sequence  in a packet payload is obtained from Equation (1)
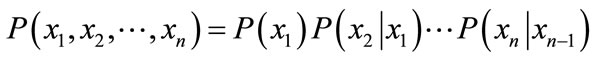 (1)
(1)
where ![]() is the length of a packet.
is the length of a packet.
Anomaly score  for each packet is defined as the measure of information of code sequences and are obtained from Equation (2) because anomalous code sequences occur few many times. The anomaly of a slot is defined as the maximum value of in that slot.
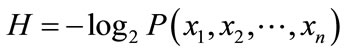 (2)
(2)
Based on , slots are labeled as anomalous slots, suspicious slots, or normal slots.
3.2.4. Output of Timeslot-Based Detector
Table 1 summarizes the final outputs of the timeslot-based detector. When any one of the header-based and the payload-based detection modules label a slot as an anomalous slot, the timeslot-based detector outputs an alert. If header-based or payload-based detection modules label a slot as a suspicious slot, suspicious information is generated and sent to the dump module. When one detector labels a slot as an anomalous slot and the other labels a slot as a suspicious slot, the timeslot-based detector outputs both of alert and suspicious information. When both header-based and payload-based detection modules label a slot as a normal slot, the timeslot-based detector outputs nothing.
3.3. Flow-Based Detector
3.3.1. Outline
The timeslot-based detector creates suspicious information when a slot is classified a suspicious slot. The flowbased detector analyzes suspicious flows which are assembled by the dump module using suspicious information. This detector classifies suspicious flows into anomalous flows or normal flows.
Similar to the timeslot-based detector, the flow-based detector consists of two analysis modules: header-based and payload-based detection modules. When any of the header-based and the payload-based detection modules classifies a flow as anomalous, the flow-based detector outputs an alert.
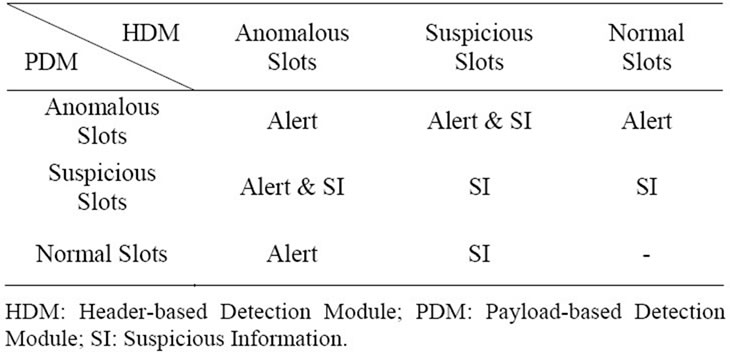
Table 1. Output of the timeslot-based detector.
3.3.2. Header-Based Detection Module
The header-based detection module detects anomalous flows using features extracted from packet headers of a flow. It analyzes the following features (TCP: 19 types, UDP: 7 tyes):
1) For both of TCP and UDP flows.
a) The number of packets.
b) Inverse of the number of flows which have same port number.
c) The number of fragment packets.
2) For TCP flows (only sending packets from clients).
a) Each number of TCP flags (8 types).
b) Each number of packets with only a TCP flag (8 types).
3) For UDP flows.
a) Each number of sending/receiving packets for clients (2 types).
b) Each number of sending/receiving packets for clients (2 types).
The projection distance from a feature vector to the first principle component is calculated by PCA using these features. The projection distances are then used as anomaly scores of flows.
If some plural flows which have same source/destination IP addresses are observed in a short period of time, this module regards them as related flows and treats them as one set. Because some attacks, such as scan, consist of plural flows from single IP address, assembling the related flows can promotes the efficiency of detection.
When a flow f is observed, flows which have the identical IP addresses with f and meet the conditions below are regarded as the related flows of f
 (3)
(3)
where  denotes a related flow,
  and
and  are the finish time of flow f and
 , respectively. A parameter
  is used to evaluate whether two flows f and
  are observed in a short period of time.
Denoting the anomaly score of  and
and  as
as  and
and , respectively, the anomaly score of the set of the related flows
  can be expressed as:
 (4)
(4)
where F denotes the set of the related flows and N is the maximum size of buffer to store the related flows for evaluating . Even if each flow of an intrusion has small anomaly score, we can detect such intrusion by evaluating
 . Moreover, if an alert for F is generated, this module does not generate more alerts for successive flows that have same source/destination IP addresses as F during
 . Thus, only one alert is generated for a single intrusion and we can avoid receiving redundant alerts.
3.3.3. Payload-Based Detection Module
For each TCP flow, a feature vector consists of 512 features which are the 256 codes from client to server and the 256 codes from server to client. For others, such as UDP flow, the feature vector consists of 256 features which are the 256 codes from client to server. Projection distances from the feature vector from the first principle component are calculated by PCA using these features. The flow-based detector defines the projection distances as anomaly scores of flows. This analysis is carried out for all TCP flows, port #20, #21, #23, #25 and #80 respectively.
4. Evaluation
4.1. Experimental Environment
We use the 1999 DARPA off-line IDS evaluation data set [9] to investigate the number of flows reduced by the timeslot-based detector and to evaluate of detection accuracy. The following information of intrusions is given in this data set.
• Intrusion instants.
• IP addresses and port numbers of intruders.
• IP addresses and port numbers of victims.
• Types of intrusions.
This data set consists of network traffic of 5 weeks. Week 1 and week 3 (10 days) traffic are attack-free while week 4 and week 5 (10 days) traffic include some intrusions. Data of week 1 and week 3 are used for training the detectors of the proposed system, and intrusions included in week 4 and week 5 are the detection targets. In week 4 and week 5, nearly 700,000 TCP and UDP flows are included.
Table 2 shows the values of parameters![]() ,
, ,
, and
and , which are same as the parallel system [4]. A payload-based detection module in timeslot-based detector targets port #21, #25 and #80 on which the payloadbased detection module is able to train effectively as the data set.
According to [15], and thresholds of flow-based detector are set such that the number of false positives does
Table 2. Values of parameters set in evaluation.
not exceed 10 for each day (100 in 10 days). Thresholds of detection module in the proposed system are set as shown in Table 3. The value of  is set as explained in the next subsection.
4.2. Flow Reduction Performance
By using suspicious flow ratio per all flows in week 4 and week 5 ( ), and the ratio of detectable intrusions in anomalous slot candidates per all intrusions (
 ), we evaluate flow reduction effect of the proposed system. A low value of
  is preferred as it implies that the number of flows which will be analyzed in the flow-based detection modules are reduced. High
  means that many intrusions included in the anomalous slots can be detected by the proposed method.
Figure 4 shows changes in  with respect to
  This graph indicates that the bottom right portion of the line shows a high performance. Figure 4 shows that
  is about 40 percent when
  is about 90 percent. That is to say, it is possible to detect 90 percent intrusions by analyzing merely 40 percent of the total flows. This indicates the proposed system can effectively reduce flows to be analyzed.
Note that remained 10 percent intrusions become false negatives in the proposed method. However, after investtigating these intrusions, we find that most of these intrusions cannot detect even by the flow-based detector. Since the behavior of these intrusions is almost same as normal communication, it is difficult to detect such intrusions by the already existed timeslot-based and flowbased detector. As a result, we conclude that there can be few additional false negatives caused by the proposed method. Therefore,  is adjusted so that
  becomes 90 percent in the next section.
4.3. Intrusion Detection Performance
In this section, the proposed system is evaluated in terms of detection accuracy. Table 4 indicates the number of detected intrusions, the total number of intrusion and detection rate for existing IDSs and the proposed system. As shown in Table 4, the proposed system has higher detection rate than other IDSs except NETAD.
The proposed method achieves higher detection rate than the parallel system because the number of false positives are reduced by the proposed method. When flows are generated by mistaken operation of a user (e.g., access to closed service), these flows have a tendency to be detected by the flow-based detector and cause false positives. In case that some flows are included in normal slots in the proposed method, however, the flow-based detector does not need to analyze and detect such flows. This results in reduction of false positives.
Table 3. A limitation number of false positives for each day set in evaluation for each detector.
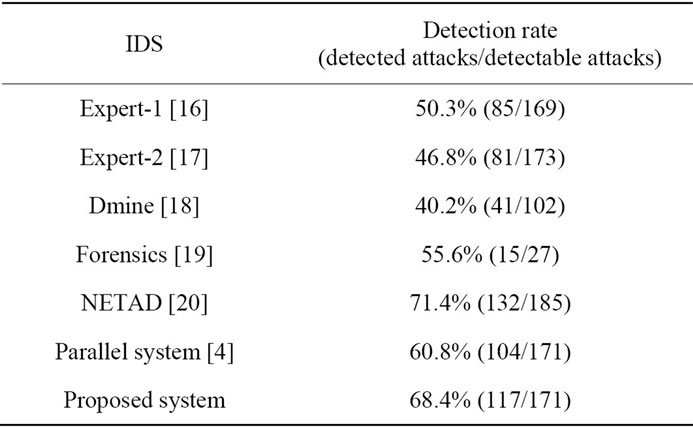
Table 4. A comparison with other IDSs.
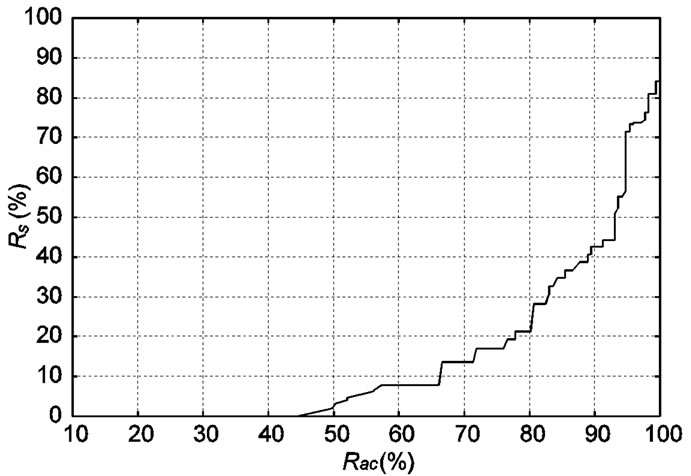
Figure 4. Changes in  with respect to
 .
.
NETAD indicates higher detection ratio than the proposed system. However, NETAD has some drawbacks in practical situations. It detects intrusions using the appearance number of IP addresses. This causes many false positives in networks which provide services to any users. Moreover, intruders can easily evade the NETAD’s detection because the IP addresses of intruders can be regarded as normal if they can access victims normally beforehand. In this regard, the proposed system can be applied to any networks because it does not use features such as IP addresses. Next, NETAD analyzes traffic using only the first few portion of payloads included in each packet. Therefore, NETAD is not able to detect intrusions which have anomalies the latter half of packet payloads. On the other hand, the proposed system analyzes all payloads, and can detect these intrusions. Consequently, the proposed system will work well in practical situations.
5. Conclusions and Future Works
In this paper, we proposed a multi-stage anomaly detection system which is combination of timeslot-based and flow-based detectors. To obtain high intrusion detection accuracy, a detection system should analyze each observed flow in detail. This flow-based analysis, however, needs high computational cost and large buffer to store flows. The computational cost and buffer size can be vulnerability for DoS attacks. To avoid this potential risk, the proposed system reduces the computational cost and buffer size by adopting timeslot-based detection modules, which can work with lower computational cost and smaller buffer size, at the stage of prior to flow-based detector. In the detection experiment, we demonstrated that the proposed system can reduce the number of flows which needs to be analyzed at the flow-based detection modules to 40 percent with high detection accuracy compared with existing intrusion detection systems. Thus, the proposed system can avoid the risk which arises from the computational cost and buffer size with high detection accuracy. But, some flows were classified as non attack flows at the first detection stage. This is a potential drawback of the proposed system and a future work.
REFERENCES
- M. Roesch, “Snort-Lightweight Intrusion Detection for Networks,” LISA’99 Proceedings of the 13th USENIX Conference on System Administration, USENIX Association, Berkeley, 7-12 November 1999.
- D. Anderson, T. F. Lunt, H. Javits, A. Tamaru and A. Baldes, “Detecting Unusual Program Behavior Using the Statistical Component of the Nextgeneration Intrusion Detection Expert System (NIDES),” Computer Science Laboratory SRI-CSL 95-06, May 1995.
- R. Sekar, M. Bendre, D. Dhurjati and P. Bollineni, “A Fast Automaton-Based Method for Detecting Anomalous Program Behaviors,” Proceedings of the 2001 IEEE Symposium on Security and Privacy, Oakland, 2001.
- Y. Sato, Y. Waizumi and Y. Nemoto, “Improving Accuracy of Network-Based Anomaly Detection Using Multiple Detection Modules,” Proceedings of IEICE Technical Report, NS2004-144, 2004, pp. 45-48.
- P. Barford, J. Kline, D. Plonka and A. Ron, “A Signal Analysis of Network Traffic Anomalies,” Proceedings of ACM SIGCOMM Internet Measurement Workshop (IMW) 2002, Marseille, November 2002, pp. 71-82. doi:10.1145/637201.637210
- T. Oikawa, Y. Waizumi, K. Ohta, N. Kato and Y. Nemoto, “Network Anomaly Detection Using Statistical Clustering Method,” Proceedings of IEICE Technical Report, NS- 2002-143, IN2002-87, CS2002-98, Oct, 2002 pp. 83-88.
- Y. Waizumi, D. Kudo, N.Kato and Y. Nemoto, “A New Network Anomaly Detection Technique Based on PerFlow and Per-Service Statistics,” Proceedings of International Conference on Computational Intelligence and Security, Xi’an, 15-19 December 2005, pp. 252-259.
- A. Lakhina, M. Crovella and C. Diot, “Characterization of Network-Wide Anomalies in Traffic Flows,” Proceedings of the ACM/SIGCOMM Internet Measurement Conference, Taormina, 25-27 October 2004, pp. 201-206.
- “DARPA Intrusion Detection Evaluation,” MIT Lincoln Labortory, Lincoln, 2011. http://www.ll.mit.edu/IST/ideval/index.html.
- Inmon Corporation, “Flow Accuracy and Billing,” 2011. http:// www.inmon.com/pdf/sFlowBillilng.pdf.
- N. Duffield, C. Lund and M. Thorup, “Properties and Prediction of Flow Statistics from Sampled Packet Streams,” Proceedings of ACM SIGCOMM Internet Measurement Workshop (IMW), Marseille, 6-8 November 2002. doi:10.1145/637201.637225
- N. Duffield, C. Lund and M. Thorup, “Flow Sampling under Hard Resource Constraints,” Proceedings of ACM SIGMETRICS, New York, 10-14 June 2004.
- “NeFlow,” 2011. http://www.cisco.com/warp/public/732/Tech/nmp/netflow/index.shtml.
- P. Akritidis, K. Anagnostakis and E. P. Markatos, “Efficient Content-Based Detection of Zero-Day Worms,” Proceedings of the International Conference on Communications (ICC 2005), Seoul, 16-20 May 2005.
- R. Lippmann, J. W. Haines, D. J. Fried, J. Korba and K. Das, “The 1999 DARPA Off-Line Intrusion Detection Evaluation,” Computer Networks, Vol. 34, No. 4, 2000, pp. 579-595. doi:10.1016/S1389-1286(00)00139-0
- P. Neumann and P. Porras, “Experience with EMERALD to DATE,” Proceedings of 1st USENIX Workshop on Intrusion Detection and Network Monitoring, Santa Clara, 9-12 April 1999, pp. 73-80.
- G. Vigna, S. T. Eckmann and R. A. Kemmerer, “The STAT Tool Suite,” Proceedings of the 2000 DARPA Information Survivability Conference and Exposition (DISCEX), Hilton Head, 25-27 January 2000.
- S. Jajodia, D. Barbara, B. Speegle and N. Wu, “Audit Data Analysis and Mining (ADAM),” 2000 http://www.isse.gmu.edu/dbarbara/adam.html
- M. Tyson, P. Berry, N. Willams, D. Moran and D. Blei, “DERBI: Diagnosis, Explanation and Recovery from computer Break-Ins,” 2000.
- M. Mahoney, “Network Traffic Anomaly Detection Based on Packet Bytes,” Proceedings of ACM-SAC, Melbourne, 9-12 March 2003, pp. 346-350.