Open Journal of Radiology
Vol.2 No.3(2012), Article ID:23310,4 pages DOI:10.4236/ojrad.2012.23013
Comparison of Perfusion Weighted Magnetic Resonance Imaging and Single Photon Emission Computed Tomography for Assessment of Cerebrovascular Reserve in Symptomatic Carotid Territory Stenosis
Department of Neurology, Southern General Hospital, University of Glasgow, Glasgow, UK
Email: s.mcsorley@doctors.org.uk
Received June 4, 2012; revised July 7, 2012; accepted July 17, 2012
Keywords: PW-MRI; SPECT; Carotid Stenosis; Cerebrovascular Reserve
ABSTRACT
Background: Perfusion Weighted Magnetic Resonance Imaging (PW-MRI) and HMPAO Single Photon Emission Computed Tomography (SPECT) are both cerebral perfusion measurement techniques. Imaging before and after acetazolamide administration can assess cerebrovascular reserve in symptomatic haemodynamic cerebrovascular disease. We compared SPECT and PW-MRI parameters in this patient group. Methods: We identified 10 patients with haemodynamically induced symptoms and intraor extra-cranial arterial stenoses with back-to-back acetazolamide challenge SPECT and PW-MRI, 4 of whom had resting studies. Regions of interest (ROIs) were applied to parameter maps using an ASPECTS template and perfusion parameters expressed relative to contralateral ROIs, giving 118 challenge and 48 resting ROIs. Results: SPECT relative cerebral blood flow (rCBF) correlated with PW-MRI time to peak (TTP) (r = −0.568), mean transit time (MTT) (r = −0.317), regional cerebral blood flow (rCBF) (r = 0.299) and cerebral blood volume (CBV) (r = 0.224). Bias between SPECT and PW-MRI rCBF was small (−0.018) with wide limits of agreement and a systematic measurement error. Preto post-acetazolamide PW-MRI rCBF change showed poor sensitivity and specificity for detecting change in SPECT rCBF. SPECT and PW-MRI rCBF had stronger correlation and smaller bias in unilateral stenosis than with bilateral stenosis. Conclusion: Systematic bias between techniques limits interchangeability in cerebrovascular reserve measurement in patients with cerebrovascular stenosis.
1. Introduction
Cerebral hypoperfusion may contribute to the pathogenesis of stroke or transient ischaemic attack in patients with occlusive cerebrovascular disease, particularly recognised in the carotid system, where characteristic patterns of both clinical and radiological deficit are recognised [1]. Compensatory responses to the reduced cerebral perfusion pressure distal to a vessel occlusion or severe stenosis include initial vasodilatation, then increased oxygen extraction fraction to maintain the cerebral metabolic rate for oxygen when maximal vasodilatation has occurred [2]. The effect of compensatory vasodilation can be detected by a reduction in cerebrovascular reserve (CVR)
[3,4] by measuring changes in brain perfusion in response to a vasodilatory stimulus such as the carbonic anhydrase inhibitor acetazolamide. Impaired CVR indicates higher risk of further stroke in patients with carotid occlusion [5-7].
Different brain perfusion imaging techniques have been used to assess CVR. These include Single Photon Emission Computed Tomography (SPECT), which uses an intravenous radioactive tracer, most commonly Technetium 99-hexamethylpropylene amine oxime (99mTcHMPAO), which diffuses across the blood brain barrier and fixes in the brain tissue proportionately to flow, [8] and perfusion weighted Magnetic Resonance Imaging (PW-MRI), most commonly using intravascular gadolinium contrast bolus [9,10]. SPECT can be used to measure relative cerebral blood flow (CBF), whereas PW-MRI can produce various parameters including CBF, cerebral blood volume (CBV), signal time to peak (TTP), and mean transit time of the contrast bolus (MTT) [11].
SPECT CVR measurement has been studied for some time and is generally considered to be the gold standard however PW-MRI has several advantages over SPECT. It does not expose patients to ionizing radiation and has a higher spatial resolution. Additionally, patients requiring CVR measurement usually also require other MRI studies.
Previous studies have investigated the relationship between relative CBF measured by SPECT and PW-MRI using intravascular gadolinium based contrast in normal subjects [12] and in acute ischaemic stroke [13] finding a strong relationship between the two techniques. Previous comparison of cerebrovascular reserve assessment using PW-MRI and SPECT in patients with unilateral carotid stenosis has shown good correlation [14]. A recent study found a strong correlation between arterial spin labelling (ASL) perfusion MRI and PET for both quantitative and relative CBF measurement in patients with unilateral symptomatic carotid stenosis, but found that ASL MRI systematically overestimated CBF when compared to H215O PET [15].
This study attempted to compare relative haemodynamic parameters from PW-MRI with relative CBF measured by SPECT during acetazolamide challenge and at rest in a group of patients with both unilateral and bilateral symptomatic carotid territory stenosis.
2. Methods and Materials
2.1. Patients
We retrospectively analysed data from patients undergoing brain perfusion imaging with acetazolamide challenge for assessment of possible haemodynamic symptoms using both 99Tc-HMPAO SPECT and PW-MRI on the same day. The investigations were for clinical purposes from 2002 to 2006. All patients gave informed consent prior to imaging.
2.2. PW-MRI Protocol
PW-MRI studies were obtained using a GE Signa 1.5 T NVi scanner (GE Medical Systems, Slough, UK), with an 8 channel head coil. Gradient echo, echo planar imaging with echo time 60 ms, repetition time 2000 ms, square field of view 24 × 24 cm, matrix 128 × 128 and transaxial resolution 2 mm was used for bolus tracking. Slice thickness and number varied between scans, 10 of the 14 scans having 14 slices of thickness 8 mm, the others varying between 14 and 18 slices and 6.5 to 9 mm thickness. Bolus injection of gadolinium based contrast was administered 5 mL/s, concentration 0.1 mmol/kg through intravenous cannula using Spectris Solaris MR compatible pump injector (MedRad, Indianola, PA, USA) and was followed by a saline flush.
2.3. SPECT Protocol
500 MBq of 99mTc-HMPAO (CERETECTM, GE Healthcare, UK), was administered intravenously 30 minutes prior to scanning using a NeuroFocus Multidetector SPECT System (NeuroPhysics Corporation, Shirley, MA, USA). 25 axial slices with 6 mm spacing, each taking 2 minutes, were acquired. Total scan time was 50 minutes with transaxial image resolution 7.8 mm.
2.4. Acetazolamide Challenge Protocol
In all cases PW-MRI scanning was carried out before SPECT on the same day. 1 g intravenous acetazolamide (Diamox®), was administered 20 minutes before PWMRI scanning. 99mTc-HMPAO was administered immediately prior to gadolinium to ensure similar haemodynamics in both scans. Resting state PW-MRI and SPECT were obtained on a separate visit only if postacetazolamide imaging had shown evidence of regional hypoperfusion. This was identified by visual inspection of perfusion maps at the time of investigation, hypoperfusion in either modality triggered recall for non-challenge studies.
2.5. Region of Interest Analysis
Unique identifiers were removed from scans prior to analysis using specific software (NeuroFocus, beta version 3.37, NeuroLogica Corporation, Danvers, MA, USA and DicomWorks, version 1.3.5, Phillipe Peuch and Loic Boussel, Lyon, France) and reviewed in random order based on a computer-generated randomization schedule. Two-dimensional Regions of Interest (ROIs) were placed according to a modification of the Alberta Stroke Programme Early CT Score (ASPECTS) template, a tool for structured review of CT in acute stroke that defines ten brain regions (6 cortical middle cerebral artery territory regions, insula, lentiform nucleus, caudate head and internal capsule) at two anatomical levels, the basal ganglia and the upper part of the lateral ventricles [16]. Bilateral, elliptical ROIs included all cortical ASPECTS regions with the addition of ROIs in anterior and posterior cerebral arterial territories. The subcortical ROIs were included with the exception of the internal capsule and the addition of thalamic ROIs (Figure 1). SPECT CBF maps were manually registered with PW-MRI rCBF maps. ROIs were drawn onto SPECT CBF maps using SPECT analysis software (NeuroFocus, beta version 3.37, NeuroLogica Corporation, Danvers, MA, USA). PW-MRI analysis was carried out using a commercially available perfusion MRI analysis software package (Stroketool, version 2.2, Digital Image Solutions, Dusseldorf, Germany) that uses standard Singular Value Decomposition [17,18] to calculate quantitative perfusion parameters
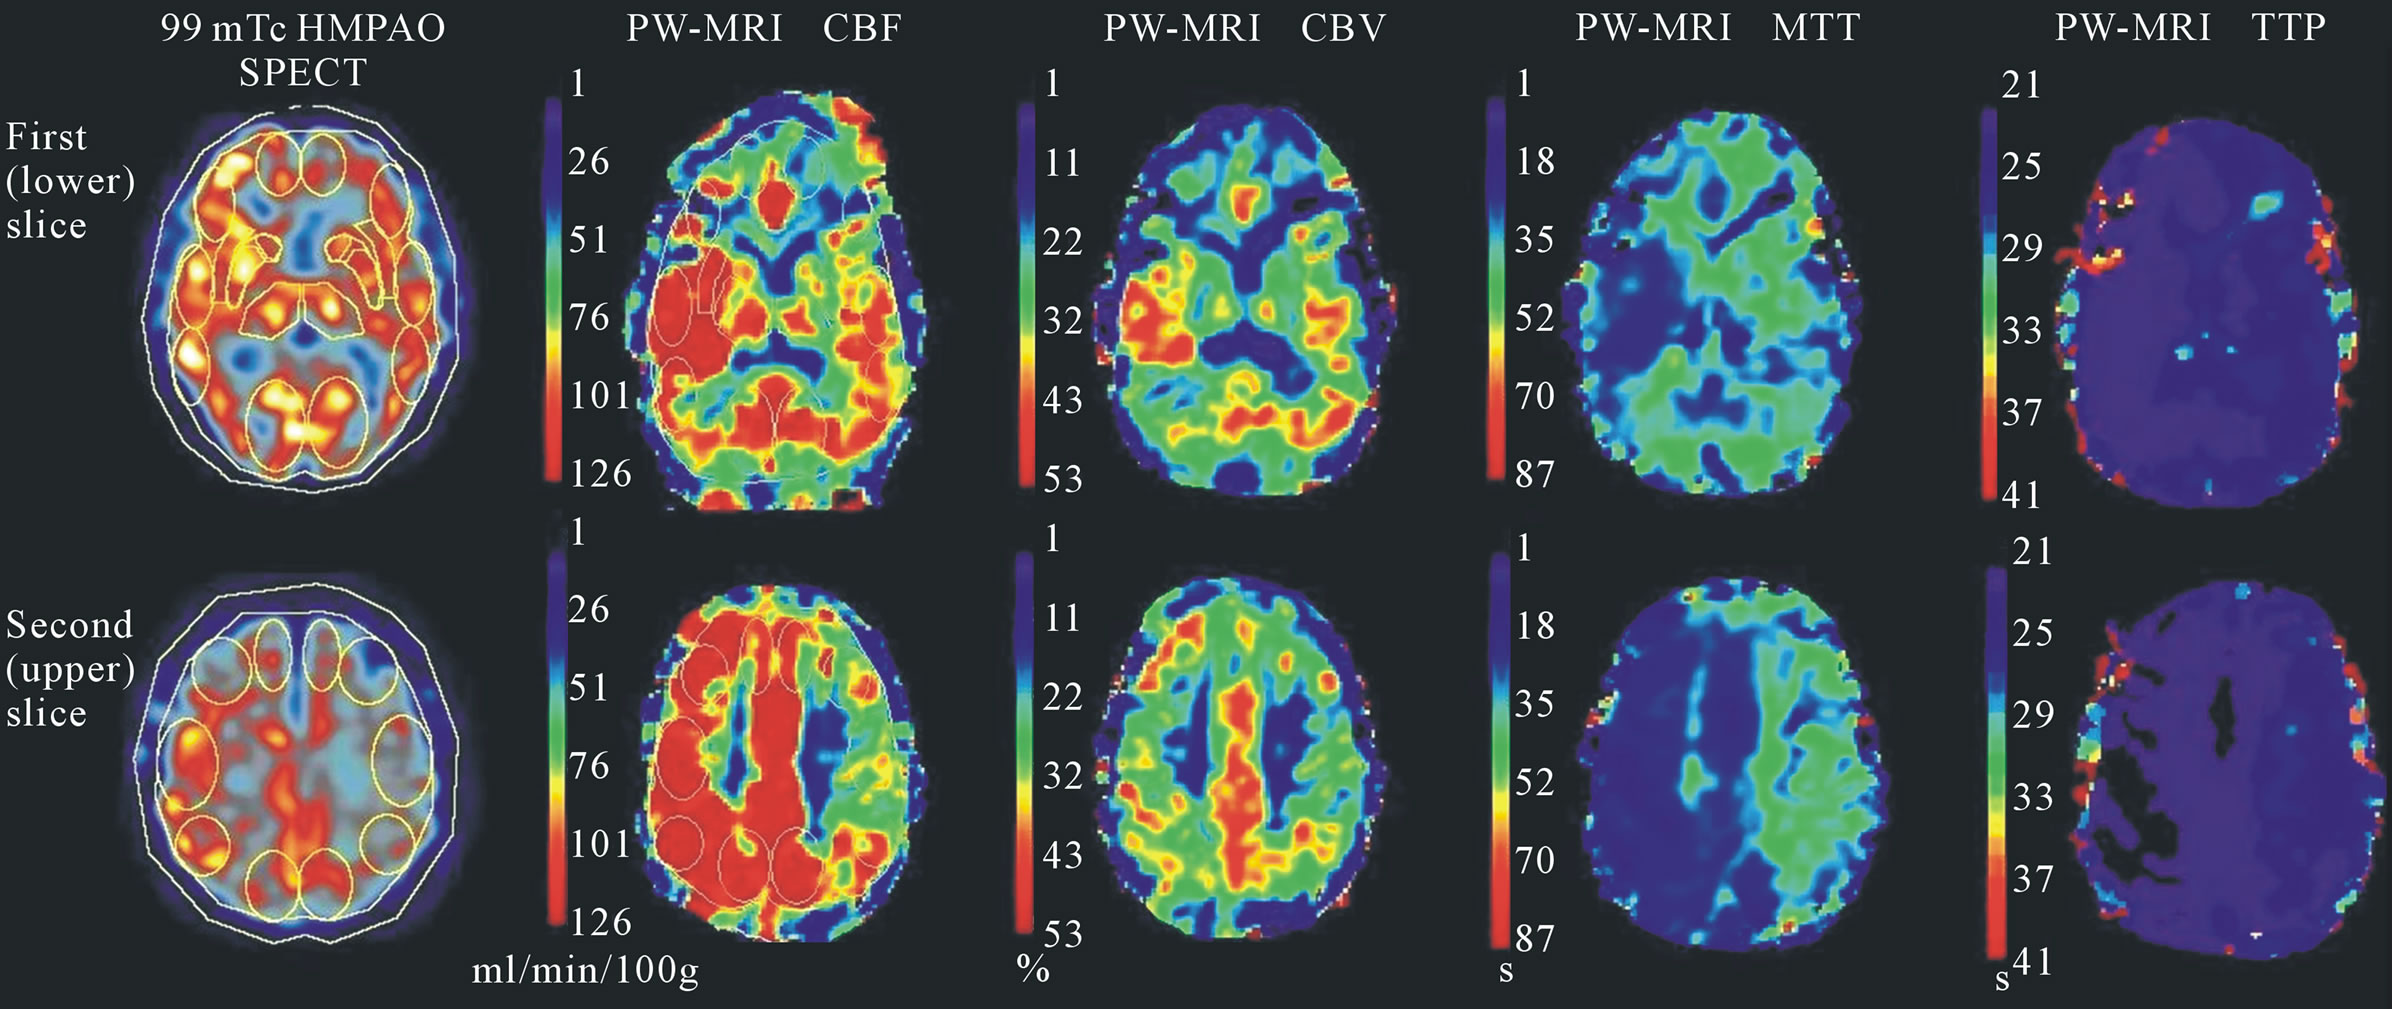
Figure 1. SPECT and PW-MRI parameter maps and modified ASPECTS regions of interest. Parameter maps of SPECT CBF and PW-MRI CBF, CBV, MTT and TTP derived for patient 3 are shown. This patient had left internal carotid artery stenosis. A left sided perfusion deficit is visible as reduced CBF and CBV and increased MTT and TTP in the left hemisphere compared to the right. The cortical and subcortical ROIs modified from ASPECTS are visible on the SPECT and PW-MRI CBF maps.
value after deconvolution of a manually selected Arterial Input Function (AIF). In all cases, pixels within the middle or posterior cerebral arteries were chosen as AIFs. Relative CBF, CBV and MTT were derived from the ratio of the quantitative parameter of the less well perfused hemisphere with that of the contralateral ROI. The selection of the hemisphere which represented the hypoperfused side was based on the CBF value and not on patient’s symptoms. TTP delay was calculated by subtracting ROI values of the better perfused hemisphere from the contralateral hemisphere. This gave N of 166 relative parameter values for all scans, 118 challenge state and 48 resting state.
2.6. Statistical Analysis
Statistical analysis was carried out using Minitab Statistical Software (version 14.0, Minitab Inc. PA, USA). SPECT and PW-MRI relative CBF agreement was assessed by calculating mean and difference for each ROI and from this, bias and 95% limits of agreement. Spearman’s rank correlation coefficient was calculated to assess the relationship between SPECT relative CBF and each PW-MRI parameter. Polynomial regression was applied to data from the 4 patients with both challenge and resting scans to assess the relationship between a region’s perfusion and cerebrovascular reserve. The accuracy of challenge to resting state change in PW-MRI CBF and TTP to detect defined change in SPECT CBF was measured by calculating sensitivity and specificity. The difference in preto post-acetazolamide CBF change due to unilateral or bilateral stenosis was ascertained using a Mann-Whitney test of the CBF difference of each. P values of less than 0.05 were considered to be statistically significant.
3. Results
Data from 10 patients (6 men, 4 women), aged between 40 and 66 years, mean 53 ± 9 years (mean ± standard deviation) were available for analysis. All ten had both SPECT and PW-MRI on the same day, following a single dose of acetazolamide, and four (patients 3, 4, 6 and 8) additionally underwent resting state SPECT and PWMRI. Patient 5 had abnormal challenge studies but on recall only underwent resting SPECT. The 5 remaining patients had an acceptable cerebrovascular reserve and were not recalled for resting studies.
All patients had symptomatic intraor extra-cranial carotid territory stenosis, 5 bilateral and 5 unilateral. None had detectable posterior circulation stenosis. Some had previous infarcts, however none was symptomatic at the time of imaging. Patient 5 was found to have a congenitally absent right internal carotid artery. Detection of vessel occlusion or stenosis was carried out by CT or MR angiography.
Bias between SPECT and PW-MRI relative CBF was small, –0.0183 for challenge and –0.0189 for resting state; however limits of agreement were wide; –0.391 to 0.355 and –0.399 to 0.361 for challenge and resting studies respectively.
Bland-Altman charts [19] of mean SPECT and PWMRI rCBF plotted against the difference in CBF for each ROI in both challenge and resting studies (Figure 2)

Figure 2. Bland-Altman plots of SPECT and PW-MRI relative CBF. Plotting difference between SPECT and PW-MRI CBF against mean for each ROI shows a systematic bias in relative CBF measurement by the two techniques pre- (b) and post-acetazolamide (a). At low relative CBF values (i.e. significant perfusion deficit), PW-MRI overestimates the perfusion deficit compared to SPECT whereas when relative CBF nears 1.0 it underestimates the perfusion deficit.
show a systematic difference in CBF measurement between the two techniques. At low rCBF values (i.e. significant relative perfusion deficit), PW-MRI estimated the perfusion deficit to be greater when compared to SPECT, whereas when rCBF ratio neared 1.0 PW-MRI estimated the perfusion deficit to be lower than for SPECT.
Spearman’s rank correlation coefficients for challenge state SPECT CBF and each PW-MRI parameter showed weak correlations (Figure 3). PW-MRI CBF and CBV each had a weak positive correlation with SPECT CBF, r = 0.299 and r = 0.224 respectively. MTT had a weak inverse relationship with SPECT CBF, r = –0.196. TTP delay showed a stronger inverse relationship with r = –0.568.
Quadratic regression of both challenge SPECT and PWMRI CBF with the preto post-acetazolamide change in each (Figure 4) shows that each technique measures this change differently depending on the perfusion of the region. SPECT measured the greatest preto post-acetazolamide CBF change in those regions with the lowest CBF on challenge (R2 = 51.7%, p = 0.015), whereas PW-MRI measured greatest change in regions with challenged rCBF ratio of just less than 1 (R2 = 45.5%, p = 0.010).
Sensitivity and specificity of preto post-acetazolamide PW-MRI CBF change to detect defined SPECT CBF change was low. Receiver Operating Characteristic curves (Figure 5) show optimal detection of 5% SPECT CBF change by a 10% PW-MRI CBF change (sensitivity = 0.69, specificity = 0.48), and a 1s change in TTP delay (sensitivity = 0.69, specificity = 0.77). 10% SPECT CBF change is optimally detected by 15% PW-MRI CBF change (sensitivity = 0.67, specificity = 0.66) and a 1s change in TTP delay (sensitivity = 0.83, specificity = 0.68).
Dividing regions into those from individuals with unilateral or bilateral stenosis shows that the individual’s pathology affects perfusion measurement by the two techniques. Correlation between challenge SPECT CBF and each PW-MRI parameter is stronger in regions from those with unilateral disease (Figure 3), with the exception of MTT. In particular, there was a strong inverse relationship between SPECT CBF and TTP delay (r = –0.733). Regions from those with unilateral stenosis had a 4% (95% confidence interval = 1% to 8%, p = 0.01) greater preto post-acetazolamide SPECT CBF change than regions from those with bilateral stenosis (Figure 6). The same analysis for PW-MRI CBF shows a trend of unilateral regions changing 5% more than bilateral regions (95% confidence interval = –2% to 13%, p = 0.1).
4. Discussion
Both SPECT and PW-MRI can be used to measure haemodynamic parameters and cerebrovascular reserve, providing useful clinical information about symptomatic cerebrovascular stenosis [20]. PW-MRI has the potential advantage that it does not expose patients to ionising radiation, and so could be more readily repeated, but has limitations that include exclusion of patients with metallic implants including cardiac pacemakers, or claustrophobia, and gadolinium contrast agents are contraindicated in patients with renal failure.
In this study we elected to calculate relative perfusion parameters from the quantitative values provided by the software used. Whereas SPECT calculates only relative CBF, PW-MRI can derive several perfusion parameters; CBF, CBV, TTP and MTT. Methods that have been proposed to calculate quantitative CBF using perfusion MRI each require several assumptions that may not be

Figure 3. Scatterplots of each relative PW-MRI parameter against SPECT relative CBF. ROIs from individuals with bilateral stenosis are represented by solid circles, unilateral stenosis by open circles. There is a weak correlation between SPECT CBF and PW-MRI CBF ((a), r = 0.299) and CBV ((b), r = 0.224). The strongest correlation is the inverse relationship of SPECT CBF and TTP delay ((d), r = −0.568). In general ROIs of unilateral stenosis have a stronger correlation than those of bilateral stenosis, particularly with TTP delay (unilateral r = −0.733, bilateral r = −0.352).

Figure 4. Effect of degree of perfusion deficit on preto post-acetazolamide CBF change. Plotting preto post-acetazolamide CBF change against challenge CBF shows a difference in the effect of the degree of perfusion deficit on the CBF change measured by each technique. As relative CBF falls, SPECT (a) measures increasing CBF change (R-Sq = 51.7%, p = 0.015), whereas the greatest change in CBF is measured at challenge CBF values of just below 1 (R-Sq = 45.5%, p = 0.010), by PW-MRI (b).
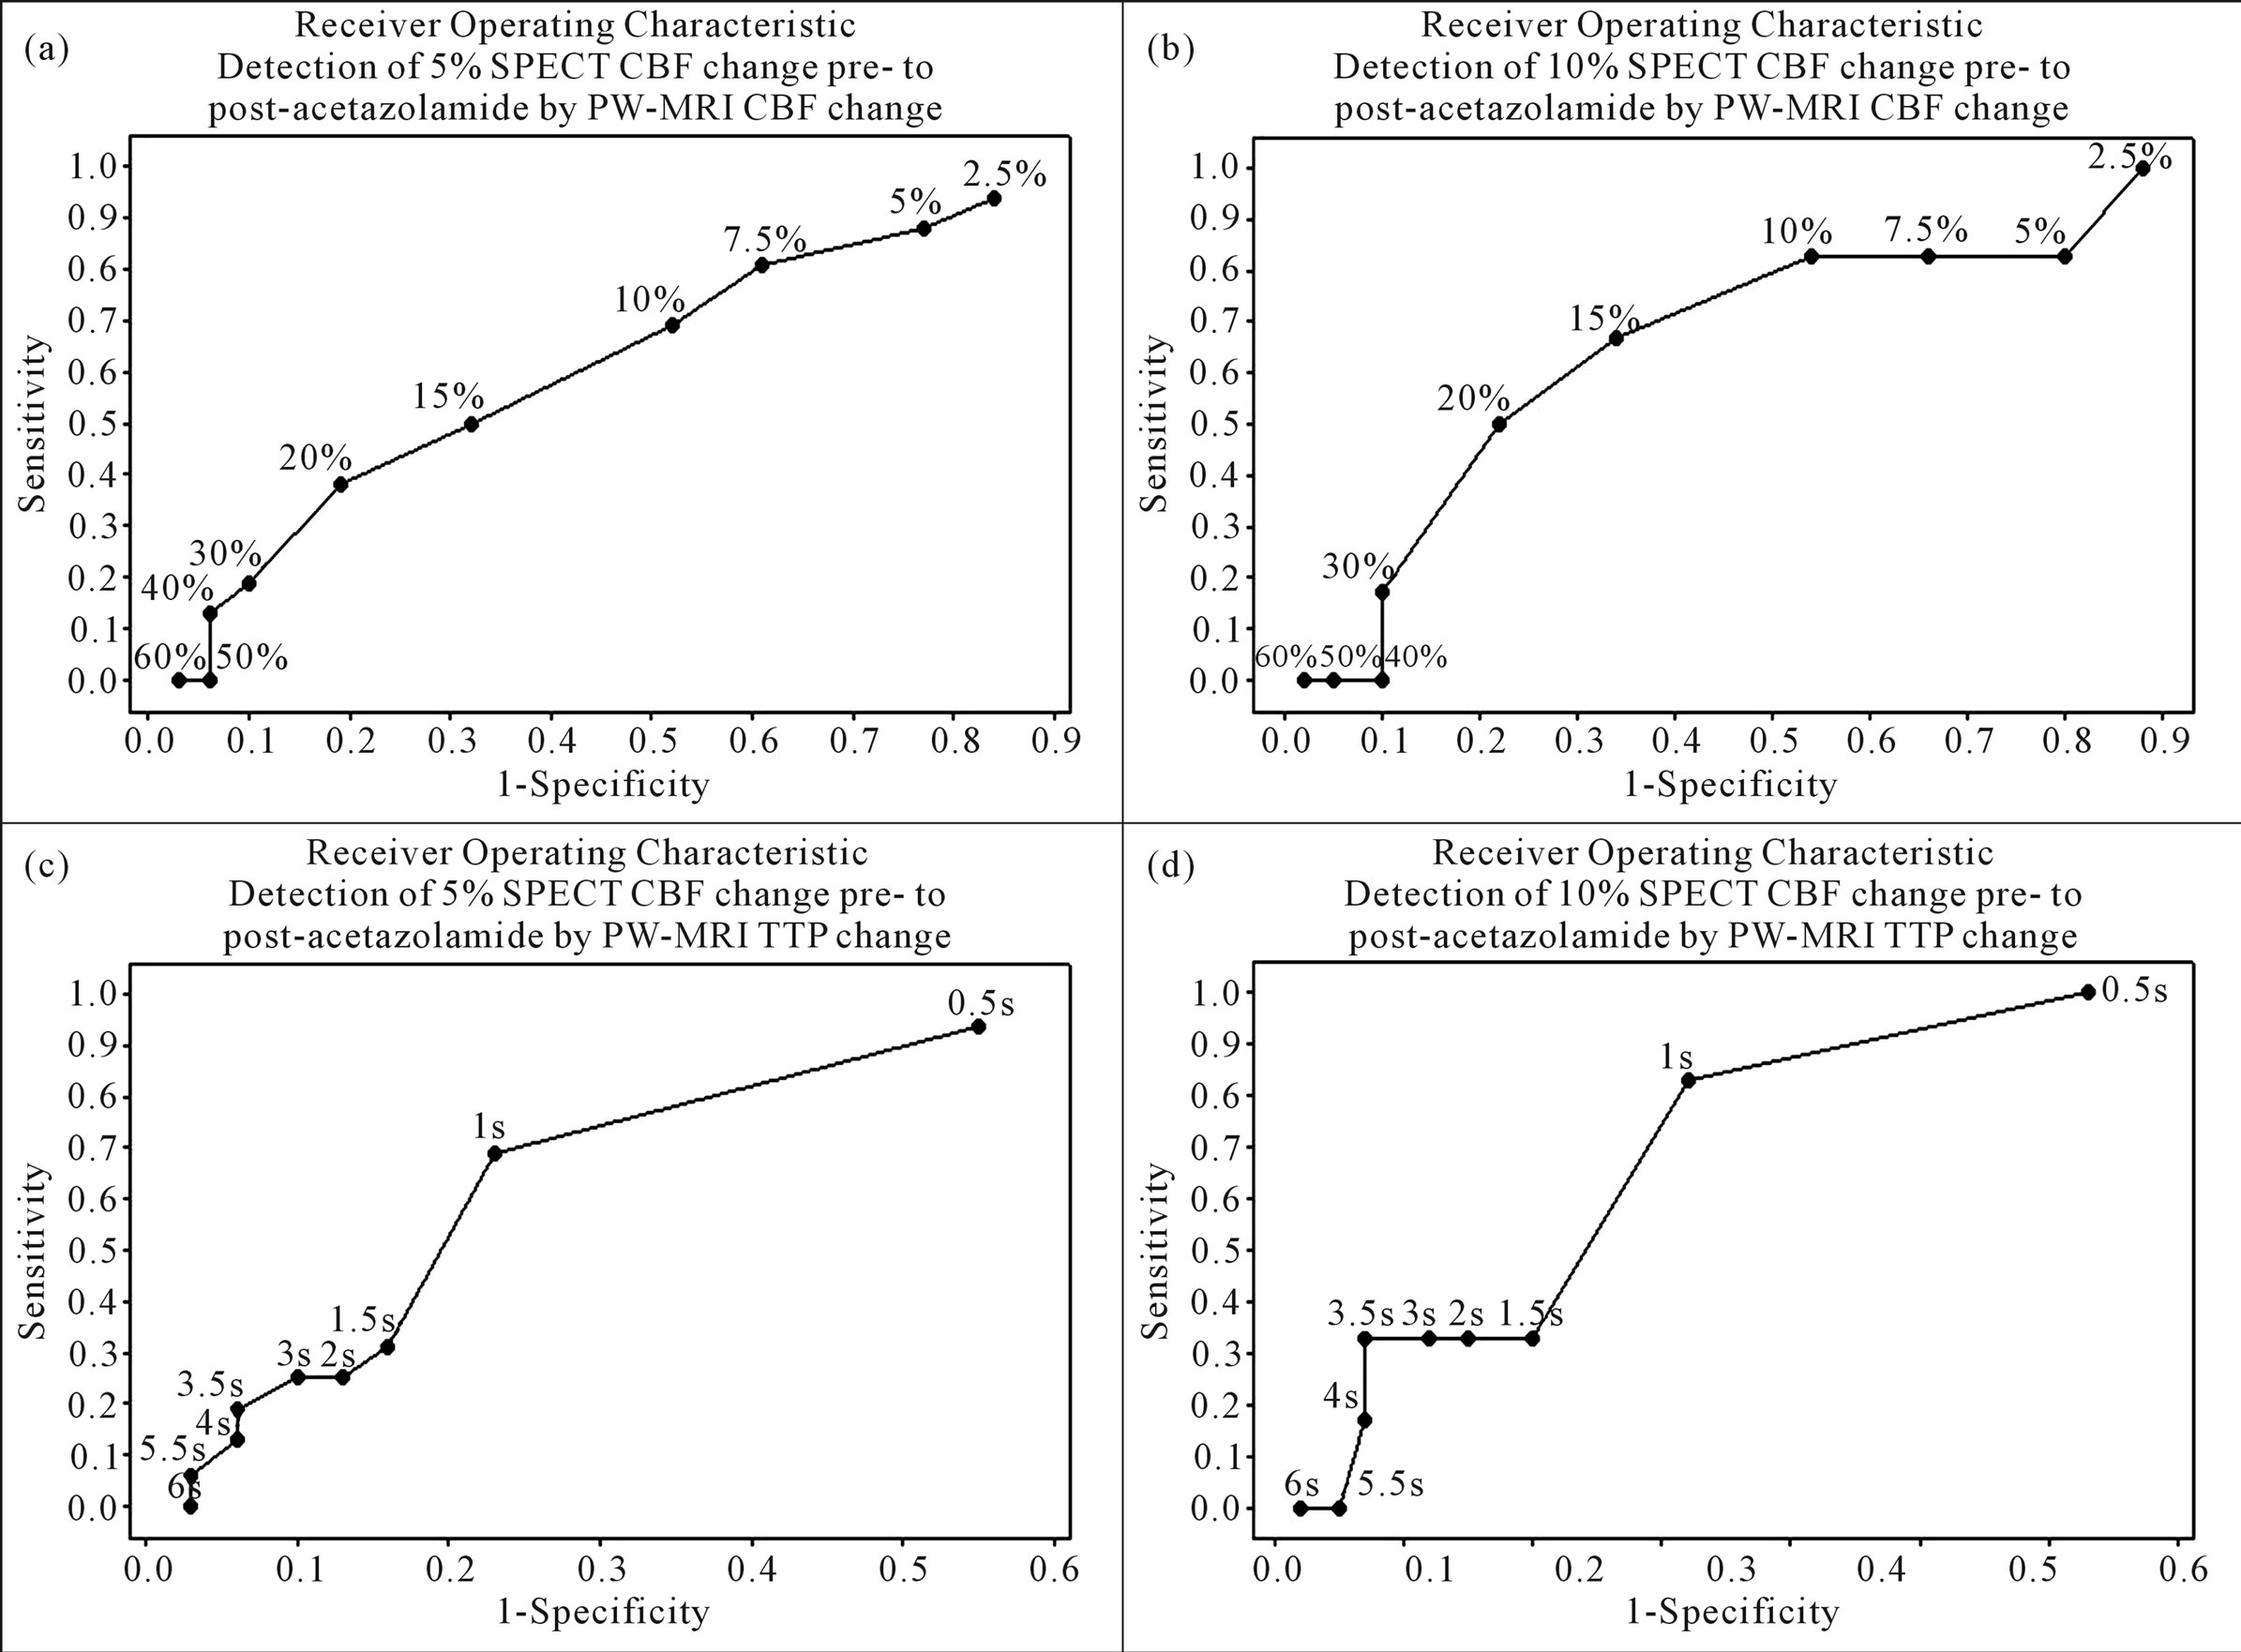
Figure 5. Receiver operating characteristic curves showing accuracy of preto post-acetazolamide PW-MRI CBF and TTP change to detect defined SPECT CBF change. These show low sensitivity and specificity for detecting 5% preto post-acetazolamide SPECT CBF change (a) by both PW-MRI CBF (sensitivity = 0.69, specificity = 0.48 at 10% change) and TTP delay change (sensitivity = 0.69, specificity = 0.77 at 1s change) and for detecting (b) a 10% SPECT CBF change (sensitivity = 0.67, specificity = 0.66 at 15 % change and sensitivity = 0.83, specificity = 0.68 at 1s change respectively).
met, particularly in patients with steno-occlusive arterial disease. Standard Singular Value Decomposition (SVD) method with dynamic contrast susceptibility MRI requires selection of an AIF within a main artery supplying the region contralateral to that being studied. Error in AIF selection (e.g. selection of a non-arterial pixel) or reduced arterial flow due to vascular disease can cause error in the calculated value [9,21]. Additional mathematical corrections and calibration such as the use of block-circulant SVD may address such issues at best in part, but scan and post-processing time increase [22,23]. Arterial Spin Labelling (ASL) offers an alternative to gadolinium bolus-tracking perfusion by using blood as an endogenous tracer to estimate absolute CBF, but small motion artifacts and hardware issues cause significant inaccuracies despite attempts to reduce these [24].
This study aimed to compare relative SPECT CBF and relative PW-MRI parameters in a group of patients with carotid territory stenosis clinically suspected of having haemodynamic symptoms using resting and acetazolamide challenge studies. Previous studies comparing the techniques have found reasonably strong correlation. Ernst et al found a linear relationship (r = 0.69) between relative CBF, with each ROI compared to the CBF of the whole slice, calculated from PW-MRI and SPECT in normal subjects [12]. Kikuchi et al. finding similarly (r = 0.648) when calculating quantitative CBF from both PWMRI and 133Xe-SPECT using an arterial input function in individuals with occlusive carotid disease [25]. We found a weaker correlation between relative SPECT CBF and relative PW-MRI parameters (Figure 3) with small bias in measurement of relative CBF by the two techniques but wide limits of agreement.
The systematic bias in PW-MRI CBF estimation compared to SPECT shown in Figure 2 may be caused by differences in the two techniques in their method of obtaining haemodynamic parameters. SPECT uses a lipophilic radioactive tracer which crosses the blood brain

Figure 6. Effect of unilateral or bilateral stenosis on preto post-acetazolamide CBF change. Scatterplots with fitted lines show that for both SPECT (a), and PW-MRI (b), CBF of regions from those with unilateral stenosis (open circles, dashed line), shows greater preto post-acetazolamide change than those from bilateral stenosis (solid circles and line). This is confirmed by the boxplot for SPECT CBF change (c) which shows unilateral stenosis CBF change 4.20% greater than that of bilateral stenosis (95% confidence interval = 0.96 to 7.95%, p = 0.014), whereas PW-MRI CBF (d) shows increased change of 5.51% (95% confidence interval = −1.89 to 12.55%, p = 0.143), as trend.
barrier and fixes in the brain parenchyma proportionately to flow. Gadolinium contrast remains intravascular and the T2-weighted signal change as it passes through the vasculature is used to derive PW-MRI parameters. This means that SPECT gives a good estimate of CBF at the level of capillaries [26] whereas PW-MRI tends to be influenced by large vessels. [9] The systematic bias found is reflected in the poor sensitivity and specificity of cerebrovascular reserve measured by PW-MRI to detect defined cerebrovascular reserve measured by SPECT (Figure 5).
This study also found that relative SPECT and PWMRI measure preto post-acetazolamide CBF change differently depending on the perfusion state of the region (Figure 4). The greatest change in challenge SPECT CBF occurs in the poorest perfused ROIs whereas the greatest difference in PW-MRI CBF occurs in those ROIs with relative CBF ratios just below 1.0.
Aside from the techniques themselves, there are a number of other factors that may have introduced error. All scans used in this retrospective study were obtained for clinical purposes meaning there is slight variation in slice width and number. The ASPECTS system, although not designed for perfusion imaging, provided a set of anatomically based ROIs. This makes the ROIs reproducible however they are small in size, increasing the chance that partial volume effect could produce error in the mean parameter value of the ROI. Due to software limitations ROIs were 2D rather than 3D which would have provided a more accurate measure of any given region’s perfusion, especially in the lower special resolution SPECT maps. We were unable to automatically coregister the SPECT and PW-MRI scans but did manually register the SPECT images as closely as possible to the MR plane. This introduces potential error in the locations of ROIs in three dimensional space.
This study also found a difference in correlation between relative SPECT CBF and PW-MRI parameters due to the pathology present. Ma et al had previously shown good correlation between SPECT and PW-MRI in measurement of cerebrovascular reserve in patients with unilateral carotid occlusion [14]. This study shows stronger correlation between SPECT and PW-MRI relative CBF, CBV and TTP delay in those with unilateral stenosis than those with bilateral stenosis (Figure 3). Bias between SPECT and PW-MRI CBF measurements is lower in the patients with unilateral disease than those with bilateral disease although the limits of agreement are wider. This suggests that the presence and severity of cerebrovascular disease may introduce error into measurements of relative parameters.
Weak correlation, systematic CBF measurement error and differences in cerebrovascular reserve measurement between relative SPECT CBF and relative PW-MRI parameters suggest limited interchangeability. Although both techniques can measure haemodynamics and cerebrovascular reserve we cannot accurately estimate the value we would obtain from one technique using a measurement from the other. Our study also suggests less agreement between techniques in patients with bilateral carotid stenosis when compared to those with unilateral disease. Caution may be required when interpreting cerebrovascular reserve as measured by SPECT and PWMRI in the former group of patients.
5. Acknowledgements
Funded by the Association of British Neurologists’ Intercalated Degree Bursary.
REFERENCES
- C. J. Klijn and L. J. Kappelle, “Haemodynamic Stroke: Clinical Features, Prognosis and Management,” The Lancet Neurology, Vol. 9, No. 10, 2010, pp. 1008-1017. doi:10.1016/S1474-4422(10)70185-X
- E. Nemoto, H. Yonas, H. Kuwabara, et al., “Identification of Haemodynamic Compromise by Cerebrovascular Reserve and Oxygen Extraction Fraction in Occlusive Vascular Disease,” Journal of Cerebral Blood Flow & Metabolism, Vol. 24, 2004, pp. 1081-1089. doi:10.1097/01.WCB.0000125887.48838.37
- F. J. Guckel, G. Brix, P. Schmiedek, et al., “Cerebrovascular Reserve Capacity in Patients with Occlusive Cerebrovascular Disease: Assessment with Dynamic Susceptibility Contrast-Enhanced MR Imaging and the Acetazolamide Stimulation Test,” Radiology, Vol. 201, No. 2, 1996, pp. 405-412.
- C. P. Derdeyn, T. O. Videen, K. D. Yundt, et al., “Variability of Cerebral Blood Volume and Oxygen Extraction: Stages of Cerebral Haemodynamic Impairment Revisited,” Brain, Vol. 125, No. 3, 2002, pp. 595-607. doi:10.1093/brain/awf047
- K. Ogasawara, A. Ogawa and T. Yoshimoto, “Cerebrovascular Reactivity to Acetazolamide and Outcome in Patients with Symptomatic Internal Carotid or Middle Cerebral Artery Ccclusion: A Xenon-133 Single-Photon Emission Computed Tomography Study,” Stroke, Vol. 33, 2002, pp. 1857-1862. doi:10.1161/01.STR.0000019511.81583.A8
- T. Hiranao, K. Minematsu, Y. Hasegawa, et al., “Acetazolamide Reactivity on 123I-IMP Single Photon Emission Computed Tomography in Patients with Major Cerebral Artery Occlusive Disease: Correlation with Positron Emission Tomography Parameters,” Journal of Cerebral Blood Flow & Metabolism, Vol. 14, 1994, pp. 763-770. doi:10.1038/jcbfm.1994.97
- J. Knop, A. Thie, C. Fuchs, et al., “99mTc-HMPAOSPECT with Acetazolamide Challenge to Detect Hemodynamic Compromise in Occlusive Cerebrovascular Disease,” Stroke, Vol. 23, 1992, pp. 1733-1742. doi:10.1161/01.STR.23.12.1733
- J. C. Masdeu, C. M. Brass, B. C. Holman, et al., “Brain Single-Photon Emission Computed Tomography,” Neurology, Vol. 44, No. 10, 1994, pp. 1970-1977. doi:10.1212/WNL.44.10.1970
- F. Calamante, D. Thomas, G. Pell, et al., “Measuring Cerebral Blood Flow Using Magnetic Resonance Imaging Techniques,” Journal of Cerebral Blood Flow & Metabolism, Vol. 19, 1999, pp. 701-735. doi:10.1097/00004647-199907000-00001
- J. R. Petrella and J. M. Provenzale, “MR Perfusion Imaging of the Brain: Techniques and Applications,” American Journal of Roentgenology, Vol. 175, 2000, pp. 207-219.
- M. Wintermark, M. Sesay, E. Barbier, et al., “Comparative Overview of Brain Perfusion Imaging Techniques,” Stroke, Vol. 36, 2005, pp. e83-e99. doi:10.1161/01.STR.0000177884.72657.8b
- T. Ernst, L. Chang, L. Itti, et al., “Correlation of Regional Cerebral Blood Flow from Perfusion MRI and SPECT in Normal Subjects,” Magnetic Resonance Imaging, Vol. 17, No. 3, 1999, pp. 349-354. doi:10.1016/S0730-725X(98)00171-4
- J. Karonen, R. Vanninen, Y. Liu, et al., “Combined Diffusion and Perfusion MRI with Correlation to SinglePhoton Emission CT in Acute Ischemic Stroke,” Stroke, Vol. 30, 1999, pp. 1583-1590. doi:10.1161/01.STR.30.8.1583
- J. Ma, J. Mehrkens, M. Holtmannspoetter, R. Linke, et al., “Perfusion MRI before and after Acetazolamide Administration for Assessment of Cerebrovascular Reserve Capacity in Patients with Symptomatic Internal Carotid Artery (ICA) Occlusion: Comparison with 99mTc-ECD SPECT,” Neuroradiology, Vol. 49, No. 4, 2007, pp. 317- 326. doi:10.1007/s00234-006-0193-x
- R. P. Bokkers, J. P. Bremner, B. N. van Berckel, et al., “Arterial Spin Labelling Perfusion MRI at Multiple Delay Times: A Correlative Study with H215O Positron Emission Tomography in Patients with Symptomatic Carotid Territory Stenosis,” Journal of Cerebral Blood Flow & Metabolism, Vol. 30, 2010, pp. 222-229. doi:10.1038/jcbfm.2009.204
- P. A. Barber, A. M. Demchuk, J. Zhang, et al., “Validity and Reliability of a Quantitative Computed Tomography Score in Predicting Outcome of Hyperacute Stroke before Thrombolytic Therapy,” Lancet, Vol. 355, No. 9216, 2000, pp. 1670-1674. doi:10.1016/S0140-6736(00)02237-6
- L. Ostergaard, R. Weisskoff, D. Chesler, et al., “High Resolution Measurement of Cerebral Blood Flow Using Intravascular Tracer Bolus Passages. Part I: Mathematical Approach and Statistical Analysis,” Magnetic Resonance in Medicine, Vol. 36, No. 5, 1996, pp. 715-725. doi:10.1002/mrm.1910360510
- L. Ostergaard, A. Sorensen, K. Kwong, et al., “High Resolution Measurement of Cerebral Blood Flow Using Intravascular Tracer Bolus Passages. Part II: Experimental Comparison and Preliminary Results,” Magnetic Resonance in Medicine, Vol. 36, No. 5, 1996, pp. 726- 736. doi:10.1002/mrm.1910360511
- J. M. Bland and D. G. Altman, “Statistical Methods for Assessing Agreement between Two Methods of Clinical Measurement,” Lancet, Vol. 327, No. 8476, 1986, pp. 307-310. doi:10.1016/S0140-6736(86)90837-8
- S. Kuroda, K. Houkin, H. Kamiyama, et al., “Long-Term Prognosis of Medically Treated Patients with Internal Carotid or Middle Cerebral Artery Occlusion: Can Acetazolamide Test Predict It?” Stroke, Vol. 32, 2001, pp. 2110-2116. doi:10.1161/hs0901.095692
- F. Calamante, D. G. Gadian and A. Connelly, “Quantification of Perfusion Using Bolus Tracking Magnetic Resonance Imaging in Stroke: Assumptions, Limitations, and Potential Implications for Clinical Use,” Stroke, Vol. 33, 2002, pp. 1146-1151. doi:10.1161/01.STR.0000014208.05597.33
- O. Wu, L. Ostergaard, R. M. Weisskoff, T. Benner, et al., “Tracer Arrival Timing-Insensitive Technique for Estimating Flow in MR Perfusion-Weighted Imaging Using Singular Value Decomposition with a Block-Circulant Deconvolution Matrix,” Magnetic Resonance in Medicine, Vol. 50, No. 1, 2003, pp. 164-174. doi:10.1002/mrm.10522
- D. Bonekamp, M. Degaonkar and P. B. Barker, “Quantitative Cerebral Blood Flow in Dynamic Susceptibility Contrast MRI Using Total Cerebral Flow from Phase Contrast Magnetic Resonance Angiography,” Magnetic Resonance in Medicine, Vol. 66, No. 1, 2011, pp. 57-66. doi:10.1002/mrm.22776
- H. Tan, J. A. Maldjian, J. M. Pollock, et al., “A Fast, Effective Filtering Method for Improving Clinical Pulsed Arterial Spin Labelling MRI,” Journal of Magnetic Resonance Imaging, Vol. 29, No. 5, 2009, pp. 1134-1139. doi:10.1002/jmri.21721
- K. Kikuchi, K. Murase, H. Miki, et al., “Measurement of Cerebral Hemodynamics with Perfusion-Weighted MR Imaging: Comparison with Preand Post-Acetazolamide 133Xe-SPECT in Occlusive Carotid Disease,” American Journal of Neuroradiology, Vol. 22, 2001, pp. 248-254.
- N. Lassen, A. Andersen, L. Friberg, et al., “The Retention of [99mTc]-d,l-HM-PAO in the Human Brain after Intravascular Bolus Injection: A Kinetic Analysis,” Journal of Cerebral Blood Flow & Metabolism, Vol. 8, 1988, pp. S13-S22. doi:10.1038/jcbfm.1988.28