International Journal of Intelligence Science
Vol.3 No.3(2013), Article ID:34098,8 pages DOI:10.4236/ijis.2013.33015
Using Artificial Neural Network Modeling in Forecasting Revenue: Case Study in National Insurance Company/Iraq
Ministry of Higher Education and Scientific Research, Baghdad, Iraq
Email: itedal_bahia@yahoo.com
Copyright © 2013 Itedal Sabri Hashim Bahia. This is an open access article distributed under the Creative Commons Attribution License, which permits unrestricted use, distribution, and reproduction in any medium, provided the original work is properly cited.
Received March 25, 2013; revised April 28, 2013; accepted June 3, 2013
Keywords: ANN; Regression Analysis; Forecasting Revenue; National Insurance Company
ABSTRACT
There are few changes that took place in Iraq in many fields during the past few years; the financial aspect is one of the fields that undergone this change. The change has positive impact because it increases the revenue in Iraq from the oil exports. The National Insurance Company is one of many companies that belongs to the Ministry of Finance in Iraq and has affected directly from this change in term of increasing the number of the insurers which we will discuss in this research. The aim of this research is to forecast the insurance premiums revenue of the National Insurance Company between the years 2012 to 2053 using Artificial Neural Network based on the actual annual data of the insurance premiums revenue between the years 1970 to 2011. The data analyses results of this research show that the growth indicator of the insurance premiums revenue for the next 41 years is approximately 120%, the Mean Squared Error is the average squared difference between outputs and targets. Lower values are better. Zero means no error and the regression values are very high. The estimations and forecasts of the insurance premiums revenue using Artificial Neural Network confirmed to be strong and useful to deploy it for forecasting the insurance premiums revenue.
1. Introduction
The insurance is a strategic sector between other economic sectors, it provides an economic protection to the human and material resources and it acts as a shield protects the national economy against financial crises. The insurance plays a key role in the growth and stability of various economic sectors and contributes effectively in achieving the objectives of the economic development plans due to the financial weight that this sector occupying driven by the outstanding role, and that the insurance companies play in compiling the national savings which requires a high financial skills from the insurance companies to ensure its continuation in the market and to achieve a high level of profits through meeting their obligations towards policyholders rights.
There is no doubt that the developments in the insurance sector and the expected changes in the next era enforce to deploy new analysis methods to monitor the financial work of the insurance companies especially the finance and investment. Therefore the financial analysis adopts a great importance in various areas of economic activities and this importance is increasing particularly in the banking sector and insurance entities that came from the nature of the banks and insurance companies works which is related to money collections from the depositors and policyholders.
The importance of financial analysis is not only because it represents a tool to assess performance and management’s efficiency, but it also for its necessity in the financial planning processes.
The financial analysis methods aim to identify the extent of the outcome that resulted from applying the legal policies and implementing the decisions in the companies and the ability of these companies to fulfill their obligations towards the policyholders, as well as to assist and enable the financial supervisors to monitor the policies implementation of the insurance companies, they also aim to help the investor in identifying the activity and the finance solvency of these companies.
In order to forecast problems more accurately in management, an Artificial Neural Network (ANN) model has been applied in many varieties of business decision making. For example, ANN is widely used by companies for forecasting bankruptcy, customer churning, stock price forecasting and many other areas. We used generated regression and ANN method to forecast the insurance premiums revenue of the insurance company.
2. Historical Extract about the Company
The company was established according to act No. 56 of 1950. Upon issuance of the public companies act No. 22 for the year 1997 and in accordance with the requirements of the above act the company became a state company vide the establishment certificate No. 54 on the 24th Dec. 1997 issued by the minister of Trade/companies registrar [1].
The nature of activity in the company is illustrated in two points:
First: The company transacts all types of general Insurance Marine, fire and Accident, Motor, Agricultural, Engineering Insurance and life assurance and Reinsurance. The company also gives advice in various insurance cases.
Second: The company invests its financial revenues in different faces of investment i.e. real estates investment, deposits and transfers, sharing in other firms capitals [1].
Investment Company
The company has invested its revenues in several fields for continuity and to obtain profits through the following:
1) Awarding loans for people to establish specific projects against annual interest.
2) Deposit cash flow in banks against proper annual interest.
3) The company uses part of its cash flow by sharing in private and mixed sector firms to obtain good returns.
4) The company has invested its property of building and lands by renting them to people to have good invested returns.
Commissions granted by the company to its official and public marketing staff differs according to the types of insurance and marketing channels as shown in the following attached schedule in Table 1 [1].
3. Related Work
Mehdi Safdari [2] used neural network models and Monte Carlo simulation to estimate and forecast the Iran budget deficit. First stipulated fundamental variables and model, studied stationary of the variables and were unstable some variables. Most variables were stationary including structural breaks and the computed Zivot-Anders and Gregory-Hansen tests. Then there was a li

Table 1. General Insurance in the company [1].
ttle chaotic time series in the review chaos by Lyapunov exponents. More using the neural network model to examine and forecast budget deficit. In the end, forecasted optimal budget deficit with using Monte Carlo simulation in the presence of uncertainty caused by government policies. Expected results of Monte Carlo prediction show what should it be and neural network prediction shows what it is.
Mohammad Sarchami and Mehdi Eftekhari [3] forecasting per share earnings in investments is very important because it is a significant factor in methods of stock evaluation; and in most of these cases, it is a fundamental factor in investing in the stock market. In order to forecast per share earnings using an “artificial neural network with an error backward propagation algorithm” and an “artificial neural network with a genetic algorithm”, 61 firms in 7 financial years, from the beginning of 1381 until the end of 1387, with 9 variables (8 input variables and 1 output variable) were chosen; from which 3843 (61 × 7 × 9) data points were extracted. The hypotheses are based on the idea that: 1) an artificial neural network with an error backward propagation algorithm is able to forecast the earnings of per share; 2) a neural network with a genetic algorithm is able to forecast the earnings per share; and 3) the neural network with the error backward propagation algorithm has less error in forecasting the earnings per share than the neural network with the genetic algorithm. To test the hypotheses, the results confirm all hypotheses.
Greg Tkacz and Sarah Hu [4], financial and monetary variables have long been known to contain useful leading information regarding economic activity. In this paper, the authors wish to determine whether the forecasting performance of such variables can be improved using neural network models. The main findings are that, at the 1-quarter forecasting horizon, neural networks yield no significant forecast improvements. At the 4- quarter horizon, however, the improved forecast accuracy is statistically significant. The root mean squared forecast errors of the best neural network models are about 15 to 19 per cent lower than their linear model counterparts. The improved forecast accuracy may be capturing more fundamental non-linearities between financial variables and real output growth at the longer horizon.
Abbas Vahedi [5] predicted of stock price in Tehran Stock Exchange Using Artificial Neural Network for annual data from 2000 to 2008. In this regard this approach is established with investment income, stock sales income, earnings per share and net assets as independent (Input) variables. Results showed that estimation and predictions of stock price with Artificial Neural Network are possible and have suitable and stronger results. Best architecture is a network with two hidden layer and twelve two neuron in hidden layers with hyperbolic tangent transfer function both in hidden and output layers with Quasi-Newton training algorithm.
Pei-Chann Chang, Chen-Hao Liu, Jun-Lin Lin, Chin-Yuan Fan and Celeste S.P. Ng [6], stock forecasting involves complex interactions between market-influencing factors and unknown random processes. In this study, an integrated system, CBDWNN by combining dynamic time windows, case based reasoning (CBR), and neural network for stock trading prediction is developed and it includes three different stages: 1) screening out potential stocks and the important influential factors; 2) using back propagation network (BPN) to predict the buy/sell points (wave peak and wave trough) of stock price and 3) adopting case based dynamic window (CBDW) to further improve the forecasting results from BPN. The system developed in this research is a first attempt in the literature to predict the sell/buy decision points instead of stock price itself. The empirical results show that the CBDW can assist the BPN to reduce the false alarm of buying or selling decisions. Nine different stocks with different trends, i.e., upward, downward and steady, are studied and one individual stock (AUO) will be studied as case example. The rates of return for upward, steady, and downward trend stocks are higher than 93.57%, 37.75%, and 46.62%, respectively. These results are all very promising and better than using CBR or BPN alone.
Rob Law and Norman Au [7], apart from simple guesswork, time-series and regression techniques have largely dominated forecasting models for international tourism demand. This paper presents a new approach that uses a supervised feed-forward neural network model to forecast Japanese tourist arrivals in Hong Kong. The input layer of the neural network contains six nodes: Service Price, Average Hotel Rate, Foreign Exchange Rate, Population, Marketing Expenses, and Gross Domestic Expenditure. The single node in the output layer of the neural network represents the Japanese demand for travel to Hong Kong. Socially published annual data in the period of 1967 to 1996 were used to build the neural network. Estimated Japanese arrivals were compared with actual published Japanese arrivals. Experimental results showed that using the neural network model to forecast Japanese arrivals outperforms multiple regression, moving average, and exponent smoothing (1999 Elsevier Science Ltd. All rights reserved).
R. G. Hoptroff [8] is intended as a “hands-on” practical discussion of how and why neural networks are used in forecasting and business modeling. The need for forecasting is briefly examined. The theory of the multilayer perceptron neural network is then covered both qualitatively and in mathematical detail, including the methods of back-propagation of error and independent validation. The advantages of the neural net approach to forecasting, namely nonlinear modelling capability, plausible interpolations and extrapolations, robustness to noise, illconditioning and insufficient data, and ease of use, are discussed. Finally, some working notes are offered for the practical implementation of neural nets in forecasting, and four real-life examples are given from the pursuits of econometrics, sales forecasting, market modeling, and risk evaluation.
4. ANN
ANNs offer a computational approach that is quite different from conventional digital computation. Digital computers operate sequentially and can do arithmetic computation extremely fast. Biological neurons in the human brain are extremely slow devices and are capable of performing a tremendous amount of computation tasks necessary to do every day complex tasks, commonsense reasoning and dealing with fuzzy situations. The underlining reason is that, unlike a conventional computer, the brain contains a huge number of neurons, information processing elements of the biological nervous system, acting in parallel.
ANNs are thus a parallel, distributed information processing structure consisting of processing elements interconnected via unidirectional signal channels called connection weights. Although modeled after biological neurons, ANNs are much simplified and bear only superficial resemblance. Some of the major attributes of ANNs are: 1) they can learn from examples and generalize well on unseen data, and 2) are able to deal with situation where the input data are erroneous, incomplete or fuzzy [9].
Individual Neuron
The individual processing unit in ANNs receives input from other sources or output signals of other units and produces an output as shown in Figure 1. The input signals (xi) are multiplied with weights (Wji) of connection strength between the sending unit “i” and receiving unit “j”. The sum of the weighted inputs is passed through an activation function. The output may be used as an input to the neighboring units or units at the next layer. Assuming the input signal by a vector  and the corresponding weights to unit “j” by
 , the net input to the unit “j” is given by Equation (1). The weight (Wj0 = b) is a special weight called bias whose input signal is always +1 [9].
 . (1)
. (1)
5. Methodology
An Artificial Neural Network is making of Artificial

Figure 1. An individual unit in a neural network [9].
Neurons. Neuron is the smallest processing unit and is the base of neural network operation. The greatest advantage of a neural network is its ability to modeling complex nonlinear relationship without a priori assumptions of the nature of the relationship.
Neural network has three layers; input layer, hidden layer and output layer. Input layer just takes the data and behaves like an independent variable therefore amount of neuron in input layer depends on the variable. Output layer behaves like a dependent variable and amount of neuron in this layer depends on the dependent variables (forecasting variables).
If the networks output shows with  and actual value with Y, the purpose of network training is to find the networks weight to minimize the network error. If the error of forecasting determined with Sum of Squared Errors (SSE) purpose is to minimize the Equation (2) [10].
 (2)
(2)
Fitting, Neural Network
The Neural Network Fitting Tool helps to select data, create and train a network and evaluate its performance using mean square error and regression analysis.
A two-layer feed-forward network with sigmoid hidden neurons and linear output neurons Neural Network Fitting can fit multi-dimensional mapping problems arbitrarily well, given consistent data and enough neurons in its hidden layer.
The network will be trained with Levenberg-Marquardt backpropagation algorithm, unless there is not enough memory, in which case scaled conjugate gradient backpropagation will be used [11].
To define a fitting problem, arrange a set of Q input vectors as columns in a matrix then, arrange another set of Q target vectors (the correct output vectors for each of the input vectors) into a second matrix [10].
The process of finding the best set of weights for the neural network is referred to as training or learning. The approach used by most commercial software to estimate the weights is backpropagation. Each time the network cycles through the training data, it produces a predicted value for the target variable. This value is compared to the actual value for the target variable and an error is computed for each observation. The errors are “fed back” through the network and new weights are computed to reduce the overall error. Despite the neural network terminology, the training process is actually a statistical optimization procedure. Typically, the procedure minimizes the sum of the squared residuals in Equation (3) [12].
 (3)
(3)
In Fit Neural Network the data of the research contain a predefined set of input and target vectors. The input vectors define data regarding the insurance premiums revenue for the period 1970 to 2011 and the target values define relative values of the insurance premiums. The input matrix consists of one column vectors of insurance premiums revenue investment for 41 samples and target matrix consist of one column vector of the corresponding 41 relative valuations samples. The 1 × 41 inputs and targets vectors are randomly divided into three sets, 60% of the vectors are used to train the network, and the network is adjusted according to its error. 20% of the vectors are used to validate how well the network generalized and to halt training when generalization stops im proving. Finally, the last 20% of the vectors are used to test the network which has no effect on training and provides an independent measure of network performance during and after training. Figure 2 illustrates fit neural network structure.
The next step is to create a network and train it until it has learned the relationship between the inputs and targets. The fit neural network has 5 neurons in the hidden layer. The numbers of neurons in the output layer are automatically set to one vector for 41 samples and the number of elements in each vector of target. Fit Neural Network can potentially represent any input-output relationship with a finite number of discontinuities.
6. Experimental Result
This section demonstrates the common steps of solving a problem with fit neural network. The first step is to define the problem.
For supervised networks, such as Fit Neural Networks trained with backpropagation, this means a set of input vectors and a set of associated desired output vectors called target vectors, as shown in Figure 3.
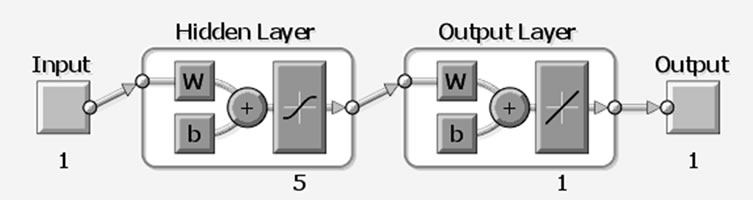
Figure 2. Fit neural network structure.

Figure 3. The fitting neural network function.
According to the results
• The network stopped at 1 iteration
• Time was ~0
• The mean squared error was 1.15E + 22
• The gradient (slope) was at 2.76E + 22 when it stopped
• The LM update value was 1.00E + 11 At the one epoch the best validation performance in 0 iteration and training state in one epoch are shown in Figures 4 and 5. The network will be trained with Levenberg-Marquardt back propagation algorithm at epoch1. In fitting problem, a neural network is used to map between a data set of numeric inputs and a set of numeric targets.
The Neural Network Fitting Tool helps to select data, create and train a network and evaluate its performance using mean square error and regression analysis, as shown in Table 2.

Figure 4. The best validation performance.

Figure 5. The training state.
Regression R Values measure the correlation between outputs and targets. An R value of ≈ 1 means a close relationship and 0 a random relationship, as shown in Figure 6.
Mean Squared Error is the average squared difference between outputs and targets. Lower values are better. Zero means no error. The Mean Squared Error (MSE) is a measure of how close a fitted line is to data points. For every data point, take the distance vertically from the point to the corresponding value on the curve fit (the error), and square the value, MSE is a network performance function. It measures the network's performance according to the mean of squared errors, as shown in Figures 7 and 8.
7. Discusses the Result
A Fitting Neural Network topology was adopted for the forecast model. During the development of the forecasting model various architectures were developed and evaluated. The input layer of the neural network had one vector, represented 41 samples of insurance premiums revenue of one element (41 × 1). The output from this neuron was linearly de-normalised to produce a value for the fore

Table 2. The MSE and regression for three sets.

Figure 6. The regression for training, validation, test and all samples.
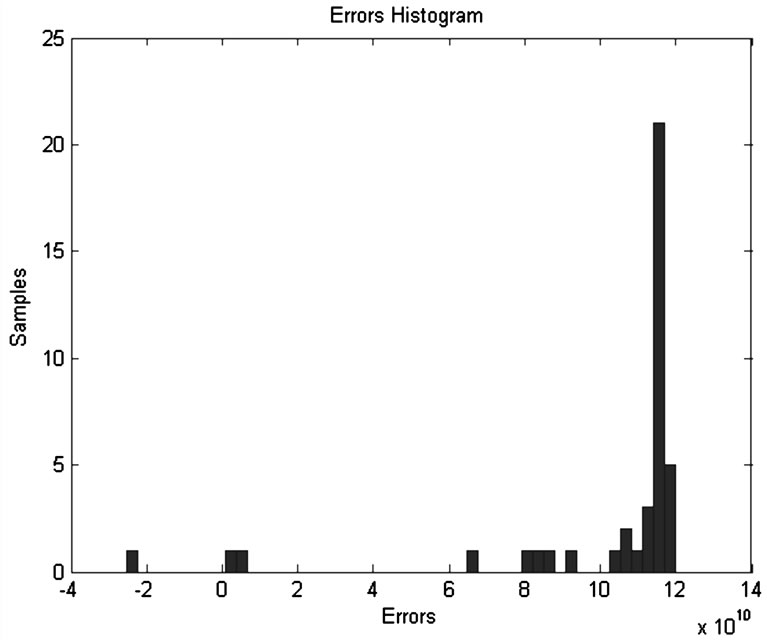
Figure 7. The errors histogram.

Figure 8. Distribution the errors for input, target and output samples.
casted number of epochs to stop training in the range 0 - 1000.
The neural network generated for the required forecasting model had a 1-5-1 architecture. The forecast performance of Fitting Neural Network model was satisfactory (MSE (train) = 1.15E + 22, MSE (validation) = 1.20E + 22, MSE (test) = 1.05E + 22).
The simulated value was almost the same with actual value. Take a look at the regression plot of all state Figure 6. Each of the Figures corresponds to a specific target from the output array. As all the R parameters are very close to 1, this means that the correlation between the outputs and the targets is very high, as illustrated in Table 2. The fit neural network based on the training data and the results shows an increment in the insurance premiums revenue for approximately 120% in the future for the period from 2012 to 2053.
8. Conclusions
Artificial Neural Network is a well known approach for estimation and forecasting of various economic and accounting variables. The aim of this research is to forecast the insurance premiums revenue of the National Insurance Company in Iraq using Artificial Neural Network for the annual data of the years between 1970 and 2011. This approach is established with investment income of the National Insurance Company as independent (Input) variable.
The results showed that forecasting the insurance premiums revenue with Artificial Neural Network is possible and provides strong results of forecasting. Best architecture for fitting neural network as one input vector, five hidden layer and the output is one vector (1-5-1), the ratio of increasing the insurance premiums revenue is approximately 120% for the period between 2012 and 2053 as a forecast for the future.
REFERENCES
- National Insurance Company Site. http://www.nic.gov.iq/index_files/Page419.htm
- M. Safdari and M. Shamsoddini, “Using Artificial Neural Networks and Monte Carlo Simulation in Terms of Uncertainty for Prediction of Budget Deficit in Iran,” Interdisciplinary Journal of Contemporary Research in Business, Vol. 4, No. 2, 2012, p. 132.
- M. Sarchami and M. Eftekhari, “Using Artificial Neural Networks for Forecasting per Share Earnings,” African Journal of Business Management, Vol. 6, No. 11, 2012, pp. 4288-4294.
- G. Tkacz and S. Hu, “Department of Monetary and Financial Analysis Bank of Canada Ottawa, Ontario, Canada K1A 0G9, Forecasting GDP Growth Using Artificial,” Neural Networks, Bank of Canada Working Paper 99-3, 1999.
- A. Vahedi, “The Predicting Stock Price Using Artificial Neural Network,” Journal of Basic and Applied Scientific Research, Vol. 2, No. 3, 2012, pp. 2325-2328.
- P.-C. Chang, C.-H. Liu, J.-L. Lin, C.-Y. Fan and C. S. P. Ng, “A Neural Network with a Case Based Dynamic Window for Stock Trading Prediction,” Expert Systems with Applications, Vol. 36, No. 3, 2009, pp. 6889-6898.
- R. Law and N. Au, “A Neural Network Model to Forecast Japanese Demand for Travel to Hong Kong,” The Hong Kong Polytechnic University, Kowloon, 1999. doi:10.1016/S0261-5177(98)00094-6
- R. G. Hoptroff, “The Principles and Practice of Time Series Forecasting and Business Modelling Using Neural Nets,” Neural Computing and Applications, Vol. 1, No. 1 1993, pp. 59-66. doi:10.1007/BF01411375
- J. Kamruzzaman and R. A. Sarker, “Artificial Neural Networks: Applications in Finance and Manufacturing,” 2006.
- M. Beale, M. T. Hagan and H. Demuth, “Neural Network Toolbox™ 7 User’s Guide,” The MathWorks, Inc., Natick.
- The MathWorks, Inc., “MATLAB® Primer, R2012a” 2012. http://www.eng.umd.edu/~nsw/chbe250/getstart.pdf
- S. Bridgeland, M. Dorey and J. Palin, “Neural Networks Statistics for Professionals?” 1997.