World Journal of Nuclear Science and Technology
Vol.07 No.03(2017), Article ID:76906,10 pages
10.4236/wjnst.2017.73013
Neutron Flux Signal Acquisition from Plant Instrumentation Channel of Research Reactor for Reactivity Calculation
N. Jahan1, M. M. Rahman1, M. Q. Huda2
1Institute of Energy Science, Atomic Energy Research Establishment, Savar, Bangladesh
2Quality Management Division, Bangladesh Atomic Energy Commission, Dhaka, Bangladesh

Copyright © 2017 by authors and Scientific Research Publishing Inc.
This work is licensed under the Creative Commons Attribution International License (CC BY 4.0).
http://creativecommons.org/licenses/by/4.0/


Received: April 11, 2017; Accepted: June 12, 2017; Published: June 15, 2017
ABSTRACT
A design for instantaneous neutron flux signal acquisition system is being carried out for reactivity measurement of the nuclear research reactor. It is a computer-based digital data acquisition system that can perform continuous monitor and measurement of reactivity inserted into or removed from the research reactor. The acquisition system accomplishes with two major parts. The first part is an interfacing PCI based data acquisition card and the corresponding driver software intending to on-line acquisition of neutron flux signals from plant instrumentation channel. The second part incorporates the high-level Visual Basic real time program, indigenously developed for computation of reactivity by the solution of neutron point kinetic equations and other relevant functional modules like input file logging, reactivity calculation, graphics demonstration etc.
Keywords:
Data Acquisition, Reactivity, Point Kinetic, On-Line, Research Reactor

1. Introduction
The research work has been conducted for the design and development of a real time data acquisition system for acquiring instantaneous neutron signal and monitoring reactivity change of the research reactor. An on-line reactivity measurement system that can output the value of the reactivity inserted into or removed from the reactor core is considered to be a useful device. In the start-up and operation of nuclear reactors, continuous reactivity surveillance is necessary to safely and efficiently reach the operating power level. At high power levels, careful monitoring of reactivity is needed to determine the temperature, poison and power coefficients of reactivity. It provides the reactor operator with a direct indication of (net) reactivity, which is a much more definitive indication of the nuclear reactor status of the core than the indirect and flawed power meter/ reactor rate meter combination. The indicated reactivity is correct regardless of the observed power behavior. As such, the reactivity meter offers greater safety in reactor operation, aids the task of reactivity management, and is strongly recommended as meter indication in the Control Room. A few reactors employ such a reactivity meter for a number of years [1] - [7] . Prior to this research work, Malaysia research reactor “PUSPATI” console was analogue-based and had no reactivity meter. Korea Atomic Energy Commission (KAERI) upgraded the console into digital version. During digitization, KAERI has included an on-line reactivity measurement system. The research paper has detailed portrayal of this dedicated on-line reactivity measurement.
There are two different techniques to measure the reactivity: dynamic and kinetics. In the dynamic technique the stable or asymptotic reactor period is measured and reactivity is determined from the in-hour equation. This technique works for positive period only. For the kinetic technique of measuring reactivity, reactivity changes may be made continuously and reactivity at each instant is determined by analyzing the time variation of the reactor power level using the point kinetics equations. This reactivity measurement system utilizes the kinetic method approach.
2. Theoretical Considerations
The point kinetic equations describe the kinetic behavior of the reactor. That means these equations describe the change in the neutron density within the reactor due to a change in reactivity and are the most fundamental relations. The standard point kinetics equations can be written as:
 (1)
(1)
And
 (2)
(2)
where  is the total number of neutrons in the core, which is directly proportional to the reactor power at time tj,
  is the total number of precursors of delayed neutrons of group i. S is the total neutron source strength supposed to be constant in time, Λ is the prompt neutron generation time and
  the reactivity to be determined. The constants
  and
and  are the fraction and decay constant of delayed neutron precursor of group i, respectively, and
  is the effective delayed neutron fraction.
In practice, for discrete time series data, assuming that the reactor power change for the time interval Δt is given by 
The inverse kinetics equation can be written as:
 (3)
(3)
where
 (4)
(4)
Solving the equations for precursor concentrations of 6 groups and putting their summation in Equation (3) for reactivity, the algorithms for reactivity measurement system were derived.
3. System Design
The data acquisition system describes here consists of hardware and software for online acquisition of neutron flux signals from the reactor plant instrumentation channel and calculate reactivity. The hardware part comprises an interfacing PCI based data acquisition card and a PC. The software part incorporates the corresponding driver software intend to on-line acquisition of neutron flux signals and the indigenously developed Visual Basic real time program for computation of reactivity by the solution of neutron point kinetic equations and other relevant functions. The block diagram of the digital reactivity measurement system is shown in Figure 1. The system can acquire signal from both linear and log power channel. It can operate in either off-line (demonstration) or on-line (real time) mode. The sampling rate can be adjusted manually by the user from 1 to 100 samples per second. It incorporates a digital filtering technique for noise rejection. It displays the instantaneous reactivity value along with the corresponding neutron flux signals on the computer monitor by plot as well as by numeric form. In parallel with on line display, the data acquisition system is capable of saving instant data at predefined time interval. All records of a particular session of a single reactor operation are saved as a data file which can be used as input file in off-line mode.
3.1. Hardware Installation
The primary requirement to design and develop a viable on-line data acquisition is to select an appropriate data acquisition card. Here, for the implementation of real time reactivity measurement system “PCI-1713U” data acquisition card has

Figure 1. Block diagram of the data acquisition system for reactivity measurement.
been used. This PCI-1713U data acquisition card has been installed in PCI slot inside the computer to obtain neutron signal from reactor instrumentation channel and convert the signal from analog to digital format. The main features of the card are as follow [8] :
Features
l Analog channels can be used as 32 singled-ended or 16 differential analog inputs or a combination.
l 12-bit A/D converter, with maximum 100 k Hz sampling rate
l Programmable gain for each input channel
l Automatic channel/gain scanning
l On-board 4 K samples FIFO buffer
l Programmable pacer
l Conversion time: 2.5 µs
l Maximum Input Overvoltage: ± 30 V
Other required peripheral hardware accessories are I/O connector of the PCI-1713 card, 37-pin D-type cable and wiring terminal board. The terminal board has been used to communicate signal between instrumentation channel of the reactor and the computer. Here the single-ended input configuration has been implemented that used only one signal wire for each channel and the measured voltage is the voltage of the wire referred to the common ground. Though the board can drive up to 32 channels, here only 1 channel has been used.
3.2. Software
After incorporate the data acquisition card, its associated driver software has been installed which performs communication dialogue between PC and instrumentation channel for all data acquisition and I/O functions for advance processing. Therefore, each time the data acquisition system gets functioning, the driver software does initialization first and starts acquiring the neutron flux signal. The initialization tasks of driver software are to address the acquisition board, identify the input channel and select the input voltage range.
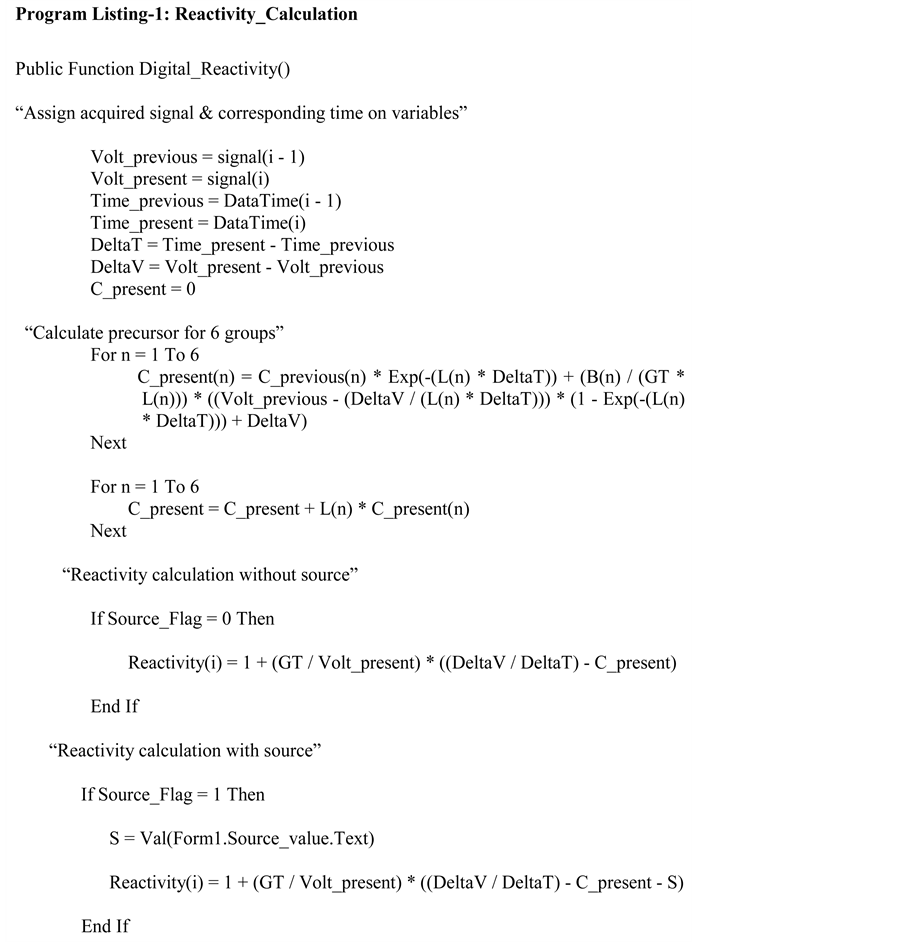
After handshaking between instrumentation channel and computer, the developed Visual Basic (VB) program reads the digitized data and use these data in the execution of various functions of the reactivity measurement like time dependent reactivity calculation, display and record of data etc. The VB code for the calculation of the reactivity is given in Program Listing-1. In the program digitized neutron flux signal data is assigned as ‘Volt_previous” and “Volt_ present” variables. “Volt_present” refer to the instantaneously acquired signal value and ‘Volt_previous” address to the signal value immediate before “Volt_ present”. “Timer1_Timer” function of the Visual Basic language has been used to set up the speed of signal scanning [9] . This gives the corresponding time of the signal acquired and is assign as “DataTime” variable. These initial values are required to calculate the precursor concentration (C_previous) at time zero for 6 groups. A set of voltage signal and its instantaneous time have been acquired after each predetermined interval as long as program continues running. Then mathematical calculations have been done using point kinetic equations to get reactivity value. Then with the reactivity, signal and time graphs for reactivity versus time and signal versus time have been plotted. Thus the program can display the graph and numerical data simultaneously at each power signal level.
4. Operational Procedures
The design of the user interface of VB program follows proven and well-known patterns in order to allow technical as well as non-technical personnel to operate it with minimum training. The program is subdivided into several modules to perform various functions. The flowchart of the program processing is presented in Figure 2 and the main user interface form of the VB program is shown in Figure 3. At the beginning of the operation, the kinetic data set of constants

Figure 2. Flowchart of VB program.

Figure 3. Main interface form.
supposed to be loaded. The program offers three different sets of kinetic data constants. Two of them are standard Keepin and Tuttle data sets of constants [10] and the rest one is user defined, specific for a particular reactor. After kinetic data constants selection, the source of input signal should be identified. The acquisition system provided with two sources of signals for operation: off- line (demonstration) and on-line (real time). In on-line operation, depending upon the necessity of the user, the data acquisition system should be connected with either log or linear instrumentation channel of the reactor. The next thing to do is selection of scanning speed which is implemented by the horizontal scroll bar named “Sampling Rate”. For normal reactor operation it is recommended to acquire 5 - 10 samples/second (200/100 ms time interval) and for rod drop operation 50 - 100 samples/second. In very low signal acquisition environment, it is common to distort original signal by noise interference. To mitigate this noise interference “Moving Average” digital filtering method had been adopted here. After completing all steps of action described above, the program get ready to run and start to acquire power signal, calculate reactivity and display the value as plot as well as numeric form. After completion of a single operational session user may save all data of interest or skip the save function before exit from the program.
5. Rod Drop Experiment
For the determination of reactivity in on-line environment with the developed system, rod drop experiment in HANARO research reactor, KAERI was done. In this experiment, the reactor was at a constant power of 3 kw and rods were at critical position. Then, rod was dropped and signal was acquired by developed acquisition system on a time interval of 0.001 second. Signal can be acquired from both “Log-Channel” & Linear-Channel”. Here signal was taken from log channel. The acquired signals from both channels are always in voltage form and it has been converted to percent full power format before calculation. The conversion formula for log channel voltage used here is:
For log channel signal: %PWR = 10 ^ (Voltage-8)
Initially, the reactivity meter calculates the reactivity neglecting source term using the signal acquired from reactor core. Using this reactivity without source and the power signal value, the external source term has been determined by least square inverse kinetic method. After determining source term, its value has been added to the algorithm and the reactivity has been calculated again with reactivity meter, considering the source term. The new measured value of the reactivity is more precise then the measurement which neglects source term. Figure 4 shows the plots of the power signal, reactivity without source term and with source term. The reactivity obtained using the source term is constant in time, while the value with the source term neglected shows a tendency to go to zero [11] .
Finally the precision of measured reactivity from on-line data acquisition system has been validated from the differential rod worth curve. Figure 5 below
 (a)
(a) (b)
(b) (c)
(c)
Figure 4. Rod drop experiment. (a) Signal versus Time; (b) Reactivity without Source; (c) Reactivity with Source.
provide the differential rod worth curve of HANARO research reactor. From the differential curve, reactivity worth is 0.019767$ at 75 mm rod position. And the experimental data of reactivity worth from HANARO research reactor on the

Figure 5. Differential rod worth ($) versus position (mm) curve.
same position is about 0.0045$ which is one fourth of that from differential curve. Similarly experimental reactivity value at 275 mm control rod position is about 0.011$ and from differential curve it is 0.0414$ which is about four times higher than experimental value. As the differential curve considers the effect of four control rods of HANARO research reactor whereas reactivity meter produces calculation considering the impact of only one control rod, obviously, the reactivity worth from reactivity meter is four times less than the value from graph. Therefore, it is proved that experimental data has good agreement with differential curve which consequently indicates that the develop reactivity measurement system can measure reactivity accurately.
6. Conclusions
The real time data acquisition system illustrated in this paper has been designed and fabricated for the reactor TRIGA PUSPATI (RTP) suitable for continuous monitor and measuring the instantaneous reactivity while performing a variety of reactor experiments. The absolute system is the abridgment of design and development effort of the hardware and the software entity. The hardware section is used for online acquisition of neutron flux signals from reactor console. The indigenously developed real-time Visual Basic program intends to perform various functions such as instant reactivity calculation by point kinetic equations, on-line numerical as well as graphical display of instantaneous reactivity deviation with time due to change in power level, saving data, etc. At present this reactivity meter has been interfaced with the RTP digital console and serving the required purposes. The drawback of this method is that the acquired signal may contain considerable noise. However, to mitigate this, a digital filter program has been included in main program to minimize noise level. The Least Squares inverse kinetic method is also used here with best suited fitting model to calculate the reactivity with source term of the research reactor.
Cite this paper
Jahan, N., Rahman, M.M. and Huda, M.Q. (2017) Neutron Flux Signal Acquisition from Plant Instrumentation Channel of Research Reactor for Reactivity Calculation. World Journal of Nuclear Science and Technology, 7, 145-154. https://doi.org/10.4236/wjnst.2017.73013
References
- 1. Ansari, S.A. (1991) Development of On-Line Reactivity Meter for Nuclear Reactors. IEEE Transactions on Nuclear Science, 38, 946-952.
https://doi.org/10.1109/23.83857 - 2. Binney, S.E. and Bakir, A.J.M. (1989) Design and Development of a Personal Computer-Based Reactivity Meter for a Research Reactor. Nuclear Technology, 85, 12-21.
- 3. Engle, J.R. (1967) Experience with an On-Line Reactivity Balance Calculation as a Guide for Reactor Operation. Proceedings of Conference onIncipient Failure Diagnosis for Assuring Safety and Availability of Nuclear Power Plants, Tennessee, 30 October-1 November 1967, 58.
- 4. Lawrence, B.R. and Bullock, J.B. (1970) An Algorithm for Calculating Reactivity from Neutron Flux Using an On-Line Computer. Oak Ridge National Laboratory, Tennessee.
https://doi.org/10.2172/4164979 - 5. Jahan, N., Rashid, M.M., Khayer, M.A., Blauman, H. and Longhino, J. (2005) Design and Development of a Real Time Digital Reactivity Meter for a Research Reactor. Journal of the Bangladesh Electronics Society, 5, 15-22.
- 6. Wakabayashi, G., Yonemura, Y., Heguri, H., Matoba, M., Hashimoto, K. and Horigu-chi, T. (2001) Measurement of Varying Sub-Critical Reactivity with Digital Time-Series Data Acquisition System Using Difference Filter Technique. IEEE Nuclear Science Symposium Conference Record, 1, 403-405.
- 7. Jahan, N., Rashid, M.M., Khayer, M.A. and Islam, S.M.A. (2011) On Line Digital Reactivity Meter for TRIGA Mark-II Research Reactor of Bangladesh. International Journal of Electronics Engineering Research (IJEER), 3, 151-161.
- 8. Advantech (2013) 32 Channel Isolated Analogue Input Card User Manual PCI-1713. Advantech, Taipei.
- 9. Petroutsos, E. (1998) Mastering Visual Basic 6. BPB Publications, New Delhi.
- 10. Glasstone, S. and Sesonske, A. (1986) Nuclear Reactor Engineering. CBS Publishers & Distributors, Delhi.
- 11. Tamura, S. (2003) Signal Fluctuation and Neutron Source in Inverse Kinetics Method for Reactivity Measurement in the Sub-Critical Domain. Journal of Nuclear Science and Technology, 40, 153-157.
https://doi.org/10.1080/18811248.2003.9715345