Journal of Cancer Therapy
Vol.2 No.4(2011), Article ID:7802,16 pages DOI:10.4236/jct.2011.24078
Overexpression of OGFr Downregulates Ovarian Cancer Cell Proliferation in Vitro and Inhibits Tumorigenesis
![]()
Department of Neural and Behavioral Sciences, College of Medicine, Pennsylvania State University, Hershey, USA.
Email: *isz1@psu.edu
Received July 15th, 2011; revised August 13th, 2011; accepted August 30th, 2011.
Keywords: Cell Proliferation, Opioids, [Met5]-Enkephalin, OGF, OGFr, Ovarian Cancer
ABSTRACT
The opioid growth factor (OGF) and its receptor (OGFr) regulate human ovarian cancer cell proliferation through a tonically active inhibitory axis. We investigated the effect of OGFr overexpression on ovarian tumorigenesis. Clonal cell lines of SKOV-3 human ovarian cancer were established to stably overexpress OGFr. shRNA constructs were evaluated for antitumor activity in vitro, as well as in vivo using mouse models of subcutaneous and intraperitoneal tumor transplantation. The 5 clonal cell lines were characterized by increases in OGFr protein (62% to 245%) and binding capacity (51% - 154%), and decreases (36% - 185%) in cell number, relative to untransfected wild-type (WT) cells and empty vector (EV) transfected clones. Nude mice receiving subcutaneous injection of 2 overexpressing OGFr cell lines (OGFr-3 and OGFr-22) had reduced tumor incidence, delayed tumor appearance (up to 12 days), and decreased tumor volume (up to 87%) relative to WT and EV controls. Mice injected intraperitoneal with these clonal lines displayed reduced formation of tumor nodules (up to 95%), and depressed tumor weights (up to 99%) compared to WT and EV groups. DNA synthesis, but not cell survival, was depressed in cells and subcutaneous tumors overexpressing OGFr in comparison to the WT and EV groups. Angiogenesis was reduced up to 86% in clonal tumors compared to WT and EV groups. This preclinical evidence demonstrates that OGFr expression is a molecular determinant of ovarian cancer progression, and has important relevance to understanding the pathogenesis and treatment of this deadly disease.
1. Introduction
Ovarian cancer is the 5th leading cause of cancer related mortality among women in the United States, and the leading cause of death from gynecological malignancies [1]. Ninety percent of primary ovarian cancers are epithelial in origin [2]. Eighty percent of patients present in advanced stages (FIGO stage III/IV), with cytoreductive surgery and adjuvant chemotherapy serving as treatment [3]. Nearly 75% - 80% of women initially respond to treatments; however, approximately 65% of these patients relapse within 12 to 18 months of therapy [4]. Once ovarian cancer recurs, therapeutic modalities are only palliative [3]. The cellular and molecular events involved in ovarian cancer pathogenesis need to be defined, and major improvements in treatment will require new therapies based on exploitation of biological pathways [4].
An integral component of the ovarian cancer phenotype is dysregulation of cell proliferation [5]. One native biological regulator of cell replication in normal cells and a wide variety of cancers, including ovarian cancer, is the opioid growth factor (OGF) and its receptor, OGFr [6- 11]. Chemically termed [Met5]-enkephalin, OGF is a constitutively active native opioid peptide that is autocrine produced and secreted, and interacts with OGFr to delay the G1/S interface of the cell cycle by upregulating cyclin-dependent kinase inhibitory (CKI) pathways [11- 14] without affecting cell survival [11,15]. Although OGFr has pharmacological characteristics of classical opioid receptors (recognizes opioids, naloxone reversibility, stereospecificity), this receptor shares no homology with classical opioid receptors at the nucleotide or amino acid level, and has a different cellular localization [6,16-19]. Regulation of cell proliferation by the OGFOGFr axis involves nucleocytoplasmic trafficking from the outer nuclear envelope to the nucleus that requires nuclear localization signals and transport by karyopherin β and Ran [17,20]. An increase in the OGF-OGFr pathway by the addition of exogenous OGF [7-11,21], treatment with imidazoquinoline compounds such as imiquimod and resiquimod which upregulate OGFr [22], or transfection of sense cDNA for OGFr [23,24], depresses cell proliferation.
The relationship of endogenous opioids and ovarian cancer has received some attention. In 1982, Sporrong et al. [25] recorded immunoreactive enkephalin in primary ovarian carcinoids, whereas Zagon et al. [26] in 1987 noted δ and κ, but not μ, opioid receptors in an ovarian fibroma and stromal hyperplasia tumor, and detected both [Met5]-enkephalin and β-endorphin in an ovarian fibroma. In 1989, Kikuchi and colleagues [27] reported that β-endorphin, α-endorphin, and [Met5]-enkephalin 1) inhibited the growth of human serous cytoadenocarcinoma cells of the ovary in vitro in a dose-dependent manner that was partially reversed by the opioid antagonist, naloxone, and 2) decreased protein and RNA synthesis but not DNA synthesis as measured by [3H]- thymidine incorporation over a 48 h period of time. In a subsequent study, Kikuchi et al. [28] noted that β-endorphin (but not α-endorphin or [Met5]-enkephalin) increased lytic activity in spleen cells from mice bearing human ovarian carcinoma, and speculated that opioid peptides play a role in immune surveillance mechanisms. Finally, Mollick et al. [29] reported antibodies to OGFr in the serum of 4 ovarian cancer patients, and suggested that OGFr may be a “useful target for vaccination”.
Donahue and collaborators [11] have made substantial progress in clarifying the interplay between ovarian cancer and opioid peptides and receptors using an in vitro model of human ovarian cancer. These investigators identified OGF, acting in the capacity of regulating cell proliferation, as the only opioid peptide involved. Moreover, OGFr was discovered to be the opioid receptor that was in an autocrine loop with OGF with respect to maintaining the pace of cell replication. Knockdown of OGFr in the ovarian cancer cells using siRNA resulted in an increase in cell number relative to vehicle controls, and exogenous OGF introduced into these cultures did not depress cell proliferation [11,21]. In the present report we investigated the repercussions of upregulating OGFr in human ovarian cancer cells. Using a number of clonal cell lines, stable molecular overexpression of OGFr in vitro was found to decrease cell proliferation. Under in vivo conditions, using clonal cell lines overexpressing OGFr, that were injected either by the subcutaneous or intraperitoneal routes, an increase in the latency to the development of ovarian tumors was observed, as well as markedly decreased tumor volumes, numbers, and weights. Moreover, the increase in OGFr that attenuated tumorigenesis was related to a reduction in DNA synthesis but not to alteration in cell survival. These results demonstrate the critical nature of the OGF-OGFr axis in the onset and progression of human ovarian cancer, and may important in the design of treatment strategies for this deadly disease.
2. Material and Methods
2.1. Cell Culture
The human ovarian cancer cell line, SKOV-3 [30], was obtained from the American Type Culture Collection (Manassas, VA), and grown in a humidified atmosphere of 5% CO2/95% air at 37˚C in RPMI medium containing 1.5 mM L-glutamine, 2.2 g/l sodium bicarbonate, 10% fetal calf serum, and antibiotics (5,000 units/ml penicillin, 5 µg/ml streptomycin, and 10 mg/ml neomycin). This cell line was selected for study because of our previous evidence that the OGF-OGFr axis is present and modulates growth [11], as well as the fact that these cells grow robustly in nude mice.
2.2. Transfection and Clonal Selection
SKOV-3 cells were transfected with pcDNA3.1+ vector (empty vector, EV) or with the plasmid pcDNA3.1+ human OGFr in the presence of lipofectamine 2000 (Invitrogen, Carlsbad, CA) for 4 h in serum and antibiotic free media. At 4 h, cultures were supplemented with serum containing media. At 24 h, transfection reagents were removed and replaced with serum containing media. Transfected cells were selected by growth in media containing G418 at 500 µg/ml; 24 clones were expanded and analyzed by Western blotting. Based on OGFr expression, 5 clones (OGFr-3, OGFr-13, OGFr-15, OGFr-21, and OGFr-22) were maintained and further characterized by semiquantitative immunohistochemistry, Western blot, receptor binding assays, and growth. For all experiments, untransfected wild-type (WT) cells and EV transfected clones served as controls.
2.3. Cell Growth
Clonal cells, as well as WT and EV cells, were plated and counted 24 h later (time 0) to determine seeding efficiency. For treatment studies, 10–6 M OGF or naltrexone (NTX) (Sigma Aldrich, St. Louis, MO) was added at time 0; media and compounds were replaced daily. Drugs were prepared in sterile water and dilutions represent final concentrations of the compounds. An equivalent volume of sterile water was added to controls. At designated times, cells were harvested, stained with trypan blue, and counted with a hemacytometer. At least two aliquots/well from at least 2 wells/treatment/timepoint were sampled.
2.4. Animals
Four week-old athymic nu/nu female mice, purchased from Charles River Laboratory (Wilmington, MA), were housed in pathogen-free isolator ventilated cages in a controlled-temperature room (22˚C - 25˚C) with a 12 - 12 h light/dark cycle (lights on 0700 - 1900) in the Department of Comparative Medicine at The Pennsylvania State University College of Medicine. Sterile water and standard rodent diet (Harlan Teklad, Fredrick, MD) were available ad libitum. All procedures were approved by the IACUC committee of The Pennsylvania State University College of Medicine, and conformed to the guidelines established by the NIH. Mice were allowed 48 h to acclimate prior to experimentation.
2.5. Tumor Cell Implantation
Clonal cell lines stably overexpressing OGFr, OGFr-3, and OGFr-22, as well as EV and WT cells, were expanded and analyzed by receptor binding to determine the binding capacity of OGFr prior to inoculation into nude mice. For the subcutaneous xenograft model, 4 × 10⁶ cells of four different lines (WT, EV, OGFr-3, or OGFr-22) were injected into the right scapula region of unanaesthetized mice; 12 mice per cell line were used. For the intraperitoneal xenograft model, unanaesthetized mice were injected with 5 × 10⁶ EV, OGFr-3, or OGFr- 22 cells; 8 - 12 mice were inoculated with each cell line. These concentrations were selected based on published reports [31-34] as well as preliminary tumor burden studies (Donahue et al., unpublished observations).
2.6. Tumor Growth and Termination Day Measurements
Mice with subcutaneous xenografts were weighed weekly and observed daily for initial appearance of a visible tumor. The latency for a visible tumor and the time until tumors were measurable (≥ 62.5 mm3) were recorded. Tumors were measured in two dimensions with vernier calipers 3 times/week. Volume was calculated using the formula l × w2 × π/6, where length (l) is the longest dimension, and width (w) is the dimension perpendicular to the length [35]. Mice with intraperitoneal xenografts were weighed 3 times/week and their abdomens examined for distension throughout the study.
Mice were euthanized 32 and 40 days following subcutaneous or intraperitoneal tumor cell inoculation, respectively, by an overdose of sodium pentobarbital (100 mg/kg) and cervical dislocation. To examine DNA synthesis in tumors, a subset of mice from each group was injected intraperitoneally with BrdU (100 mg/kg) at 6 and 3 h prior to euthanization. Mice with subcutaneous xenografts were weighed, tumors and spleens were removed and weighed, and the lymph nodes, liver, and spleen were examined for metastases. Tumors were processed for immunohistochemistry, BrdU, hematoxylin and eosin, and TUNEL analysis. Mice with intraperitoneal xenografts were weighed and the number of tumor nodules on the surfaces of the liver, stomach, spleen, and intestines were recorded, removed, and weighed.
2.7. Semiquantitative Immunohistochemistry
Semiquantitative immunohistochemistry was utilized to evaluate the presence and relative levels of OGF and OGFr in cells and tumor tissue according to Donahue et al. [11]. Polyclonal antibodies to OGF and OGFr were generated in the laboratory and have been fully characterized [36]. To evaluate the relative expression of OGF and OGFr, images were taken at the same exposure time with care not to photobleach samples. For cells, the mean intensity of staining (mean gray value) was determined for at least 100 cells/group, and at least 3 coverslips/ group. For tumors, at least 10 fields/section from the periphery of 2 sections/tumor, and 3 tumors/group were assessed. Controls included preparations incubated with secondary antibodies only.
2.8. Protein Isolation and Western Blotting
Expression of OGFr was evaluated in clonal lines by Western blot according to published procedures [11]. Briefly, cells were harvested, solubilized in RIPA buffer (PBS, 10 μM IGEPAL, 1 mg/ml SDS) containing protease and phosphatase inhibitors (Roche, Indianapolis, IN), sheared with a 25 G needle, and total protein concentrations measured using the DC protein assay kit (Bio-Rad Laboratories, Hercules, CA). Proteins (60 μg) were subjected to 15% SDS-PAGE and transferred to nitrocellulose. Membranes were probed with anti-OGFr (1:200) or β-actin (1:5000, Sigma Aldrich) antibodies followed by appropriate secondary horseradish peroxidase conjugated antibodies (1:5000, GE Healthcare-Amersham Biosciences, Piscataway, NJ). The optical density of each band was determined by densitometry (QuickOne, Bio-Rad Laboratories), and each value was normalized to β-actin from the same blot. The percent change in expression was calculated by dividing the normalized value of experimental samples by that of WT samples. Means and SE were determined from at least 2 independent experiments.
2.9. OGFr Binding Assays
Log phase cells were assayed for OGFr using custom synthesized [3H]-[Met5]-enkephalin (Perkin Elmer-New England Nuclear; 52.7 Ci/mmol) following procedures by Donahue et al. [11]. Non-specific binding was measured in the presence of unlabeled [Met5]-enkephalin. Saturation binding isotherms were generated using GraphPad Prism (La Jolla, CA), and independent assays were performed in duplicate at least 3 times.
2.10. Mechanisms of Modulated Growth: DNA Synthesis, Apoptosis, and Necrosis
The effect of overexpressing OGFr on DNA synthesis, apoptosis, and necrosis was assessed in cells. Tumor tissue was evaluated for DNA synthesis and apoptosis. Cells (5 × 10⁴/coverglass) were grown in culture for 72 h, pulsed with BrdU (30 μM, Sigma Aldrich) for 3 h, and fixed in formalin. Tumors from mice receiving BrdU were fixed in formalin overnight, processed in paraffin, and sectioned at 10 µm. Cells or tissue was stained with anti-BrdU antibody (1:200, Invitrogen) to assess DNA synthesis [11,23,24], or processed for TUNEL according to the manufacturer’s instruction (Trevigen, Gaithersburg, MD) to measure apoptosis [11]. For cells, the percentage of BrdU or TUNEL positive cells was determined for at least 500 cells/group and at least 2 coverslips/group. For tumors, the percentage and number of BrdU and TUNEL positive cells, respectively, were determined from at least 10 random fields around the periphery of each tumor, with 2 sections/tumor, and 2 tumors/treatment group evaluated. Necrosis was assessed in cells by trypan blue staining in all growth experiments.
2.11. Histological Staining
Staining with hematoxylin and eosin was performed on tumor tissue to examine endothelial lined vessels containing red blood cells [37,38]. Blood vessel density was determined from at least 10 random fields around the periphery of each tumor, with 2 sections/tumor, and 2 tumors/treatment group evaluated.
2.12. Statistical Analyses
Tumor incidence was analyzed using the Chi square test; all other data were analyzed using one-way analysis of variance (ANOVA) with subsequent comparisons made using Newman-Keuls tests (GraphPad Prism). In some cases, data were evaluated using unpaired t-tests. P values < 0.05 were considered to be significant.
3. Results
3.1. Establishment and Characterization of OGFr Clonal Cell Lines
To study the effects of amplification of OGFr on the growth of ovarian cancer cells, SKOV-3 cells were stably transfected with an OGFr expression vector; 24 neomycin-resistant clones were initially characterized by Western blot (data not shown). Five clones with varying levels of OGFr expression as compared to the WT and EV cultures were expanded and further characterized by semiquantitative immunohistochemistry, Western blot, OGF receptor binding, and growth (Figures 1 and 2). For all studies, comparisons were made to WT and EV groups.
3.2. OGFr Is Present and Overexpressed in Clonal Cell Lines
For all cultures, OGFr was visible in the cytoplasm and a speckling of immunoreactivity often noted in cell nuclei (Figure 1(a)). Cells processed with secondary antibody only showed no staining (Figure 1(a)). Semiquantitative immunohistochemistry revealed a marked increase in OGFr immunofluorescence (mean gray value) in clonal cell lines OGFr-3 (213%), OGFr-13 (158%), OGFr-15 (62%), OGFr-21 (245%) and OGFr-22 (87%) relative to WT cells (Figure 1(b)). Western blot analysis revealed that the 62-kDa band of OGFr, standardized for loading with actin, was increased 77% - 117% in clones overexpressing OGFr relative to WT cells (Figure 1(c)). No differences were noted between WT and EV cells by Western blotting or semiquantitative immunohistochemistry.
3.3. Overexpression of OGFr Upregulates Receptor Binding Capacity
To further characterize OGFr overexpressing cell lines, binding capacity (Bmax) and binding affinity (Kd) of OGFr for radiolabeled [Met5]-enkephalin was determined. Specific and saturable binding was identified in the nuclear fraction of all cell lines. Bmax values for clonal cells were markedly increased compared to those of WT (3.84 ± 0.21) and EV (3.45 ± 0.29) groups, with increases ranging from 51% - 154% in cells with amplified OGFr (Figure 1(d)). Binding affinity did not differ between WT, EV, and clonal cell lines (data not shown).
3.4. Overexpression of OGFr Downregulates Cancer Cell Proliferation
The functional repercussions of overexpressing OGFr were determined by evaluating cell growth. Cell number was significantly decreased 36% - 85% over a 120 h period in clonal lines overexpressing OGFr compared to EV and WT controls (Figure 2(a)). Calculation of doubling times (Figure 2(b)) revealed significant increases in OGFr-3 (121%), OGFr-13 (48%), OGFr-15 (41%), OGFr-21 (80%), and OGFr-22 (177%) cell lines relative to WT and EV control levels. Doubling times between WT and EV groups were comparable (~34 h).


Figure 1. The expression and distribution of OGFr in SKOV-3 cells transfected with an OGFr expression vector. (a) Photomicrographs of untransfected wild-type cells (WT), cells transfected with an empty vector (EV), or clonal cell lines overexpressing OGFr, stained with anti-OGFr antibody (1:200), and taken at the same exposure time. Rhodamine conjugated IgG (1:1000, red) served as the secondary antibody, and nuclei are visualized with DAPI (blue). Preparations incubated with secondary antibodies only (inset). Bar = 10 µm. (b) Semiquantitative measurement of OGFr staining intensity (mean gray value) from at least 100 cells/group and 3 coverslips/group. (c) Western blot and densitometric analysis of OGFr normalized to β- actin from 2 independent experiments. (d) Saturation isotherms calculating binding capacity (Bmax) of radiolabeled OGF from at least 3 independent assays performed in duplicate. Data for all experiments represent means ± SE. Significantly different from WT at *p < 0.05, **p < 0.01, or ***0.001.


Figure 2. Clones overexpressing OGFr are decreased in cell proliferation and can be modulated by OGF and NTX. (a) Growth curves of clonal cell lines, as well as WT and EV cells, from at least 2 aliquots/well and 2 wells/timepoint/cell line. (b) Doubling times of cells calculated from at least 2 growth curves/cell line and analyzed by linear regression. (c) The growth effects of exogenous OGF (10–6 M), NTX (10–6 M), or an equivalent volume of sterile water (basal level) on WT, EV, and clonal cell lines. Compounds and media were replaced daily. (d) Quantification of DNA synthesis (% BrdU incorporation) in WT, EV, and clonal cell lines for at least 10 fields/coverslip and at least 2 coverslips/cell line. Values for (a), (b), and (d) represent means ± SE; significantly different from WT at *p < 0.05, **p < 0.01, and ***p < 0.001. Values for (c) are expressed as % growth inhibition or stimulation compared to WT basal levels.
3.5. Exogenous OGF Decreases Cell Number in Cultures Overexpressing OGFr
In earlier studies the addition of exogenous OGF to ovarian cancer cultures depressed cell number [11,21], leading to the prediction that exogenous OGF introduced to cells with amplification of OGFr would result in an exaggerated inhibitory response. Under standard growth conditions, the basal number of cells in cultures overexpressing OGFr was reduced 70% - 85% compared to WT and EV cultures (Figure 2(c)) as expressed by the percentage in growth inhibition. The addition of exogenous OGF (10–6 M) to clonal cell lines depressed cell number an additional 19% - 34% compared to their respective basal levels at 120 h. Summation of the basal growth inhibition plus growth inhibition induced by exogenous OGF at 120 h revealed a total growth inhibition of the OGFr overexpressing clones that was 2.5- to 4.6-fold greater than that for the WT and EV groups, which had 20% - 24% reductions in cell number with exogenous OGF administration.
3.6. NTX Increases Cell Number in Cells Overexpressing OGFr
To understand the effects of opioid receptor blockade with a potent and long-acting opioid receptor antagonist on cells with an abundance of OGFr, 10–6 M NTX was added to the cultures (Figure 2(c)). Clonal cell lines, as well as WT and EV cells, subjected to NTX exhibited an increase in cell number compared to basal levels as expressed by percentage of growth stimulation. However, the magnitude of increase in cell number was 2.0- to 3.6- fold greater in clonal cell lines with molecular amplification of OGFr and exposed to NTX than in WT or EV cultures receiving NTX.
3.7. OGFr Overexpression Decreases DNA Synthesis without Altering Cell Survival
To evaluate the mechanism by which an excess of OGFr decreases ovarian cancer cell number, DNA synthesis and cell survival were evaluated. In comparison to the BrdU labeling index of WT (26%) and EV (25%) cultures, the labeling index in clonal cell lines overexpressing OGFr was decreased 59% - 68% (Figure 2(d)). Examination of apoptosis (TUNEL) or necrosis (trypan blue) revealed less than 0.1% positive apoptotic or necrotic cells, and these data were comparable for all groups regardless of OGFr expression (data not shown).
3.8. OGF Is Present but Expression Levels Are Unchanged in Clonal Cell Lines
To examine OGF levels in cultures overexpressing OGFr, semiquantitative immunohistochemistry for OGF was performed. OGF was visible in the cytoplasm with a speckling of immunoreactivity often noted in cell nuclei (Figure 3(a)). Cells processed with secondary antibody only showed no staining (Figure 3(a)). OGF levels as detected by semiquantitative immunofluorescence (mean gray value) were comparable between OGFr-overexpressing cell lines and WT and EV cells (Figure 3(b)).
3.9. Overexpression of OGFr in Subcutaneous Xenografts Reduces Tumor Incidence, Retards Tumor Appearance, and Decreases Tumor Volume
Measurable tumors (i.e., >62 mm3) began to form 4 days following tumor cell inoculation in mice receiving WT or EV cells. One day later, when 90% and 100% of mice inoculated with WT and EV cells, respectively, had measurable tumors, 0% of mice inoculated with OGFr-3 or OGFr-22 cells had measurable tumors (Figure 4(a)).

Figure 3. The expression and distribution of OGF in SKOV-3 cells transfected with an OGFr expression vector. (a) Photomicrographs taken at the same exposure time of untransfected wild-type cells (WT), cells transfected with an empty vector (EV), or clonal cell lines stained with anti-OGF antibody (1:200). Rhodamine conjugated IgG (1:1000, red) served as the secondary antibody, and nuclei are visualized with DAPI (blue). Preparations incubated with secondary antibodies only (inset). Bar = 10 mm. (b) Semiquantitative measurement of OGF staining intensity (mean gray value) from at least 100 cells/group and at least 3 coverslips/group. Data represent means ± SE.
By days 10 and 20, when 100% of mice in the WT and EV groups had measurable tumors, only 10% and 30%, respectively, of mice receiving OGFr-3 cells, and 50% and 80%, respectively, of mice administered OGFr-22 cells, had measurable tumors. By the end of the study (day 32), 40% of mice inoculated with OGFr-3 cells and 90% of mice receiving OGFr-22 cells displayed measurable tumors. An evaluation of the latency to development of measurable tumors revealed latencies of 4.33 ± 0.17 and 4.30 ± 0.15 days for mice administered WT or EV cells, respectively (Figure 4(b)). Animals inoculated with clones OGFr-3 or OGFr-22 that developed measurable tumors had latencies that were 12 and 4 days longer, respectively, than mice inoculated with WT or EV cells. No differences in incidence or latency to form a measurable tumor were detected between WT and EV groups.
Of mice that developed measurable tumors, tumor volumes were decreased 28% - 87% in mice injected with OGFr-3 cells, and reduced 19% - 78% in mice inoculated with OGFr-22 cells, beginning on days 11 and 6, respectively; these measurements persisted throughout the duration of the study compared to WT and EV controls (Figure 4(c)). Comparable tumor volumes were noted in mice receiving WT or EV cells with the exception of day 11.
3.10. Overexpression of OGFr in Subcutaneous or Intraperitoneal Xenografts Decreases Terminal Tumor Measurements without Affecting Terminal Spleen or Animal Weights
Compared to WT and EV controls on the day of termination (day 32), mice inoculated subcutaneously with clones overexpressing OGFr and developing measurable tumors displayed a visible reduction in tumor size (Figure 5(a)). Terminal tumor volume and tumor weights were decreased 78% - 99% in mice injected with OGFr-3 or OGFr-22 cells compared to WT and EV controls (Figures 5(b) and (c)).
In the intraperitoneal xenograft model, mice inoculated with clones overexpressing OGFr (OGFr-3 or OGFr-22) displayed a 95% and 65% reduction, respectively, in the total number of tumor nodules compared to EV controls at the end of the 40 day study and ((Figures 5(d) and (e)), reflecting changes in the number of nodules identified on the liver, intestines and stomach. With respect to tumor nodules detected on the spleen, comparable numbers were noted in mice inoculated with OGFr-22 and EV cells; however, there were no nodules the spleen noted in mice inoculated with OGFr-3 cells (Figure 5(e)).
Total tumor weights in mice receiving intraperitoneal injections of OGFr-3 and OGFr-22 cells were reduced 99% and 69%, respectively, relative to EV controls (Figure 5(f)). Animal and spleen weights were comparable in mice injected either subcutaneously or intraperitoneally with OGFr overexpressing clones relative to mice inoculated with WT or EV cells (data not shown).
3.11. OGFr Overexpression Inhibits DNA Synthesis in Xenografts without Affecting Cell Survival
Examination of late stage apoptosis in tumors by TUNEL assay revealed similar levels of cell death in mice inoculated with WT, EV, OGFr-3, or OGFr-22 cells (Figures 6(a) and (b)). With respect to DNA synthesis, comparable rates were noted in tumors from mice receiving WT (31.9 ± 1.2) or EV (30.6 ± 1.5) cells. However, DNA synthesis was reduced in tumors from mice in the OGFr- 3 and OGFr-22 groups by 78% and 67%, respectively, compared to WT controls (Figures 6(c) and (d)).
3.12. OGF and OGFr Expression in Xenografts from Mice Administered Cell with an Excess of OGFr
To investigate the distribution and expression of OGFr and OGF in tumors, semiquantitative immunohistochemistry was performed. The location of OGFr was similar in tumors from all groups of mice, with immunoreactivity for this receptor detected in the cytoplasm and a speckling of immunoreactivity noted in cell nuclei (Figure 7(a)). Photodensitometric measurements revealed that OGFr expression was increased 112% - 146% in mice inoculated with OGFr-3 or OGFr-22 cells, compared to WT and EV controls (Figure 7(b)). The location of OGF in ovarian tumors was similar in all groups of mice, with immunoreactivity detected in the cytoplasm and a speckling often noted in cell nuclei (Figure 7(c)). Photodensitometric measurements revealed that OGF expression was unchanged in tumors from mice inoculated with cells having an abundance of OGFr compared to WT and EV controls (Figure 7(d)).
3.13. Tumor Angiogenesis is Reduced in Xenografts Overexpressing OGFr
Relative to tumor vessel density in mice inoculated with WT or EV cells, vessel density was reduced 86% and 65% in mice injected with OGFr-3 or OGFr-22 cells, respectively (Figures 7(e) and (f)).
4. Discussion
This study is the first to report the stable molecular overexpression of OGFr in a human ovarian cancer cell line, and reveals that upregulation of OGFr markedly inhibits the proliferation of cells in vitro and tumorigenesis in vivo. In tissue culture, ovarian cancer cells engineered to have an overexpression of OGFr had decreases in cell


Figure 4. OGFr overexpression suppresses tumor progression in mice with subcutaneous xenografts of human ovarian cancer. (a) Incidence of measurable (≥62.5 mm3) tumors at 4, 5, 10, 20, and 32 days following inoculation of mice with 4 × 10⁶ WT, EV, OGFr-3, or OGFr-22 cells. (b) Latency (in days) to the development of measurable tumors. (c) Measurement of tumor volume (mm3) over time in mice developing measurable tumors. Values represent means ± SE for animals developing measurable tumors. Significantly different from WT at *p < 0.05, **p < 0.01 and ***p < 0.001, and from EV at +p < 0.05, ++p < 0.01 and +++p < 0.001. NS = not significant; dash (-) = insufficient data to perform statistical analyses.
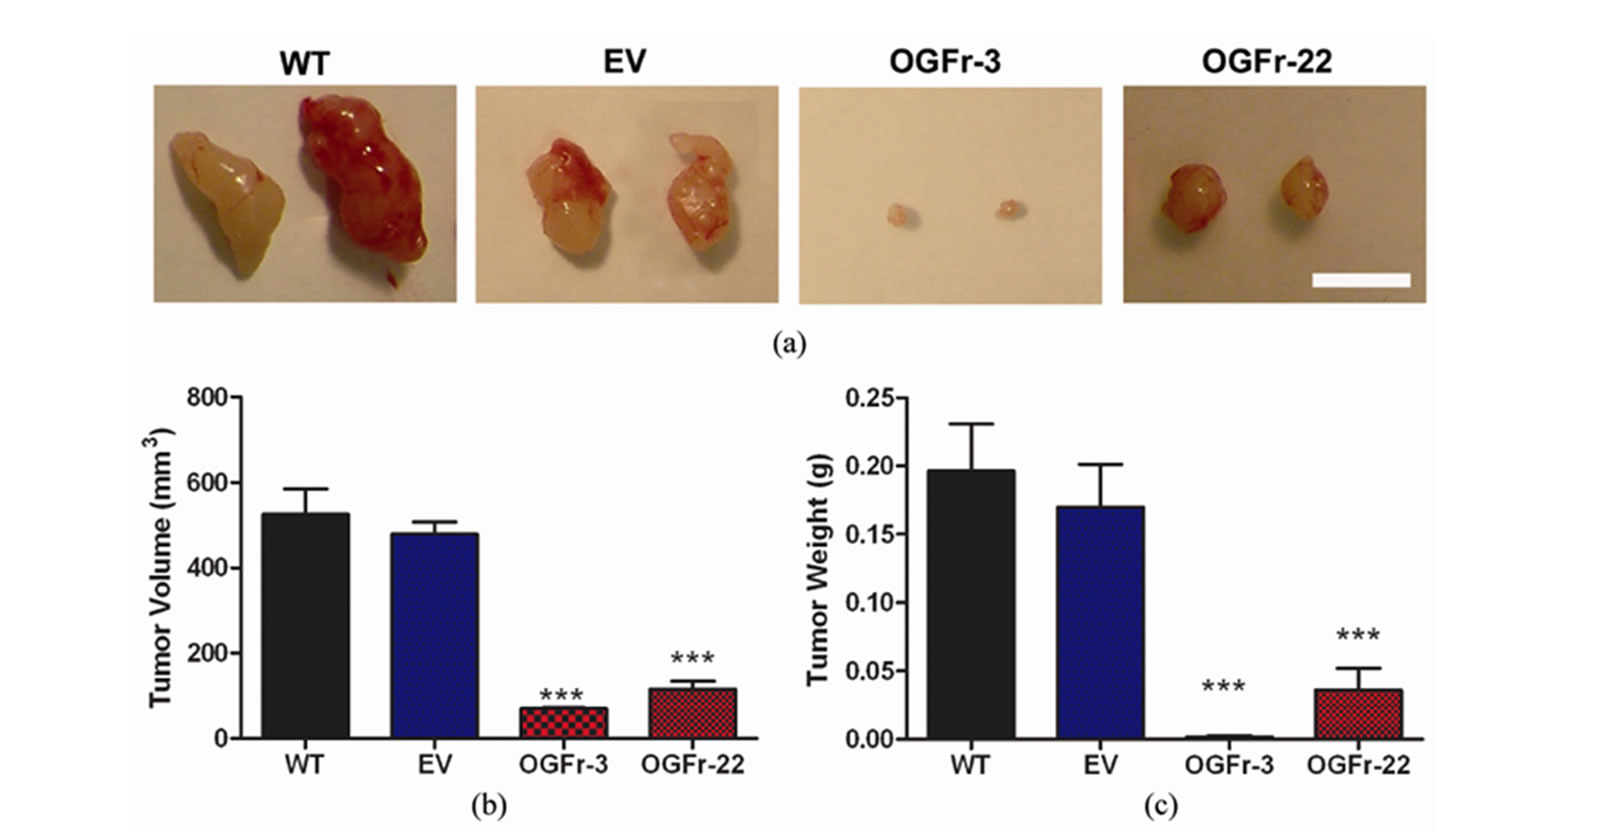


Figure 5. Terminal measurements recorded in mice with subcutaneous or intraperitoneal xenografts of human ovarian cancer. (a) Representative images of tumors removed from mice 32 days following subcutaneous inoculation of 4 × 10⁶ WT, EV, OGFr-3, or OGFr-22 cells. Bar = 1 cm. (b) Terminal tumor volume (mm3) in mice developing measurable subcutaneous tumors. (c) Terminal tumor weight (g) in mice with measurable subcutaneous xenografts. (d) Representative images of the peritoneal cavity of mice 40 days following inoculation with 5 × 10⁶ EV, OGFr-3 or OGFr-22 cells. Bar = 1 cm. Arrows indicate tumors. (e) Number of tumor nodules in mice with intraperitoneal xenografts. (f) Terminal total tumor weight (g) in mice with intraperitoneal xenografts. Values represent means ± SE for all mice developing measurable subcutaneous tumors, and all 8 mice/group in intraperitoneal studies. Significantly different from the WT and/or EV groups by *p < 0.05 and ***p < 0.001.


Figure 6. Mechanism of tumor growth inhibition by overexpression of OGFr: Effects on apoptosis and DNA synthesis. Tumors were assessed 32 days after mice were inoculated subcutaneously with a) WT, b) EV, c) OGFr-3, or d) OGFr-22 cells. (a) Photomicrographs of TUNEL staining. Negative and positive controls included according to the manufacturer’s instruction. (b) Number of apoptotic cells per 0.003 mm2. (c) Photomicrographs of BrdU staining. (d) Quantification of the BrdU labeling. Values for (b) and (d) determined from at least 10 fields, 2 sections/mouse, and 2 mice/group. Data represent means ± SE. Significantly different from WT at ***p < 0.001. Bar = 20 mm. Arrows indicate positive staining.
number and DNA synthesis, increases in doubling time, and exhibited considerably more modulatory capability in the face of challenges with an opioid agonist (OGF) or antagonist (NTX) compared to WT or EV controls. Xenografts using the subcutaneous route with cells having an abundance of OGFr had increases from control levels in the interval to form a measurable tumor, decreases in the number of animals displaying a measurable tumor, and reductions in tumor volume and weight. With the intraperitoneal route, both the number of metastases and tumor weight were markedly reduced from WT and EV controls. In both in vitro and in vivo investigations, the effects of an excess of OGFr were maintained, indicating that there was no tolerance to the repercussions from amplification of OGFr in these cells.
Evidence of stable overexpression of OGFr in ovarian cancer cells comes from several avenues of experimentation. An increase from control levels (WT, EV) in OGFr protein was detected with semiquantitative immunohistochemistry and Western blotting. The functional capability of the overexpressed OGFr in cellular homogenates to bind to OGF was documented in receptor binding studies, wherein a significant increase from the WT and EV ovarian cancer cells in binding capacity was detected. The overexpression of OGFr in these neoplastic cells did not alter binding affinity of OGF to the receptor, indicating that the processes accompanying the translation of the excess OGFr in these cells was comparable to that in WT cells. Moreover, the binding affinity, as well as binding capacity, in EV cells also was similar to that in WT cells, denoting that the vector did not contribute to any changes in the overexpressed OGFr. Finally, the selection and characterization of multiple clonal cell lines with overexpressed OGFr insured that the outcome of the

Figure 7. Expression of OGF and OGFr, as well as blood vessel density, in tumors. Tumors were assessed 32 days after mice were inoculated subcutaneously with WT, EV, OGFr-3, or OGFr-22 cells. (a,c) Photomicrographs taken at the same exposure time of tumors stained with antibodies (1:200) to OGFr (a) or OGF (c). Rhodamine conjugated IgG (1:1000) served as the secondary antibody and nuclei are visualized with DAPI. Preparations incubated with secondary antibodies only (insets). (b,d) Semiquantitative measurement of OGFr (d) and OGF (d) staining intensity (mean gray value) from 10 fields from at least 2 sections/tumor with 3 mice/group. (e) Photomicrographs of hematoxylin and eosin staining identifying endothelial lined vessels containing red blood cells. Arrow indicates positive staining. (f), Number of blood vessels per 0.16 mm2 determined from at least 10 fields, 2 sections/mouse, and 2 mice/group. Data for all experiments represent means ± SE. Significantly different from WT at ***p < 0.001. Scale bar = 10 µm in (a) and (c) and 60 µm in (e).
transfection was a consistent rather than isolated observation. That the addition of clonal OGFr had a physiological action in cells that was of greater magnitude than in WT cells, suggests that the downstream pathways (e.g., nucleocytoplasmic transport) remained intact and accommodated the excess OGFr.
To investigate the mechanism by which OGFr overexpression inhibits cell number and tumor progression, cell survival and DNA synthesis were assessed. No changes in the number of apoptotic and/or necrotic ovarian cancer cells with molecular amplification of OGFr were discerned either in tissue culture or in xenografts when compared to WT or EV cells/tissues. Therefore, the reduction in tumor size could not be accounted partially or completely by alteration of cell survival pathways. However, DNA synthesis, both under in vitro and in vivo environments, was markedly depressed in the ovarian cancer cells with an abundance of OGFr compared to WT or EV controls. These results are entirely consistent with previous reports showing that the OGF-OGFr axis serves to maintain the pace of cell proliferation through an inhibitory cascade [7-11], with peptide-receptor interaction targeted to upregulating the cyclin dependent inhibitory kinase pathways [11-14].
The OGF-OGFr axis is known to regulate cell proliferative events with respect to the vascular system, including angiogenesis and repair of vascular injury [39- 41]. In the case of overexpression of OGFr in ovarian cancer cells, xenografts were found to have a reduction from control levels in the number of blood vessels associated with these tumors. These data would suggest that the reduction in tumor burden was correlated with a decrease in the vascular supply needed for nutrition. Thus, ovarian tumorigenesis responded to both a direct effect from an excess of OGFr (i.e., a decrease in cell proliferation), and an indirect effect on depressing angiogenesis as a consequence of smaller tumor burden.
As OGF has previously been identified as the opioid that binds to OGFr to inhibit cell proliferation in ovarian cancer [11], the question can be raised as to whether the growth inhibition seen with an abundance of OGFr could be due in part to a compensatory increase in OGF expression. A number of observations in the present study indicate that this is not the case. First, one would predict that if OGF levels increased in proportion to receptor number, then the clonal cell lines with the greatest receptor number would have the highest levels of OGF and hence, the greatest decreases in cell proliferation and tumorigenesis. The data, however, revealed that receptor number alone could not be used as a predictor of cell proliferation in vitro or tumorigenesis in mice. Placing clonal variation aside, all of the cell lines with increased OGFr were markedly inhibited in cell proliferation and tumorigenesis in contrast to controls. Finally, semiquantitative immunohistochemistry performed on cells and xenografts revealed that OGF expression was unaltered in clonal cell lines with an excess of OGFr compared to controls. Thus, it does not appear that changes in OGF expression are responsible for the observed growth alterations seen with overexpression of OGFr. Moreover, an increase in OGFr number does not signal a downregulation in the required levels of OGF.
To evaluate the total magnitude by which the OGFOGFr axis can modulate the growth of ovarian cancer cells, clonal cell lines overexpressing OGFr were treated with exogenous OGF or subjected to continuous opioid receptor blockade with NTX. Cultures exposed to OGF or NTX responded with a decrease or increase, respectively, in cell number compared to cohorts treated with vehicle. Cells overexpressing OGFr, however, displayed a greater than 2-fold enhanced response to opioid receptor antagonism, but a comparable response to exogenous OGF compared to WT or EV controls. If one totals the overall magnitude of response to OGF and NTX, growth regulation by the OGF-OGFr axis was 2.5- to 4.6-fold greater in OGFr overexpressing clones than in WT or EV cultures. Thus, the OGF-OGFr axis has a considerable range of modulatory capability in human ovarian cancer cells.
The present observations on the effects of an abundance of OGFr in ovarian cancer cells with regard to cell proliferation and tumorigenesis complement previous reports on the repercussions of molecular manipulation of OGFr. Earlier studies have shown that transient transfection of OGFr cDNA into rat corneal epithelial cells using a gene gun depressed DNA synthesis [42] and wound healing [43]. Additionally, similar to reports in squamous cell carcinoma of the head and neck [24,44] and pancreatic cancer [23,45], the present study demonstrates that stable transfection of OGFr cDNA markedly suppressed neoplastic events under both in vitro and in vivo conditions. These data reflect the fundamental nature and biological significance of the OGF-OGFr axis in human ovarian cancer.
Clinically, OGF has been detected by radioimmunoassay in surgical samples taken from human neoplasms of the ovary [26]. The demonstration in the present study that tumor progression is inhibited in mice transplanted with human ovarian cancer cells overexpressing OGFr indicates that the OGF-OGFr axis is functional in ovarian cancer in vivo. The basal equilibrium of cell replication, which is regulated by endogenous OGF and mediated by OGFr, is disturbed by an abundance of OGFr, with the net result being an overall reduction in cell proliferation. Given that ovarian cancer is the most lethal gynecologic malignancy [4], and that the survival rate for this neoplasia has not improved substantially in decades [3], new strategies to treat this deadly cancer are needed. The findings of this study can be used clinically in designing treatments that capitalize on the body’s own processes to restore homeostasis in cell proliferation of ovarian cancer. For example, one could upregulate either the peptide (e.g. by exogenous OGF) and/or receptor (e.g. by gene delivery, imiquimod) to enhance anticancer activity. Indeed, OGF has been successfully documented to be safe for administration in humans [46] and efficacious in a phase II trial with OGF in pancreatic cancer patients [47], and imiquimod is widely used clinically in the treatment of certain diseases of the skin [48,49].
The present investigation provides insight into the molecular mechanisms of the OGF-OGFr axis as an integral component controlling ovarian cancer cell proliferation and tumorigenesis, and provides evidence that this system can be exaggerated in ovarian cancer to depress the progression of disease. The findings in this study have clinical importance in designing treatment modalities that take advantage of this biological inhibitory axis.
5. Acknowledgements
We are grateful for the support by the Paul K. and Anna E. Shockey Family, Bonnie and Ken Shockey, and the Zagon/Kostel families. The authors declare that they have no competing interests.
REFERENCES
- A. Jemal, R. Siegel, E. Ward, Y. Hao, J. Xu and M. J. Thun, “Cancer Statistics, 2010,” CA: A Cancer Journal for Clinicians, Vol. 60, No. 5, 2010, pp. 277-300.
- I. Boger-Megiddo and N. S. Weiss, “Histologic Subtypes and Laterality of Primary Ovarian Tumors,” Gynecologic Oncology, Vol. 97, No. 1, 2005, pp. 80-83. doi:10.1016%2Fj.ygyno.2004.11.054
- N. Chobanian and C. S. Dietrick, “Ovarian Cancer,” Surgical Clinics of North America, Vol. 88, No. 2, 2008, pp. 285-299.
- P. Dinh, P. Harnett, M. J. Piccart-Gebhart and A. Awada, “New Therapies for Ovarian Cancer: Cytotoxics and Molecularly Targeted Agents,” Critical Reviews in Oncology/Hematology, Vol. 67, No. 2, 2008, pp. 103-112.
- E. J. Nam and Y. T. Kim, “Alteration of Cell-Cycle Regulation in Epithelial Ovarian Cancer,” International Journal of Gynecological Cancer, Vol. 18, No. 6, 2008, pp. 1169-1182. doi:10.1111% 2Fj.1525-1438.2008.01191.x
- I. S. Zagon, M. F. Verderame and P. J. McLaughlin, “The Biology of the Opioid Growth Factor Receptor (OGFr),” Brain Research Reviews, Vol. 38, No. 3, 2002, pp. 351- 376.
- P. J. McLaughlin, R. J. Levin and I. S. Zagon, “Regulation of Human Head and Neck Squamous Cell Carcinoma Growth in Tissue Culture by Opioid Growth Factor,” International Journal of Oncology, Vol. 14, No. 5, 1999, pp. 991-998.
- I. S. Zagon, J. P. Smith and P. J. McLaughlin, “Human Pancreatic Cancer Cell Proliferation in Tissue Culture Is Tonically Inhibited by Opioid Growth Factor,” International Journal of Oncology, Vol. 14, No. 3, 1999, pp. 577-584.
- I. S. Zagon, S. D. Hytrek and P. J. McLaughlin, “Opioid Growth Factor Tonically Inhibits Human Colon Cancer Cell Proliferation in Tissue Culture,” American Journal of Physiology, Vol. 271, No. 3, Part 2, 1996, pp. R511- R518.
- G. J. Bisignani, P. J. McLaughlin, S. D. Ordille, M. J. Jarowenko and I. S. Zagon, “Human Renal Cell Proliferation in Tissue Culture Is Tonically Inhibited by Opioid Growth Factor,” Journal of Urology, Vol. 162, No. 6, 1999, pp. 2186-2191.
- R. N. Donahue, P. J. McLaughlin and I. S. Zagon, “Cell Proliferation of Human Ovarian Cancer Is Regulated by the Opioid Growth Factor—Opioid Growth Factor Receptor Axis,” American Journal of Physiology-Regulatory Integrative and Comparative Physiology, Vol. 296, No. 6, 2009, pp. R1716-R1725.
- F. Cheng, I. S. Zagon, M. F. Verderame and P. J. McLaughlin, “The OGF-OGFr Axis Utilizes the p16 Pathway to Inhibit Progression of Human Squamous Cell Carcinoma of the Head and Neck,” Cancer Research, Vol. 67, No. 21, 2007, pp. 10511-10518. doi:10.1158%2F0008-5472.CAN-07-1922
- F. Cheng, P. J. McLaughlin, M. F. Verderame and I. S. Zagon, “The OGF-OGFr Axis Utilizes the p21 Pathway to Restrict Progression of Human Pancreatic Cancer,” Molecular Cancer, Vol. 7, No. 5, 2008.
- F. Cheng, P. J. McLaughlin, M. F. Verderame and I. S. Zagon, “The OGF-OGFr Axis Utilizes the p16INK4a and p21WAF1/CIP1 Pathways to Restrict Normal Cell Proliferation,” Molecular Biology of the Cell, Vol. 20, No. 1, 2009, pp. 319-327. doi:10.1091%2Fmbc.E08-07-0681
- I. S. Zagon and P. J. McLaughlin, “Opioids and the Apoptotic Pathway in Human Cancer Cells,” Neuropeptides, Vol. 37, No. 2, 2003, pp. 79-88. doi:10.1016%2FS0143-4179%2803%2900007-6
- I. S. Zagon, M. F. Verderame, S. S. Allen and P. J. McLaughlin, “Cloning, Sequencing, Chromosomal Location and Function of a cDNA Encoding The Opioid Growth Factor Receptor (OGFr) in Humans,” Brain Research, Vol. 856, No. 1-2, 2000, pp. 75-83. doi:10.1016%2FS0006-8993%2899%2902330-6
- F. Cheng, P. J. McLaughlin, M. F. Verderame and I. S. Zagon, “Dependence on Nuclear Localization Signals of the Opioid Growth Factor Receptor in the Regulation of Cell Proliferation,” Experimental Biology and Medicine, Vol. 234, No. 5, 2009, pp. 532-541. doi:10.3181%2F0901-RM-16
- I. S. Zagon, T. B. Ruth, A. E. Leure-duPree, J. W. Sassani and P. J. McLaughlin, “Immunoelectron Microscopic Localization of the Opioid Growth Factor Receptor (OGFr) and OGF in the Cornea,” Brain Research, Vol. 967, No. 1-2, 2003, pp. 37-47. doi:10.1016%2FS0006-8993%2802%2904172-0
- I. S. Zagon, T. B. Ruth and P. J. McLaughlin, “Nucleocytoplasmic Distribution of Opioid Growth Factor (OGF) and Its Receptor (OGFr) in Tongue Epithelium,” The Anatomical Record Part A: Discoveries in Molecular, Cellular and Evolutionary Biology, Vol. 282, No. 1-2, 2005, pp. 24-37.
- F. Cheng, P. J. McLaughlin and I. S. Zagon, “Regulation of Cell Proliferation by the Opioid Growth Factor Is Dependent on Karyopherin β and Ran for Nucleocytoplasmic Trafficking,” Experimental Biology and Medicine, Vol. 235, No. 9, 2010, pp. 1093-1101. doi:10.1258%2Febm.2010.010139
- I. S. Zagon, R. N. Donahue and P. J. McLaughlin, “Opioid Growth Factor—Opioid Growth Factor Receptor Axis Is a Physiological Determinant on Cell Proliferation in Diverse Human Cancers,” American Journal of Physiology—Regulatory Integrative and Comparative Physiology, Vol. 297, No. 4, 2009, pp. R1154-R1161.
- I. S. Zagon, R. N. Donahue, M. Rogosnitzky and P. J. McLaughlin, “Imiquimod Upregulates the Opioid Growth Factor Receptor to Inhibit Cell Proliferation Independent of Immune Function,” Experimental Biology and Medicine, Vol. 233, No. 8, 2008, pp. 968-979. doi:10.3181%2F0802-RM-58
- I. S. Zagon, M. F. Verderame, J. L. Hankins and P. J. McLaughlin, “Overexpression of the Opioid Growth Factor Receptor Potentiates Growth Inhibition in Human Pancreatic Cancer Cells,” International Journal of Oncology, Vol. 30, No. 4, 2007, pp. 775-783.
- P. J. McLaughlin, M. F. Verderame, J. L. Hankins and I. S. Zagon, “Overexpression of the Opioid Growth Factor Receptor Downregulates Cell Proliferation of Human Squamous Carcinoma Cells of the Head and Neck,” International Journal of Molecular Medicine, Vol. 19, No. 3, 2007, pp. 421-428.
- B. Sporrong, S. Falkmer, S. J. Robboy, J. Alumets, R. Håkanson, O. Ljungberg and F. Sundler, “Neurohormonal Peptides in Ovarian Carcinoids: An Immunohistochemical Study of 81 Primary Carcinoids and of Intraovarian Metastases from Six Mid-Gut Carcinoids,” Cancer, Vol. 49, No. 1, 1982, pp. 68-74. doi:10.1002%2F1097-0142%2819820101%2949%3A1%3C68%3A%3AAID-CNCR2820490115%3E3.0.CO%3B2-%23
- I. S. Zagon, P. J. McLaughlin, S. R. Goodman and R. E. Rhodes, “Opioid Receptors and Endogenous Opioids in Diverse Human and Animal Cancers,” Journal of the National Cancer Institute, Vol. 79, No. 5, 1987, pp. 1059- 1065.
- Y. Kikuchi, T. Kita, M.Miyauchi, I. Iwano and K. Kato, “Inhibition of Human Ovarian Cancer Cell Proliferation in Vitro by Neuroendocrine Hormones,” Gynecologic Oncology, Vol. 32, No. 1, 1989, pp. 60-64. doi:10.1016%2F0090-8258%2889%2990851-2
- Y. Kikuchi, T. Kita and I. Nagata, “Effects of Opioid Peptides on the Cellular Immunity in Spleen Cells from Intact Nude Mice or Nude Mice Bearing Human Ovarian Carcinoma,” Cancer Immunology and Immunotherapy, Vol. 30, No. 6, 1990, pp. 374-376. doi:10.1007% 2FBF01786888
- J. A. Mollick, F. S. Hodi, R. J. Soiffer, L. M. Nadler and G. Dranoff, “MUC1-Like Tandem Repeat Proteins Are Broadly Immunogenic in Cancer Patients,” Cancer Immunology, Vol. 3, No. 3, 2003.
- J. Fogh and G. Trempe, “New Human Tumor Cell Lines,” In: J. Fogh, Ed., Human Tumor Cells in Vitro, Plenum Publishing Corp., New York, 1975, pp. 115-159.
- H. Devalapally, Z. Duan, M. V. Seiden and M. M. Amiji, “Paclitaxel and Ceramide Co-Administration in Biodegradable Polymeric Nanoparticulate Delivery System to Overcome Drug Resistance in Ovarian Cancer,” International Journal of Cancer, Vol. 121, No. 8, 2007, pp. 1830- 1838.
- H. Devalapally, D. Shenoy, S. Little, R. Langer and M. Amiji, “Poly (Ethylene Oxide)-Modified Poly (Beta-Amino Ester) Nanoparticles as a pH-Sensitive System for TumorTargeted Delivery of Hydrophobic Drugs: Part 3. Therapeutic Efficacy and Safety Studies in Ovarian Cancer Xenograft Model,” Cancer Chemotherapy and Pharmacology, Vol. 59, No. 4, 2007, pp. 477-484. doi:10. 1007%2Fs00280-006-0287-5
- E. Lundberg, I. Höidén-Guthenberg, B. Larsson, M. Uhlén and T. Gräslund, “Site-Specifically Conjugated Anti-HER2 Affibody Molecules as One-Step Reagents for Target Expression Analyses on Cells and Xenograft Samples,” Journal of Immunological Methods, Vol. 319, No. 1-2, 2007, pp. 53-63. doi:10.1016% 2Fj.jim.2006.10.013
- T. Tran, T. Engfeldt, A. Orlova, C. Widström, A. Bruskin, V. Tolmachev and A. E.Karlström, “In Vivo Evaluation of Cysteine-Based Chelators for Attachment of 99mTc to Tumor-Targeting Affibody Molecules,” Bioconjugate Chemistry, Vol. 18, No. 2, 2007, pp. 549-559. doi:10.1021%2Fbc060291m
- W. S. N. Shim, M. Teh, P. O. P. Mach and R. Ge, “Inhibition of Angiopoietin-1 Expression in Tumor Cells by Antisense RNA Approach Inhibited Xenograft Tumor Growth in Immunodeficient Mice,” International Journal of Cancer, Vol. 94, No. 1, 2001, pp. 6-15.
- I. S. Zagon and P. J. McLaughlin, “Production and Characterization of Polyclonal and Monoclonal Antibodies to the Zeta (ζ) Opioid Receptor,” Brain Research, Vol. 630, No. 1-2, 1993, pp. 295-302.
- A. Bandyopadhyay, F. López-Casillas, S. N. Malik, J. L. Montiel, V. Mendoza, J. Yang and L. Z. Sun, “Antitumor Activity of a Recombinant Soluble Betaglycan in Human Breast Cancer Xenograft,” Cancer Research, Vol. 62, No. 16, 2002, pp. 4690-4695.
- R. Ravi, B. Mookerjee, Z. M. Bhujwalla, C. H. Sutter, D. Artemov, Q. Zeng, L. E. Dillehay, A. Madan, G. L.Semenza and A. Bedi, “Regulation of Tumor Angiogenesis by P53-Induced Degradation of Hypoxia-Inducible Factor 1α,” Genes and Development, Vol. 14, No. 1, 2000, pp. 34-44.
- J. Blebea, J. E. Mazo, T. K. Kihara, J. H. Vu, P. J. McLaughlin, R. G. Atnip and I. S. Zagon, “Opioid Growth Factor Modulates Angiogenesis,” Journal of Vascular Surgery, Vol. 32, No. 2, 2000, pp. 364-373. doi:10.1067%2Fmva.2000.107763b
- J.Blebea, J. H. Vu, S. Assadnia, P. J. McLaughlin, R. G. Atnip and I. S. Zagon, “Differential Effects of Vascular Growth Factors on Arterial and Venous Angiogenesis,” Journal of Vascular Surgery, Vol. 35, No. 3, 2002, pp. 532-538. doi:10.1067%2Fmva.2002.120 042
- I. S. Zagon, F. M. Essis, M. F. Verderame, D. A. Healy, R. G. Atnip and P. J. McLaughlin, “Opioid Growth Factor Inhibits Intimal Hyperplasia in Balloon-Injured Rat Carotid Artery,” Journal of Vascular Surgery, Vol. 37, No. 3, 2003, pp. 636-643. doi:10.1067%2Fmva.200 3.165
- I. S. Zagon, J. W. Sassani, M. F. Verderame and P. J. McLaughlin, “Particle-Mediated Gene Transfer for OGFr cDNA Regulates Cell Proliferation of the Corneal Epithelium,” Cornea, Vol. 24, No. 5, 2005, pp. 614-619. doi:10.1097%2F01.ico.0000153561.89902.57
- I. S. Zagon, J. W. Sassani, K. J. Malefyt and P. J. McLaughlin, “Particle-Mediated Gene Transfer of OGFr cDNA Regulates Corneal Repair,” Archives of Ophthamology, Vol. 124, No. 11, 2006, pp. 1620-1624. doi:10.1001%2Farchopht.124.11. 1620
- P. J. McLaughlin, S. Kreiner, C. R. Morgan and I. S. Zagon, “Prevention and Delay in Progression of Human Squamous Cell Carcinoma of the Head and Neck in Nude Mice by Stable Overexpression of the Opioid Growth Factor Receptor,” International Journal of Oncology, Vol. 33, No. 4, 2008, pp. 751-757.
- I. S. Zagon, S. Kreiner, J. J. Heslop, A. B. Conway, C. R. Morgan and P. J. McLaughlin, “Prevention and Delay in Progression of Human Pancreatic Cancer by Stable Overexpression of the Opioid Growth Factor Receptor,” International Journal of Oncology, Vol. 33, No. 2, 2008, pp. 317-323.
- J. P. Smith, R. L. Conter, S. I. Bingaman, H. A. Harvey, D. T. Mauger, M. Demers, W. B. Stanley, P. J. McLaughlin and I. S. Zagon, “Treatment of Advanced Pancreatic Cancer with Opioid Growth Factor: Phase I,” Anti-Cancer Drugs, Vol. 15, No. 3, 2004, pp. 203-209. doi:10.1097%2F00001813-200403 000-00003
- J. P. Smith, S. I. Bingaman, D. T. Mauger, H. A. Harvey, L. M. Demers and I. S. Zagon, “Opioid Growth Factor (OGF) Improves Clinical Benefit and Survival in Patients with Advanced Pancreatic Cancer,” Open Access Journal of Clinical Trials, Vol. 2010, No. 2, 2010, pp. 1-12.
- A. Gaspari, S. K. Tyring and T. Rosen, “Beyond a Decade of 5% Imiquimod Topical Therapy,” Journal of Drugs in Dermatology, Vol. 8, No. 5, 2009, pp. 467-474.
- S. Ganjian, A. J. Ourian, G. Shamtoub, J. J. Wu and J. E. Murase. “Off-Label Indications for Imiquimod,” Dermatology Online Journal, Vol. 15, No. 5, 2009, p. 4.