Applied Mathematics
Vol.4 No.7(2013), Article ID:33949,7 pages DOI:10.4236/am.2013.47134
Modified Modeling of the Heart by Applying Nonlinear Oscillators and Designing Proper Control Signal
Department of Mathematics, Payame Noor University, Tehran, Iran
Email: siroos_nazari@yahoo.com, a_heidari@pnu.ac.ir, zj.khaligh6270@yahoo.com
Copyright © 2013 Siroos Nazari et al. This is an open access article distributed under the Creative Commons Attribution License, which permits unrestricted use, distribution, and reproduction in any medium, provided the original work is properly cited.
Received November 12, 2012; revised January 1, 2013; accepted March 1, 2013
Keywords: Heart Oscillators; Vander Pol Equations; Biological Systems; Action Potential; Control; Synchronization
ABSTRACT
Rhythmic phenomena are one of the most striking manifestations of dynamic behavior in biological systems. Understanding the mechanisms of biological rhythms, is crucial for understanding the dynamic of life. Each type of dynamic behaviors may be related to the performance of both normal physiology and pathological. Conductive system of the heart can be stimulated to action as a network of elements and these elements show the oscillatory behavior then can be modeled as nonlinear oscillators. This paper provides the mathematical model of the heart rhythm by considering different states of Vanderpol nonlinear oscillators. Proposed oscillator model is designed in order to reproduce time series of action potential of natural pacemakers cardiac, such as SA or AV nodes. So model of heart is presented by a system of differential equations and to be considered chaotic or nonchaotic for different parameters of the model by using of the 0-1 test. Finally, the model is synchronized by applying an appropriate control signal, if it is needed.
1. Introduction
Normal rhythm can be regular or irregular through time and place. Each type of dynamic behaviors related to medical systems may be related to the performance of both normal physiological and pathological groups. The very regular dynamics of heart may also show diseases including periodic: breathing, definite abnormal rhythms of the heart, cycling blood diseases, epilepsy, nervoustics and tremors. On the other hand, phenomena such as sleep and wakefulness cycles and menstrual rhythm in which have regular dynamic reflects healthy behavior [1]. Moreover, irregular rhythms can reflect diseases.
Rhythmic variations in blood pressure, heart pulse and other cardiovascular measures indicate importance of understanding the dynamic aspects of cardiovascular rhythms. Cardiac conduction system can be considered as a network of elements self stimulates, such as: SA node (the first pacemaker), AV node and His-Purkinje system. Because these elements show oscillation behavior, they can be modeled as nonlinear oscillators.
There are different methods for the evaluation of cardiac function by measuring certain signals. Strip (ECG) measures the electrical activity of the heart. Electrical signals associated with cardiac function represents electric current in different regions of the heart are recorded waveform [2].
Mathematical modeling of heart rhythm is the goal of many research efforts. Since the qualitative features of the excitation potential of heart is very close to the dynamic behavior of the classical oscillator Vanderpol [3], so this oscillator can be considered as starting point for this modeling.
For modeling, cardiac pacemaker the Vander pol oscillator, is offered to be considered as followed
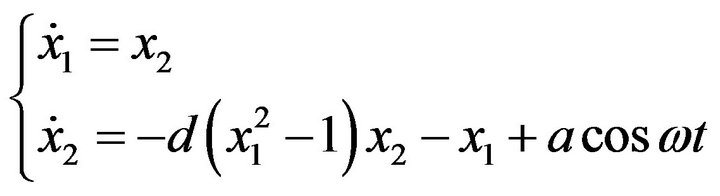 (1)
(1)
where 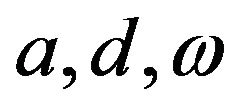 are system parameters, which depend on their amounts. The heart dynamics may be chaotic or nonchaotic.
In Section 2, briefly describes the structure and electrical activity of the heart and records of these activities by using ECG and in Section 3, we describe the mathematical model and analysis its properties in terms of physiology. In Section 4, the 0-1 test and synchronization method is presented. In Section 5, chaotic or nonchaotic of this model is examined for different parameters, by using of the 0-1 test. We will synchronize the model by applying an appropriate control signal it is if necessary. Section 5 contains the conclusions.
2. The Heart and the Record of Its Electrical Activity
The walls of the heart muscle called myocardium, which consists of four cavities, such as: right and left atrium (Upper part), and right and left ventricles (lower part). Blood returning from the systemic circulation goes into the right atrium and then right ventricle, and finally into the lungs. After being oxygenated, oxygenated blood from the lungs goes to the left atrium and left ventricle then blood through the aortic valve goes into the aorta and then is pumped in systemic circulation. Sinus node (SA node) is located in the right atrium the upper vnakavay. SA node cells are self stimulate pacemaker cells, which produce an active potential. Activation of the SA node through the atria will release, but can not be spread of the wall between the atria and ventricles. Atrio ventricular node (AV node) is located at boundary between the atria and ventricles. In a normal heart, node AV provides the only guidance signals of atrial to ventricular. So, in unusual conditions, the ventricles can stimulate only through pulses that will be spread among them.
There are different methods for the assessment of cardiac function is done by measuring certain signals, including tape (ECG) is the recording of the waves of electrical activity of the heart record by putting electrodes on the chest and around the heart. Each of the components on tape indicates the electrical activity of the heart cells. Stimulates sinus node cause electrical stimulation of the atria and creates a P wave, that is the wave of atrial depolarization. After the wave of ventricular depolarization, the QRS complex series arise, and the subsequent wave creates T wave by ventricular repolarization. Sometimes another small wave after wave of T is seen that is called U wave. The reason of creation of the wave is repolarization papillary muscles in the heart. In distance of this waves. There is no appropriate electrical activity and electrogram draws a horizontal straight line that is called the isoelectric line (Figure 1).
In general, signal waves are as follow [4].
Wave P: The first wave was recorded in the ECG, and indicates right atrial activation after stimulation of the sinus node. Typically lasts between 60 and 90 milliseconds in the adults, its shape is round and has a maximum range between 0.25 and 0.30 volts.
Interval PR: From beginning of P wave to beginning of the QRS complex and lasts 90 ms.
Complex QRS: Is composed of three waves and sum of total of three waves is indicated depolarization. The
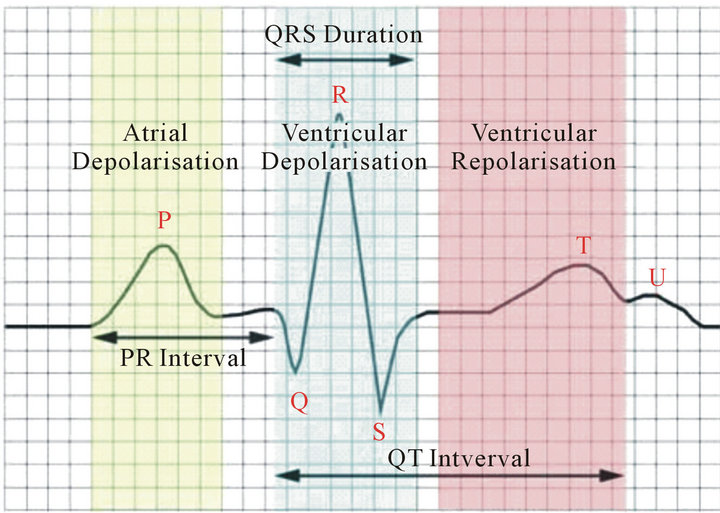
Figure 1. ECG description.
first negative wave after P wave is Q. The first positive wave after P wave is R, and the first negative wave after of R, is called S. Because of all three waves may be not seen, the sum of these three waves together is called a QRS complex.
Interval ST: Starts from the end of QRS complex and lasts to the begining of the T wave and is part of process of the repolarization.
Wave T: Indicates ventricular activation and has a circular shape with amplitude is 0.60 volts.
3. Mathematical Model of the Heart
The idea modeling of the heartbeat system with coupled nonlinear oscillators, first was explained in 1928 by Vander pol and Vander mark. Cardiac conduction system may be assumed as a self stimulate pacemaker that is composed of two oscillator subsystems. The first subsystem is atrial sinus node (SA) that between other oscillators of heart has the highest pulse (60 - 100 impulse per minute). The second subsystem consists of AV node (40 - 60 impulse per minute). Fluctuation of sinus node and atrioventricular node (AV) can be nonlinear modeled equations of two coupled oscillator Vander pol.
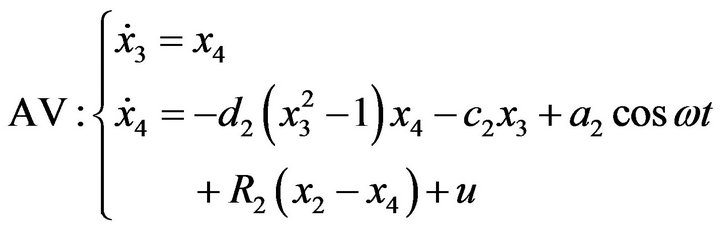
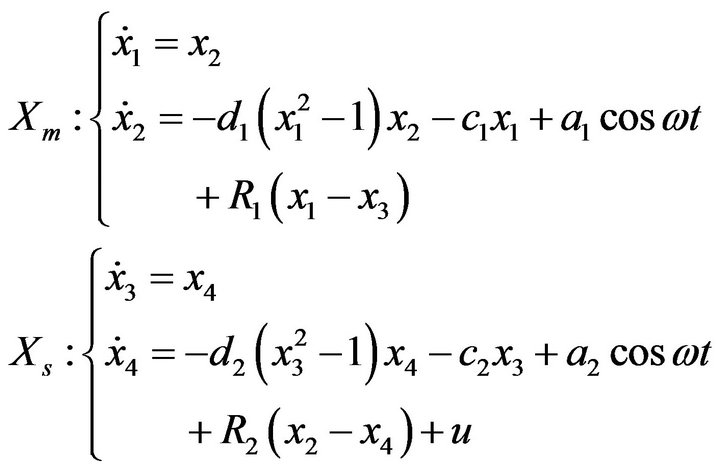
Modeling the interaction between the oscillators heart model is considered the following equation [5-7],
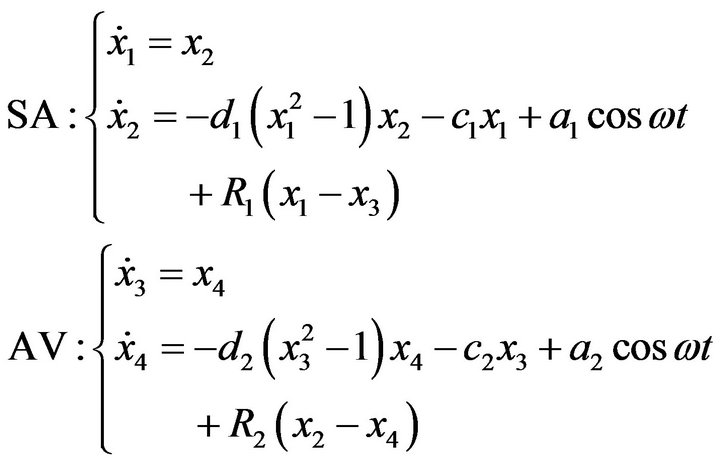 (2)
(2)
where pairs  and
and , respectively, show SA and AV oscillators. Frequency of the SA node is denoted by c1 and frequency of the AV node, is denoted by c2. and
  express coupling coefficients between two nodes. If
  indicates that only oscillator SA affects on oscillator AV in a physiological way. The condition
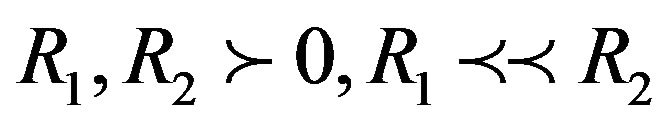 , indicates this fact that node AV has little effect on the SA node. Coefficients
  and
and  affects on term of nonlinear equation, and cause stability of limit cycle in the phase plate
  that a limit cycle is adapted with the behavior of the heart in a physiological way.
As was mentioned earlier, first normal cardiac rhythm is produced by SA node (Pacemaker normal) and causes stimulate the AV node. However, it was observed that the two oscillators for producing ECG signals are not very accurate. This is because, the signal of first oscillator is related to the activation of SA node and right atrium, the signal of second oscillator is of only related to the left ventricular depolarization. According to this hypothesis, it is possible to produce P curve, but complex QRS may not be produced, because this distance is mainly due to ventricular repolarization. These observations make us incorporate a third oscillator, which represents the spread of a pulse through the heart, that indicate His-Purkinje complex in a Physiological way.
In order to create a general model, we assume that all oscillators should be coupled asymmetry. In addition, external stimulation is entered into the system with regard to the oscillator frequency.
This developed model can be shown with a set of differential equations as follows
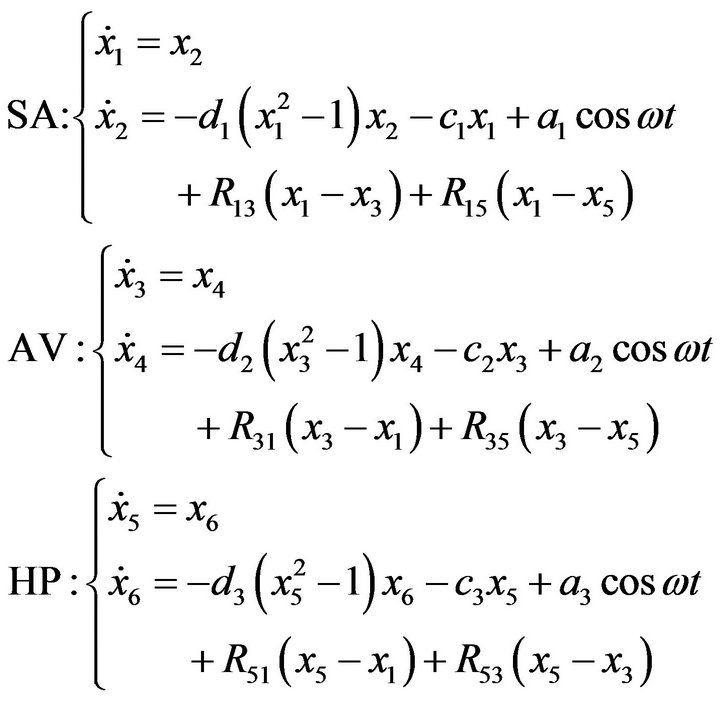 (3)
(3)
where coefficients  and
and  expressed in the prevous formula and the coupling coefficients of
  are between pair oscillators. Because even small delays may alter the dynamics of the system, differential equations incorporating time delay can cause drastic changes and creation of chaos in the system that described by the regular behavior.
Accordingly, proposed mathematical model can change to consideration of aspects of delay in coupling terms. Thus, the governing equations is changed as following, where  and
and , are time delay.
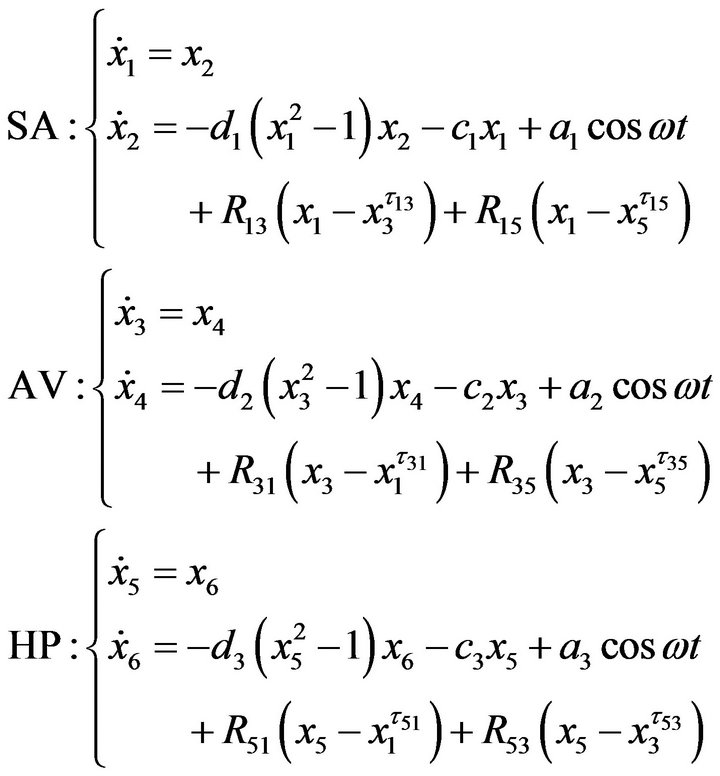 (4)
(4)
4. Applying the 0-1 Test and Synchronization to Study Chaotic Heart Model
4.1. Description of the 0-1 Test and Synchronization Method
This test was proposed in 2003 by Gatvald and Melbourne. Also, this test is used to detect the dynamical system with is chaotic or nonchaotic [8-11].
This method directly is implemented on the time series which is made from the original system. If out put is close to 1 that system is chaotic and if, is close to 0 it will be nonchaotic.
Suppose,  is the answer of dynamical system, and
  is a arbitrary observation function of the system, for example
 . By choosing an arbitrary positive constant
 , we define
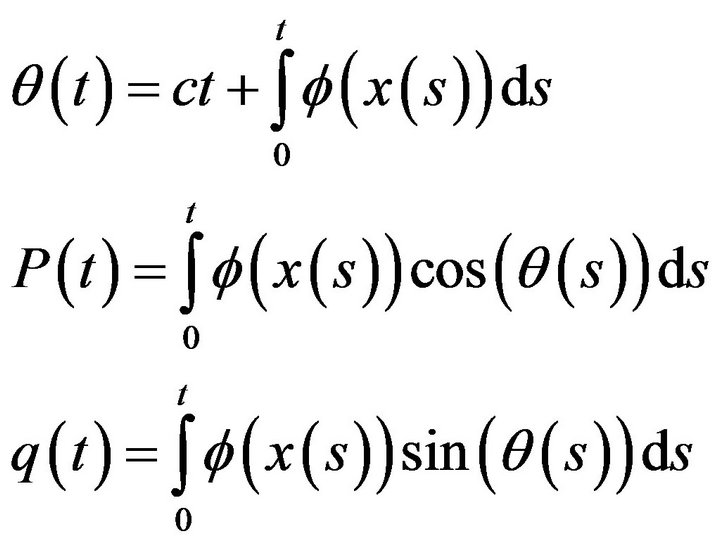
Now, for detection chaotic of system the growth of the functions  and
and  is determined. Therefore, we define function
  as follows

Also, asymptotic growth rate of function  are defined as follow
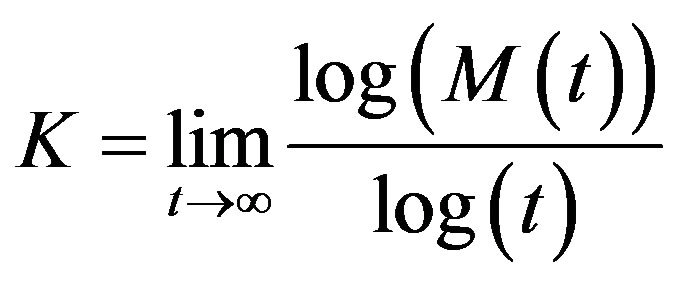
Now, If K is close to zero, the system is not chaotic, and if is near one, the system is chaotic.
The synchronization of chaos is process in which two or more identical or non-identical chaotic systems, a distinct feature of motion set through a foreign force to achieve a set of common behaviors.
The most common configuration for synchronous systems is considered as two subsystems are coupled, the one as slave system and the other as the master system.
Purpose of synchronous this is that slave system follow dynamics of master system. Chaotic systems, according to the type and intensity of the coupling between the two systems is established, with different methods are synchronous with each other.
For clarification, the following relationship between slave and master systems, respectively, as we think
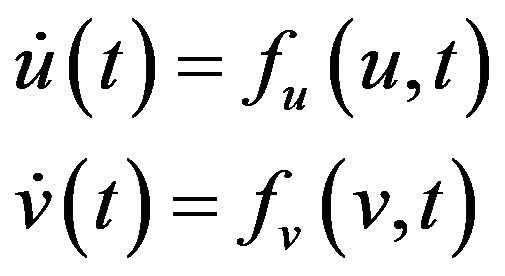
where  the system state variables
 , and
, and  are chaotic nonlinear functions. These two systems can, by applying an appropriate control signal, and the special relationship between their trajectories, be synchronous.
In this case we have
Functions  and
and  determine the optimum relationship between state variables systems. In fact, they specify the type of synchronization.
4.2. Applying the 0-1 Test to Study Chaotic Heart Model
The results of the 0-1 test using the MATLAB, for one, two and three oscillators model are as follow
For the one oscillator system, with hypothesis
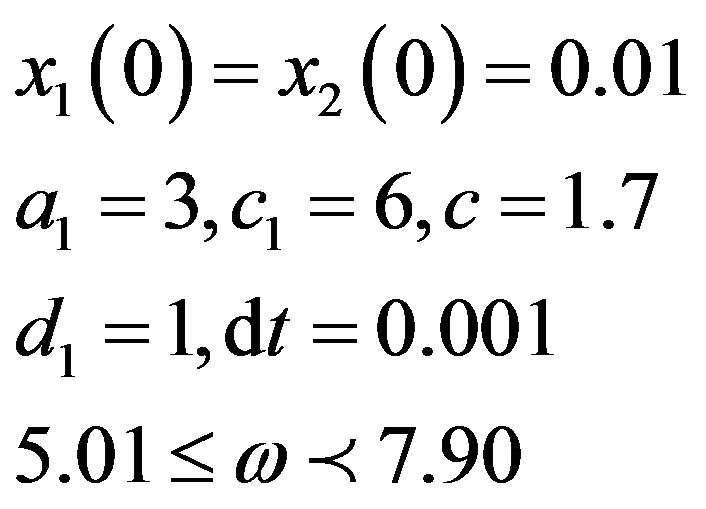
The system is chaotic .
.
With hypothesis
The system is nonchaotic (Figure 2).
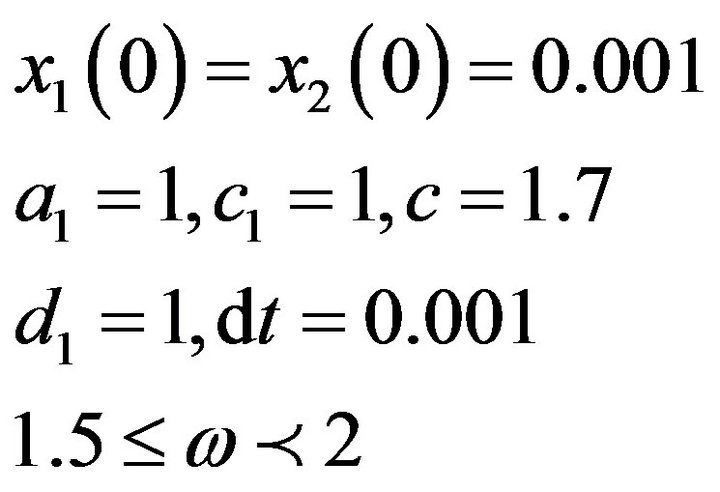
For the two oscillators system, with hypothesis
The system is nonchaotic .
.
With hypothesis
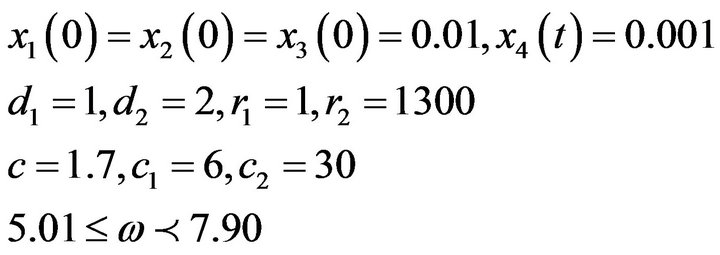
The system is chaotic  (Figure 3).
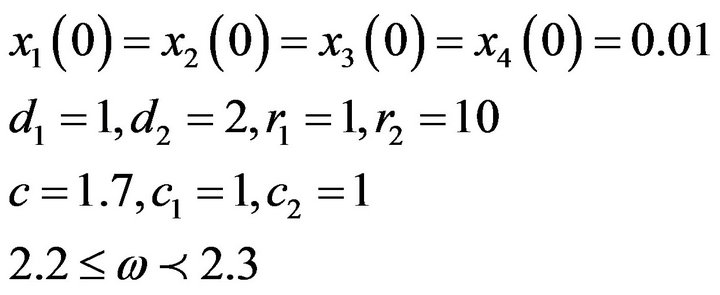
For the three oscillators system, with hypothesis
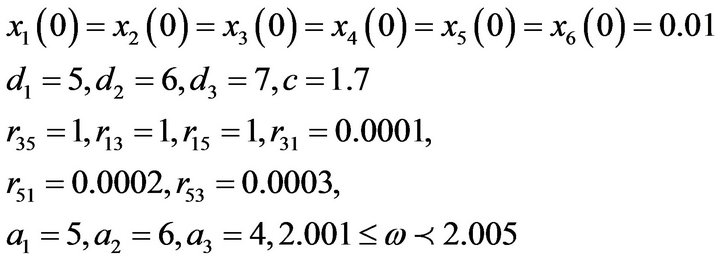
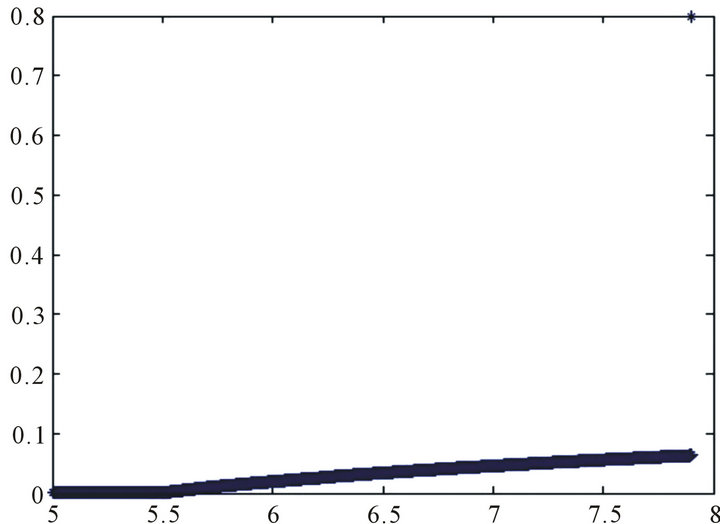
Figure 2. Performance of test 0-1 for one oscillator model.
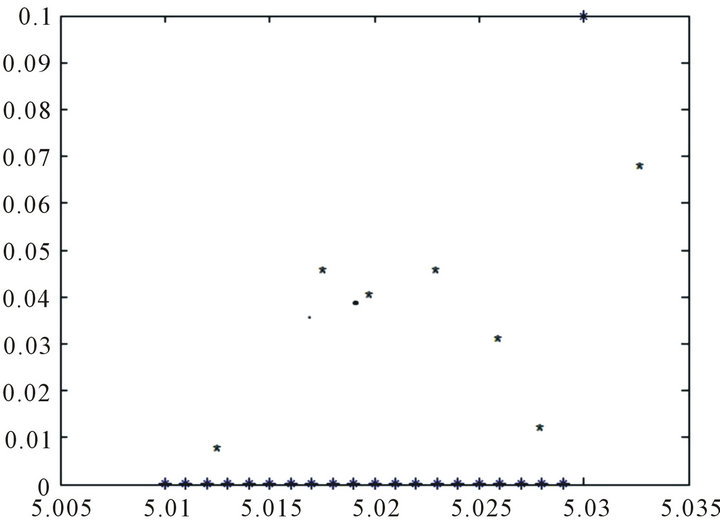
Figure 3. Performance of test 0-1 for two oscillator model.
The system is nonchaotic .
.
With hypothesis
The system is chaotic  (Figures 4 and 5).
5. Designing Proper Control Signal
In problem of synchronization of system explained in Equations (2), First system is considered as master system and second system as a slave system, Figure 6. However, by applying a suitable control signal on it, which has the form
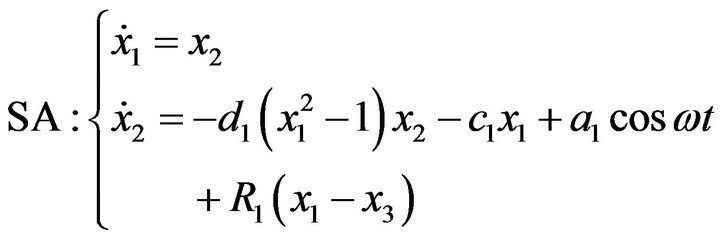
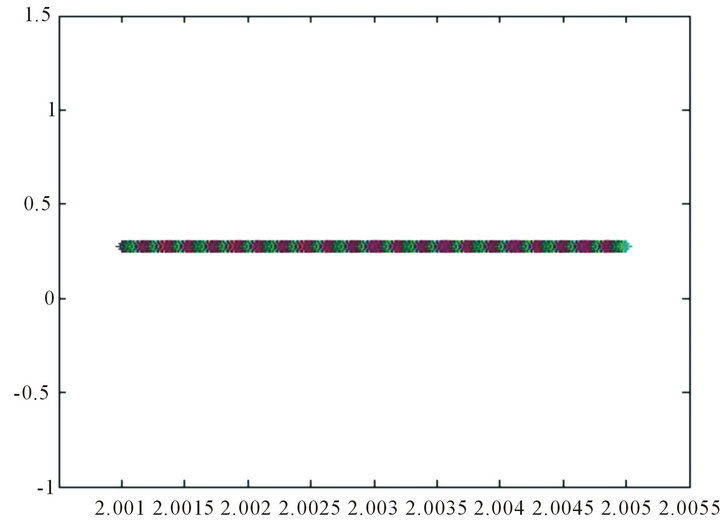
Figure 4. Performance of test 0-1 for three oscillator model.
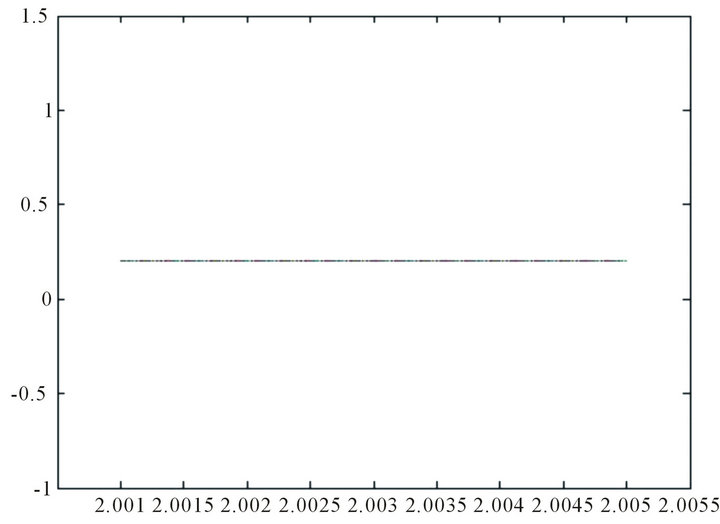
Figure 5. Performance of test 0-1 for three oscillator model.
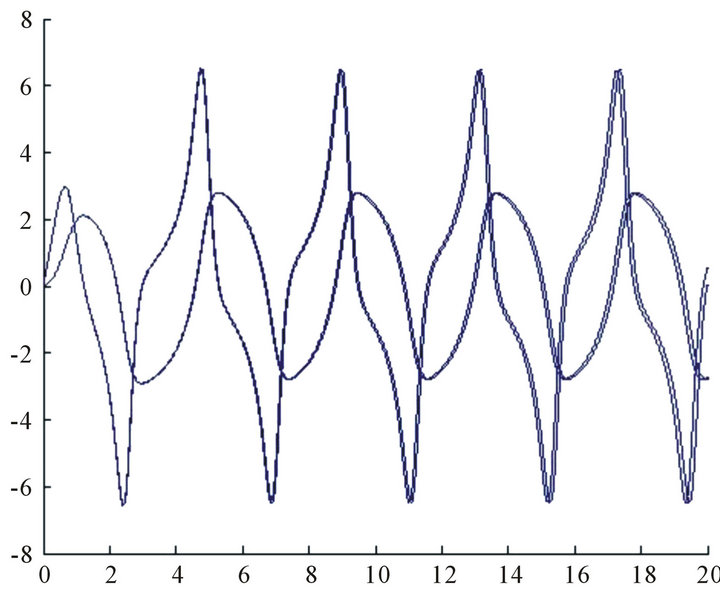
Figure 6. Two oscillator diagram befor applying synchronization.
A state variables of system slave will converget to state variables of system master after a transient time. In fact, the second oscillator has to follow the behavior of the first oscillator, which has a dominant frequency.
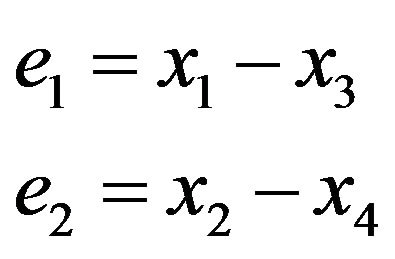
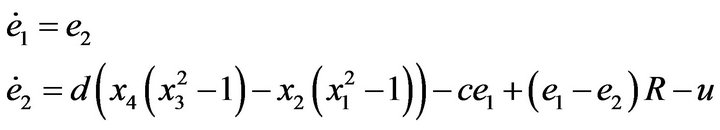
Since we want the slave system state variables to converge to the master system state variables after a transient time, the error of synchronization should be considered as follow [12-15].
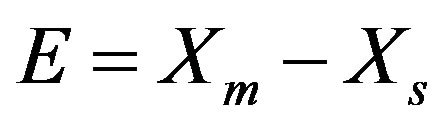
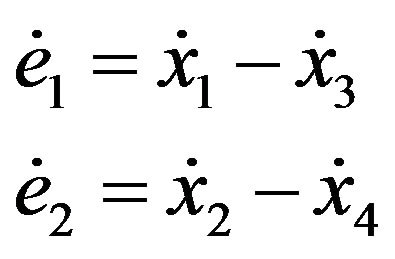
Therefore have
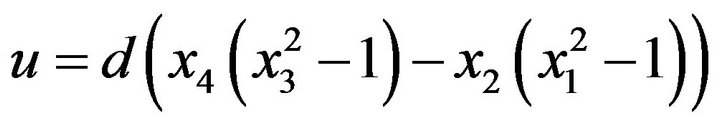
The purpose of the synchronization is to vanish the error. Therefore, control signal is calculated as follow
With placement, have
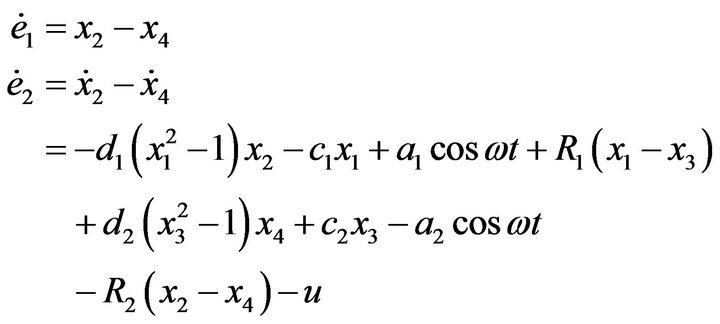
In this case
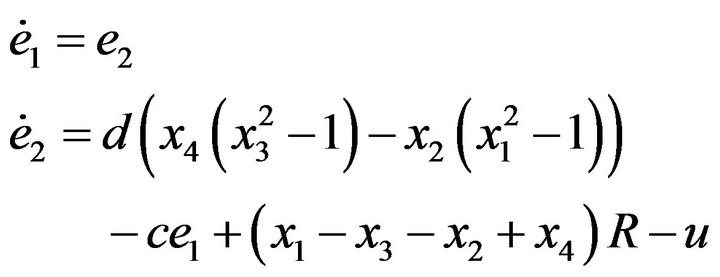
Have
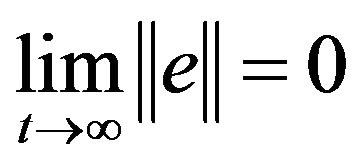
And, our goal is to find proper control functions  , such that subsystems of Equation (2) asymptotically synchronize. i.e.
where  for this end, we propose the following control laws for system Equation (2)
With applying the control u and with retesting of 0-1, [16-18], and simulation we will see that,  synchronize
  and
and  synchronize
  (Figures 7 and 8).
6. Conclusion
In this paper, we have shown that nonlinear oscillators can be used to model the heartbeat activity. Also mathematical modeling of dynamic rhythm was provided in
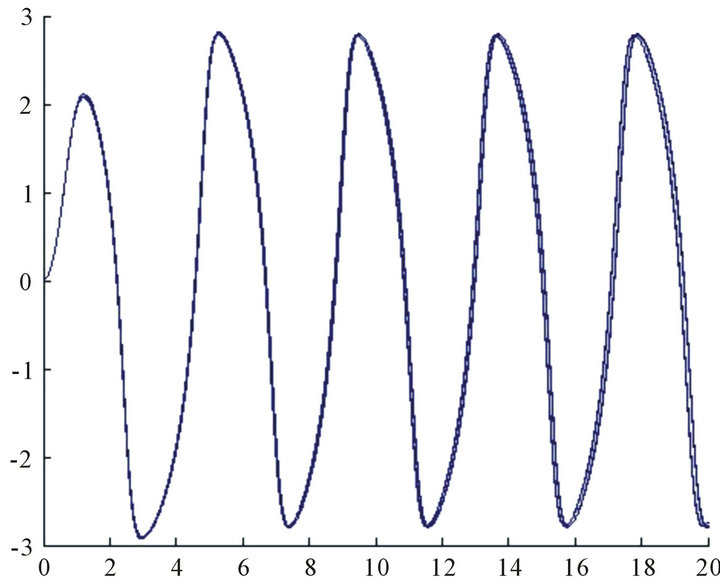
Figure 7. Synchronization of x1 and x3.
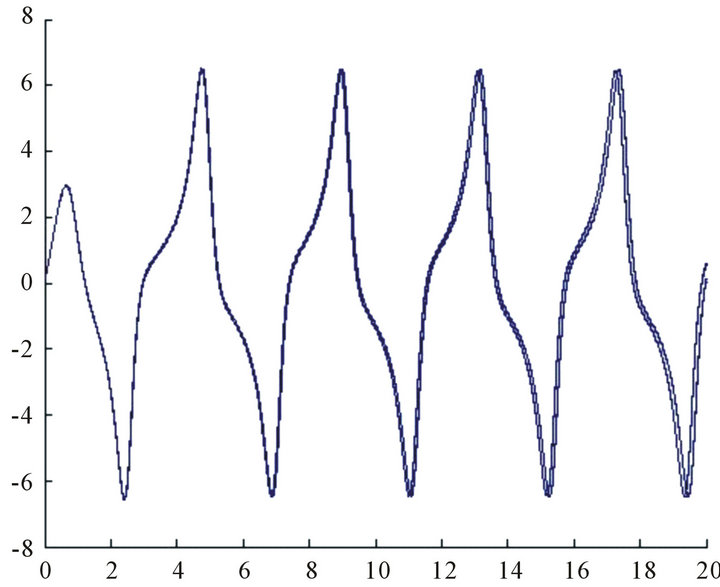
Figure 8. Synchronization of x2 and x4.
different states of single oscillator, two oscillators and three oscillators, and was modified by applying the 0-1 test. We have shown that heart model for parameters can be chaotic or nonchaotic. Numerical simulations are carried out to show that the proposed model is capable to capture the general heartbeat dynamics, representing the normal ECG form with P, QRS and T waves. Afterwards, some pathological rhythms are of concern by establishing different coupling situations. Basically, it is assumed some communication interruptions are in the heart electric system. Finally, by applying a proper control signal, we have Synchronized the model if necessary. In this model, each oscillator represents one of the heart natural important pacemaker: atrial sinus node (node SA) and atrial ventricular (node AV) and His-Purkinje complex.
REFERENCES
- L. Glass, “Synchronization and Rhythmic Processes in Physiology,” Nature, Vol. 410, No. 6825, 2001, pp. 277- 284.
- M. A. Savi, “Nonlinear Dynamics and Chaos,” Editora EPapers, 2006 (in Portuguese).
- B. Van Der Pol and J. Van Der Mark, “The Heartbeat Considered as a Relaxation Oscillator and an Electrical Model of the Heart,” Philosophical Magazine and Journal of Science Series, Vol. 7, No. S6, 1928, pp. 763-775.
- P. J. Moffa and P. C. R. Sanches, “Eletrocardiograma Normal e Patologico,” 2001.
- M. A. Savi, F. H. I. Pereira-Pinto and A. M. Ferreira, “Chaos Control in Mechanical Systems,” Shock and Vibration, Vol. 13, No. 4-5, 2006, pp. 301-314.
- M. A. Savi, “Chaos and Order in Biomedical Rhythms,” Journal of the Brazilian Society of Mechanical Sciences and Engineering, Vol. 27, No. 2, 2005, pp. 157-169.
- B. Van Der Pol, “On Relaxation Oscillations,” Philosophical Magazine, Vol. 2, No. 11, 1926, pp. 978-992.
- G. Gottwald and L. Melbourne, “On the Implementation of the 0-1 Test for Chaos,” SIAM Journal on Applied Dynamical Systems, Vol. 8, No. 1, 2009, pp. 129-145. doi:10.1137/080718851.
- G. Gottwald and L. Melbourne, “On the Validity of the 0-1 Test for Chaos,” 2009. http://www.maths.usyd.edu.au/u/gottwald/publications.html.
- G. Gottwald and L. Melbourne, “A New Test for Chaos in Deterministic Systems,” Nonlinear Dynamics, 2012, in Press. doi:10.1007/s11071-012-0344-z
- R. Ferriere and G. A. Fox, “Chaos and Evolution,” Trends in Ecology & Evolution, Vol. 10, No. 12, 1995, pp. 480- 485.
- L. M. Pecora and T. L. C. arroll, “Synchronization in Chaotic Systems,” Physical Review Letters, Vol. 64, No. 8, 1990, pp. 821-824. doi:10.1103/PhysRevLett.64.821
- A. M. Santos, S. R. Lopes and R. L. Viana, “Rhythm Synchronization and Chaotic Modulation of Coupled Vander Pol Oscillators in a Model for the Heartbeat,” Physica A, Vol. 338, No. 3, 2004, pp. 335-355.
- F. X. Witkowski, K. M. Kavanagh, P. A. Penkoske, R. Plonsey, M. L. Spano and W. L. Ditto, “Evidence for Determinism in Ventricular Fibrillation,” Physical Review Letters, Vol. 75, No. 6, 1995, pp. 1230-1233. doi:10.1103/PhysRevLett.75.1230
- F. H. I. Pereira-Pinto, A. M. Ferreira and M. A. Savi, “Chaos Control in a Nonlinear Pendulum Using a SemiContinuous Method. Chaos,” Solitons & Fractal, Vol. 22, No. 3, 2004, pp. 653-668.
- A. Syta, M. Budhraja and L. M. Saha, “Detection of the Chaotic Behaviour of a Bouncing Ball by the 0-1,” Journal: Physical Review Letters, Vol. 48, No. 1, 1982, pp. 7- 10.
- G. Chen, J. L. Moiola and H. O. Wang, “Bifurcation Control: Theories, Methods, and Application,” International Journal of Bifurcation and Chaos, Vol. 10, No. 3, 2000, pp. 511-548.
- X. Yu, Y. Tian and G. Chen, “Time Delayed Feedback Control of Chaos,” In: Controlling Bifurcation and Chaos in Engineering System, CRC Press, Boca Raton, 2000.